
Ever been lost on the road without a map or GPS? Before long, you’ll end up down a dead-end street or lose track of your destination.
It’s easy to make the same mistake when running a branded content campaign. Accurate traffic, leads, and engagement stats keep you on track—maximizing the impact of each campaign.
Actionable analytics answer crucial questions in real-time, such as:
- How did specific pieces of content perform?
- Did this ad drive engaged readers?
- What content strategies should we try?
Branded content campaigns benefit from this feedback and guidance—helping you fine-tune content for each advertiser. Knowing which metrics make the biggest difference (and how to use data best) provides a clear roadmap going forward.
Key takeaways
- Branded content analytics gives publishers the data they need to optimize their program on the individual campaign and macro levels.
- In today’s competitive branded content market, publishers need to focus on in-depth engagement metrics to show the full value they provide.
- Using an automated branded content analytics tool lightens the heavy lift of pulling campaign data from multiple platforms and puts program optimization within reach—even if your team is resource-strapped.
What are branded content analytics and why are they important?
Branded or sponsored content is when an advertiser pays a publisher to create and promote articles, videos, and other assets. Unlike commerce content, branded content may look organic but carries a “paid placement” disclaimer.
Companies tap into the publisher’s audience to connect with their ideal customers—and rely on publisher expertise to craft content that boosts brand awareness.
Branded content analytics give crucial context to these collaborations, showing the full spectrum of campaign performance.
The metrics fall into two categories:
Distribution metrics cover social and ad data following the user journey. This can include clicks, views, and engagements.
Content metrics measure how users interact with your content. This includes metrics such as number of reads, average scroll depth, and time spent on the page.
Using analytics to create better campaigns
Publishers typically have contractual obligations to deliver specific results to advertisers.
Some examples of success metrics for branded content deals include:
- Ad impressions
- Article reads
- Video views
- Leads generated
- Click-throughs to the brand’s website
Closely monitoring campaign metrics allows you to pivot strategies and stay on track toward those goals. You may also benefit from tracking your campaigns in the aggregate. A macro-level view of program performance can provide valuable insights that can be applied across campaigns.

Considering other branded content pricing models?
What is the difference between branded content analytics and other marketing analytics?
Branded content analytics look almost identical to what you’d use for a standard marketing campaign.
However, normal marketing analytics may focus on broader metrics like page views and clicks. Branded content analytics should dive deeper into engagement to provide maximum value.
Why advertisers care about engagement
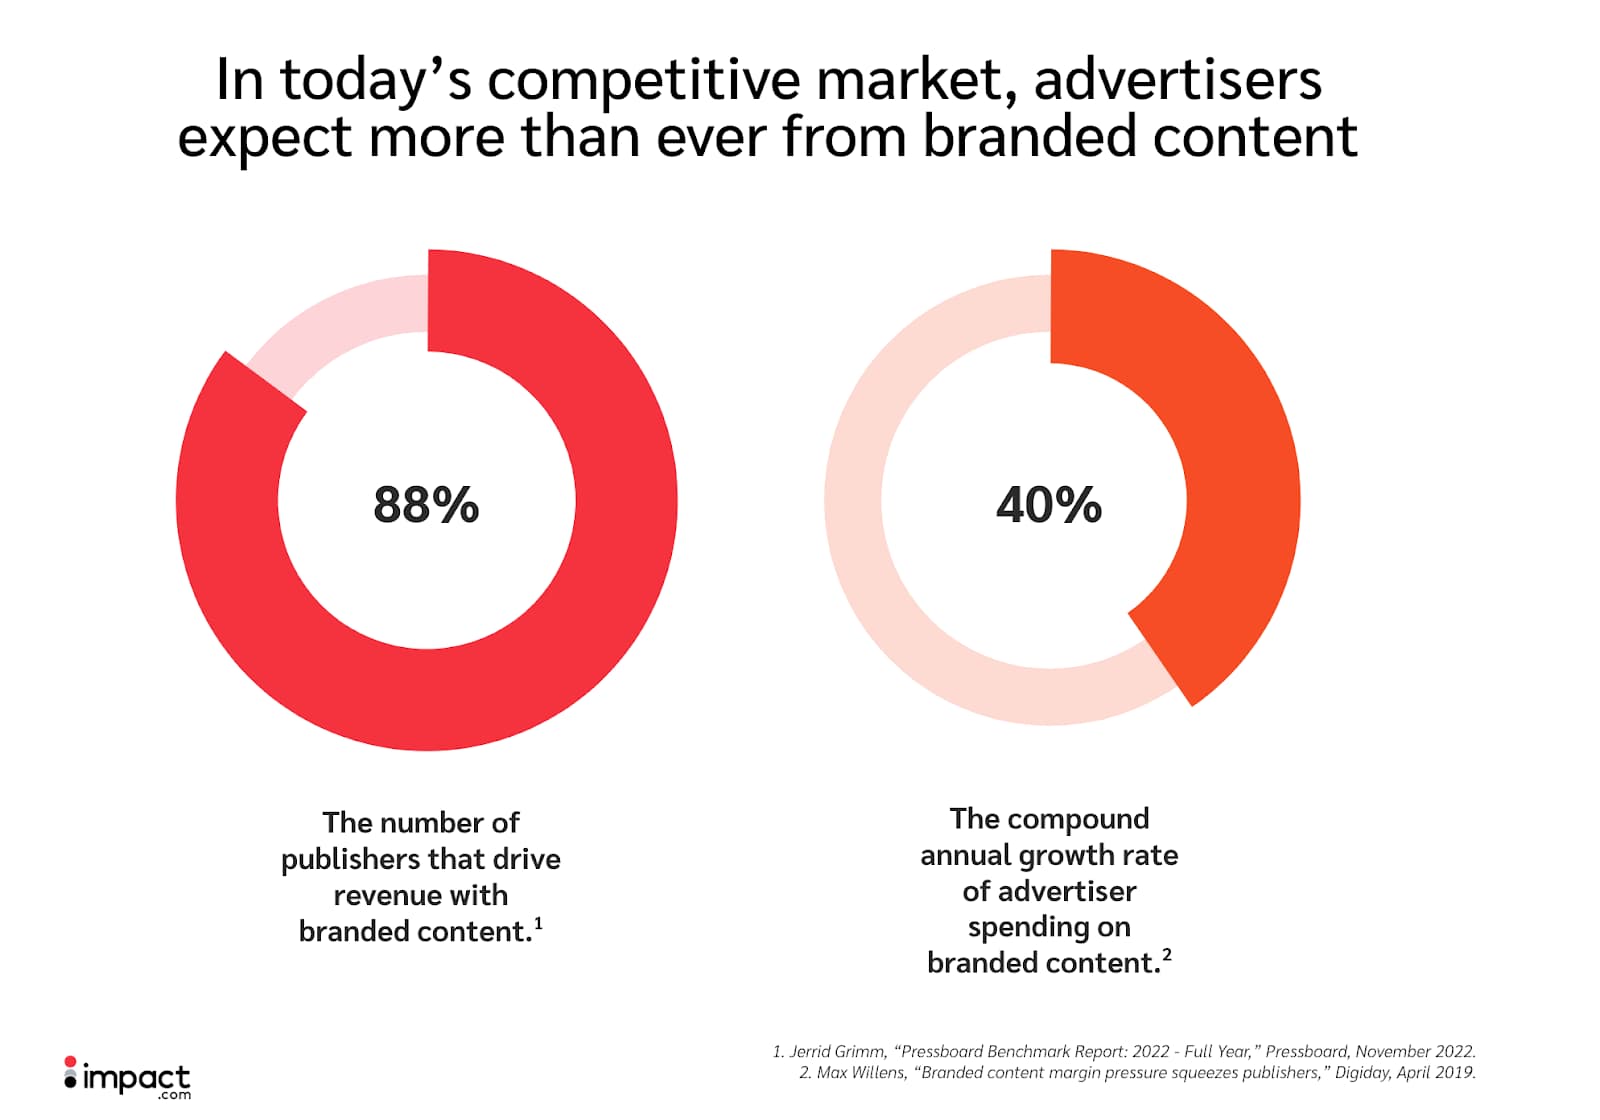
In the last decade, branded content has become a common tool in brand marketer toolboxes. Advertiser spending on branded content has a compound annual growth rate of 40 percent, and branded content drives revenue for 88 percent of publishers.
With this growth, many advertisers expect more ROI from branded content than ever. They don’t just want people to see the content—they want to know if the audience absorbs the brand’s message.
Branded content KPIs you should be tracking
With branded content, you can never have too much information. The more data you have, the more accurate your campaign projections will be.
These key analytics provide the best context for optimizing your branded content.
Distribution metrics lower campaign costs
Keeping an eye on distribution metrics helps you optimize your campaigns as you go.
Some examples of campaign distribution metrics include:
- Ad clicks
- Ad impressions
- Social media post performance
- Cost per mille (CPM)
By monitoring distribution metrics, you can fulfill your contractual obligations to advertisers and keep campaign operating costs under control. This is especially important if you sell branded content on a CPM basis.

Engagement metrics prime content for maximum impact
Engagement metrics give crucial context that can improve the overall effectiveness of your program. This is crucial for shoring up branded content as a revenue stream—especially when you have a small team or a limited budget.
Reads let you know who visited your content
When measuring advertiser ROI, ad impressions don’t tell the whole story. You want to know how many people looked at the content itself.
Unique reads or views show how many individuals read an article or watched a video. Meanwhile, total reads provide context for who is returning to your content.
Highlighting these metrics shows value to advertisers. Many publishers have switched to a cost-per-read (CPR) payment model because advertisers want high-quality engagement above all.
Engaged reads let you know who stayed
Reads still don’t provide the complete picture. Visitors may glance at the content and click away moments later, with many users leaving web pages in under 20 seconds.
To communicate your content’s value to advertisers, know how much time each person spends on your page. Did they skim over your article or did they engage line by line?
With Pressboard by impact.com’s powerful tracking features, you can measure engaged reads. Pressboard defines an engaged read as any read over 10 seconds long.
Scrolls reveal the depth of user attention
To earn user attention for several minutes, studies show that the content must communicate value within 10 seconds. But how do you know if your content makes the cut?
Scroll depth reveals how much your article grabs readers. If people rarely scroll past the first paragraph, it’s time to switch up your content strategy.
This proprietary metric from Pressboard highlights exactly when you capture or lose readers. Checking scroll depth also shows your posts’ average completion rate, potentially providing another metric to prove your content’s value to advertisers.
Link clicks show more value to advertisers
Many branded content pieces direct readers to product pages or company websites through in-article links. Pressboard provides data for each link within an article, showing which inspired people to click and which were ignored.
In-article link activity metrics break down link performance and pinpoint the strategies that work.

Audience information demonstrates campaign value
The better you understand your audience, the more valuable your content becomes. Collect these data points to tailor your campaigns, maximize performance, and craft more impactful pitches to advertisers.
Demographics show who your audience is
Demographic metrics paint a detailed picture of who tunes into your campaigns. Examples of demographic information include:
- Age
- Gender
- Geography
These metrics help you bolster campaign value by showing advertisers who consumes their content. In the aggregate, this information can also reveal which audiences you best cater to as a publisher. Understanding your ideal target audience can help sell prospective advertisers on future campaigns.
Devices point to optimization opportunities
See which devices people use to click on your ads and consume your content. You can optimize future content by tracking device information to ensure it always functions and looks its best.

Putting branded content data into action
Analyzing content performance and making strategic campaign changes helps you stay ahead of your competition. These metrics aren’t just nice to have: they provide actionable insights to improve branded content as a revenue stream.
Course-correct current branded content campaigns
Understanding holistic performance keeps your campaigns on track as they progress. Performance metrics create a feedback loop guiding you toward your next campaign milestone.
For example, if you guarantee an advertiser a certain number of branded content reads, you can use performance metrics to:
- Notice that read metrics are lower than usual and aren’t on track to reach your goal.
- Adjust your Facebook ad approach to drive more traffic to the content.
- Monitor your metrics to see if your new ads noticeably affect traffic. (If the numbers climb, your ad optimization worked. If there’s no noticeable change, you can quickly save time and switch strategies.)
In another example, you may guarantee a certain number of impressions on ads promoting branded content. You then use metrics to:
- See that you’ll likely far exceed your contracted impressions
- Cut your spend on the ad campaign, reducing waste while still hitting your client’s goal
Use analytics to pivot your strategy so you can hit (or exceed) each campaign goal every time.
Plan future campaigns strategically
Actionable data affects future campaigns too. Look at your campaign data in the aggregate. Notice what works and what doesn’t. If you use campaign metrics as your guide, performance data such as unique reads and scroll depth should improve over time.
Not seeing many engaged reads from mobile device users across campaigns? After tweaking the content design and optimizing for mobile, you can quickly monitor future campaigns to see if your changes paid off.
Highlight your strengths with prospective advertisers
Tracking the right metrics builds a complete picture of your content’s performance and improvement over time—helping you win over more advertisers.
Share your analytics with prospective clients to show where your program excels. For example, if a prospect wants to drive traffic to their website, offer them clear reports showing your average click-thru rate and how they compare to industry benchmarks.
Once you benchmark your program against several key data points, you give clients a better understanding of your strengths and set your advertiser relationships up for success.

Automation is the key to scaling
Measuring your branded content performance with automation
Campaign optimization requires visibility into the details. You can’t make successful changes in the dark. Unfortunately, it’s often difficult to get your hands on holistic data.
Most publishers collect and quantify metrics manually by:
- Logging into Google Analytics to pull on-page metrics
- Checking cross-platform information on Oracle Moat
- Pulling performance data from different ad platforms and trackers
- Gathering paid and organic post performance metrics from each social platform
This arduous process requires multiple logins and significantly eats into your time.
The alternative is automated data aggregation. With the right software and support, you can have a real-time, big-picture view of your branded content.
You can automatically pull campaign data into a unified dashboard using Pressboard—part of the impact.com for Publishers suite. Measure in-depth metrics that provide singular insights into branded content performance.
By automatically pulling data across platforms, you can see how:
- Each channel moves the needle
- To improve engagement
- To raise performance benchmarks
The dashboard can be accessed anytime, allowing you to reach your goals. You can also share this dashboard with advertisers, giving them quick insight into campaign performance.
Discover how your branded content program compares to some of the world’s top publishers. Read our 2022 Pressboard Benchmark Report.