
Optimize
Every partner in your program has a role. Now you can see it
Some partners introduce customers. Some build consideration. Some close. Optimize shows you who's driving incremental value, who's bringing in customers that stay, and where you stand against the market.

The full picture changes every decision you make
Affiliate program optimization starts with seeing every partner's role across the conversion journey—not just who was last in the room. Know which partners to protect, which to scale, and which commissions to restructure. Benchmark against peers, forecast 90 days out, and identify who consistently brings your highest-value customers.
Optimize is the intelligence layer behind every one of those calls.

ATTRIBUTION INTELLIGENCE
Give every partner credit for the role they actually play
The Contribution Report shows the full conversion journey—who introduced the customer, who built the case, who closed the sale. Solo and assisted actions, up to two years back, so you know exactly which partners earn their place at the top of the funnel.
Incrementality goes further: a U-shaped attribution model that quantifies what each partner is actually worth, down to the percentage. Your budget conversations run on evidence, not assumption.
Contribution report
Introducers, Influencers, Closers—see every role in the path to purchase. Filter by partner, channel, or ad. Up to two years of data.
Incrementality dashboard
U-shaped attribution model distributes credit across all touchpoints. Group Benchmarks and High/Low reports surface your most valuable partners.
Leapfrogging reports
See which partners win credit at the final stage, and which high-value partners deserve more. Net Leapfrogged Payout quantifies the gap.

CUSTOMER QUALITY
The partners who grow your audience are worth more. Now you can prove it
The Customer Value Report distinguishes new customers from repeat buyers at the partner level. So you see which partners are genuinely expanding your audience, and which are just converting people who'd have bought anyway. Build commission structures that reward new customer acquisition, not just volume.
The Behavior Report maps the journey itself: average path time, steps to conversion, and which interactions produce the most efficient paths to purchase. Spot the partners driving same-day conversions and the ones working best at the top of the funnel.
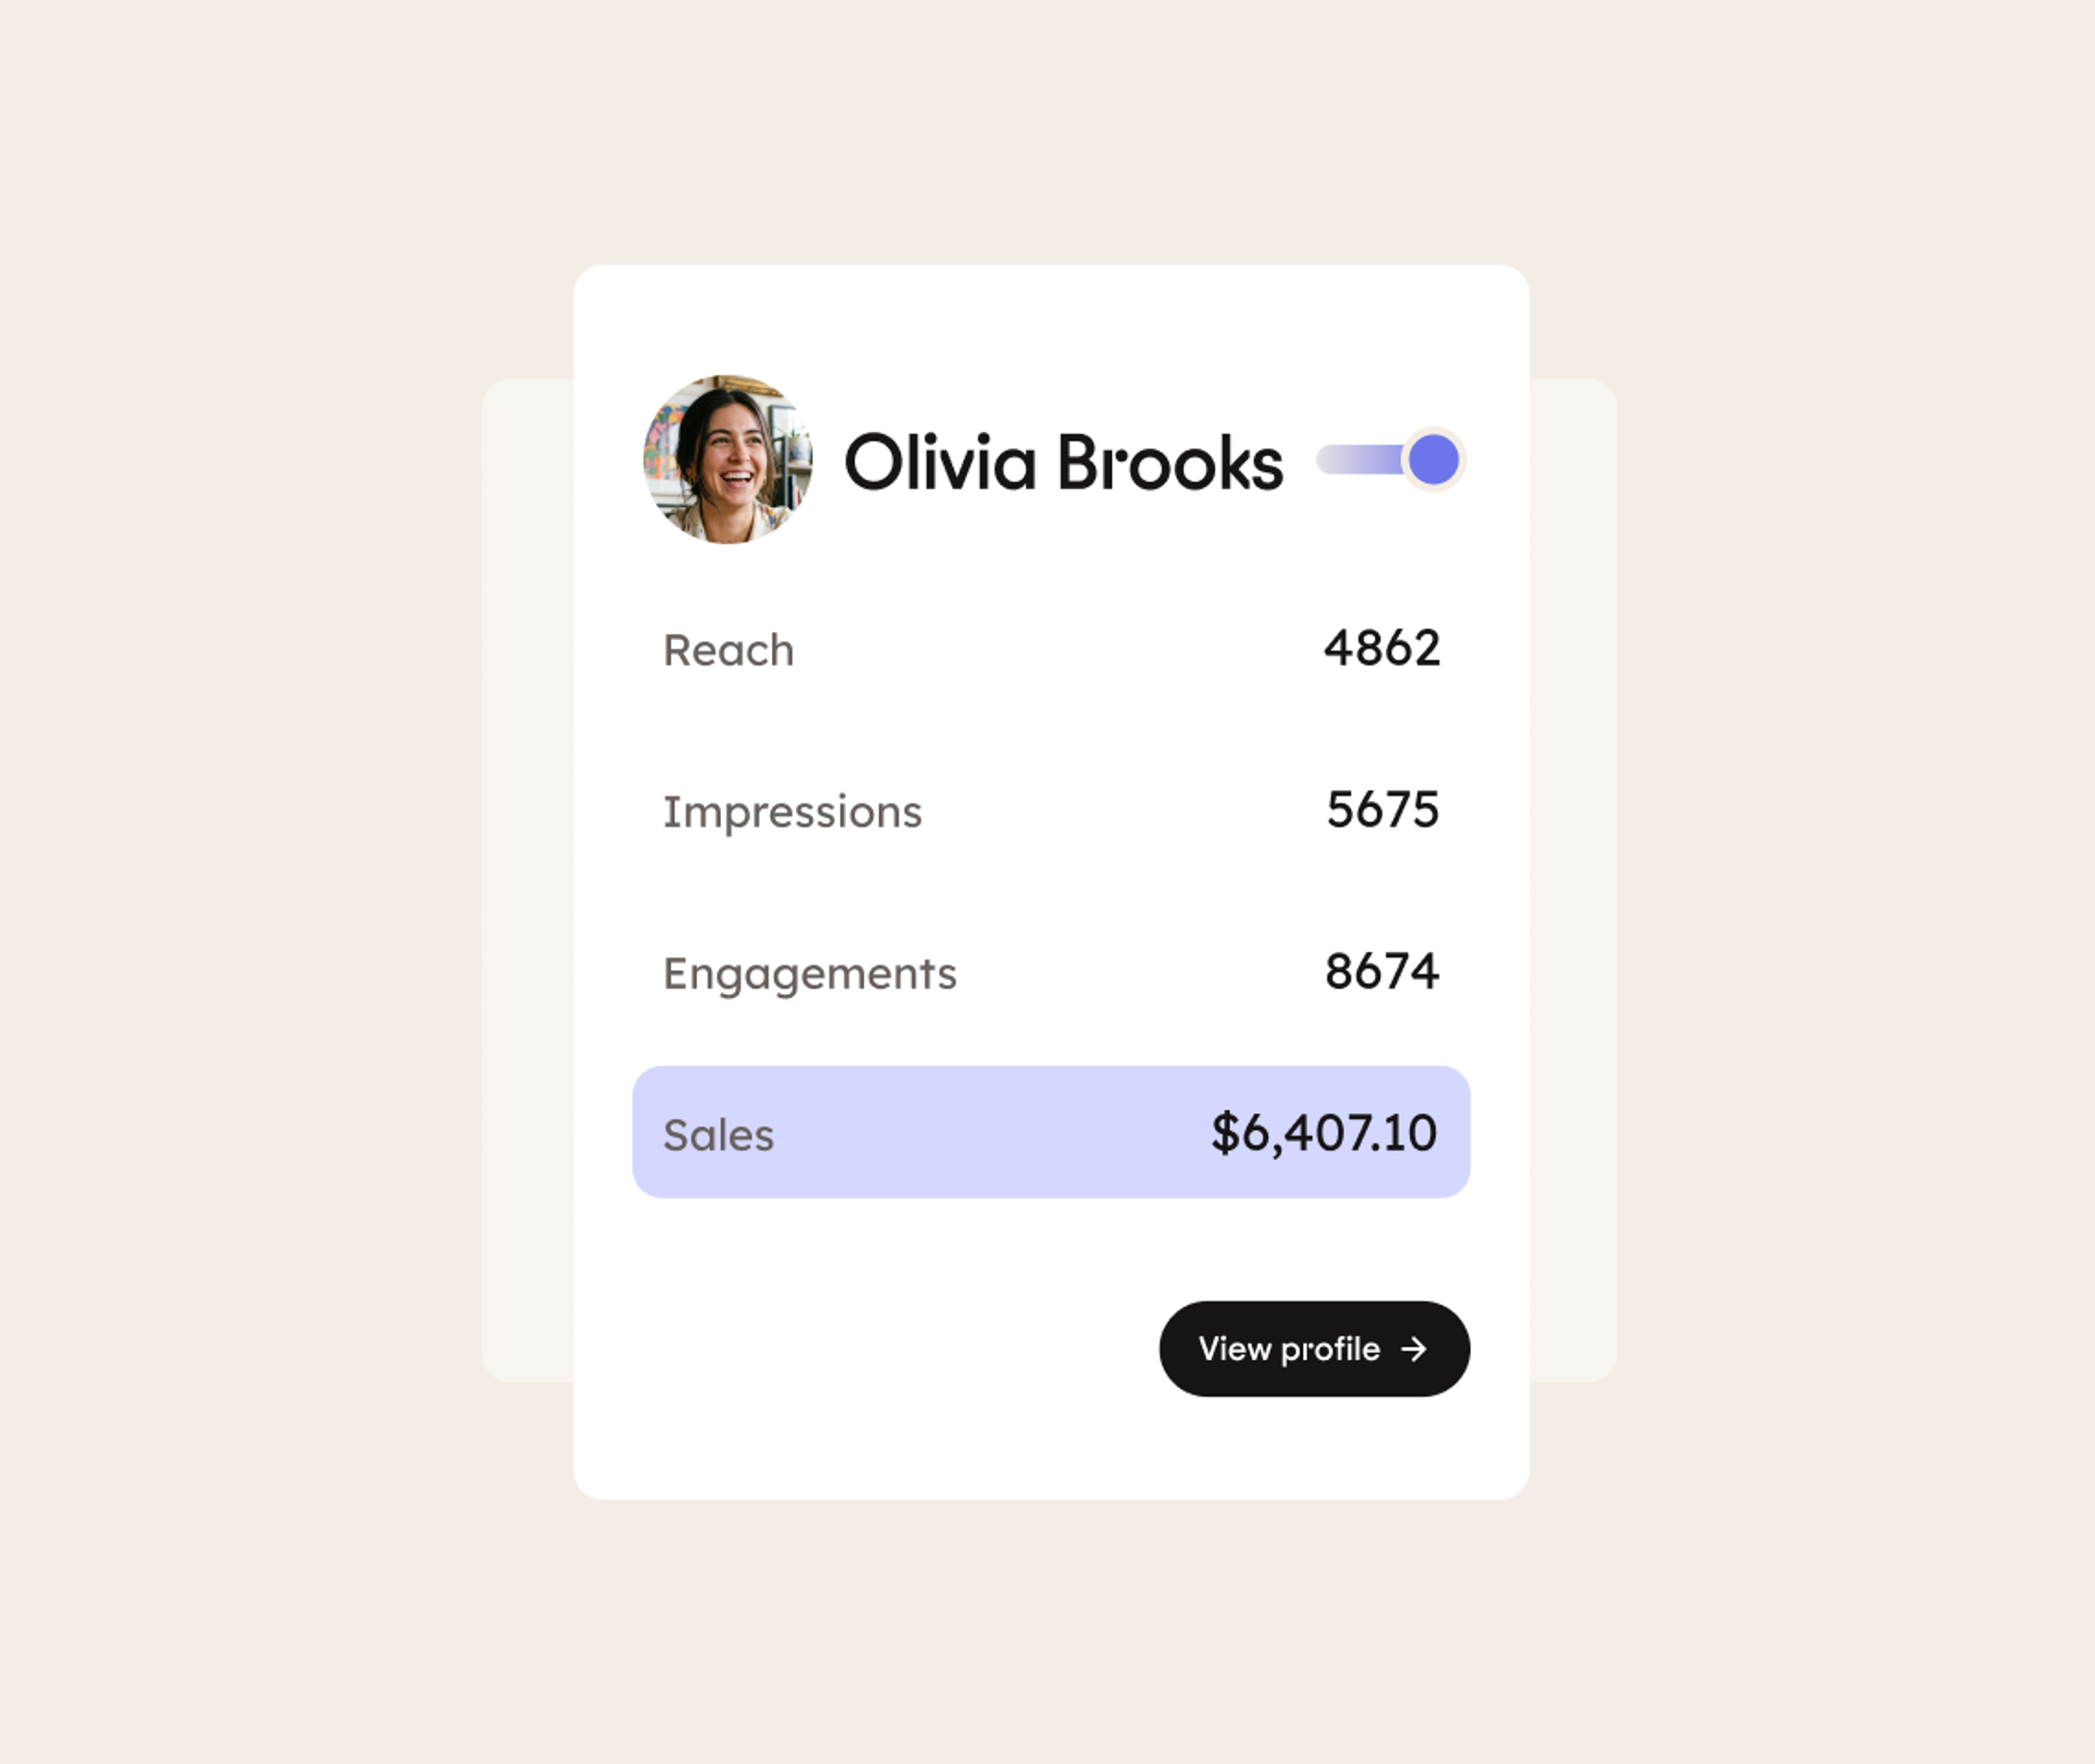
Customer value report
New vs. repeat buyer attribution at the partner level. Build payouts that reward genuine audience growth, not repeat traffic.
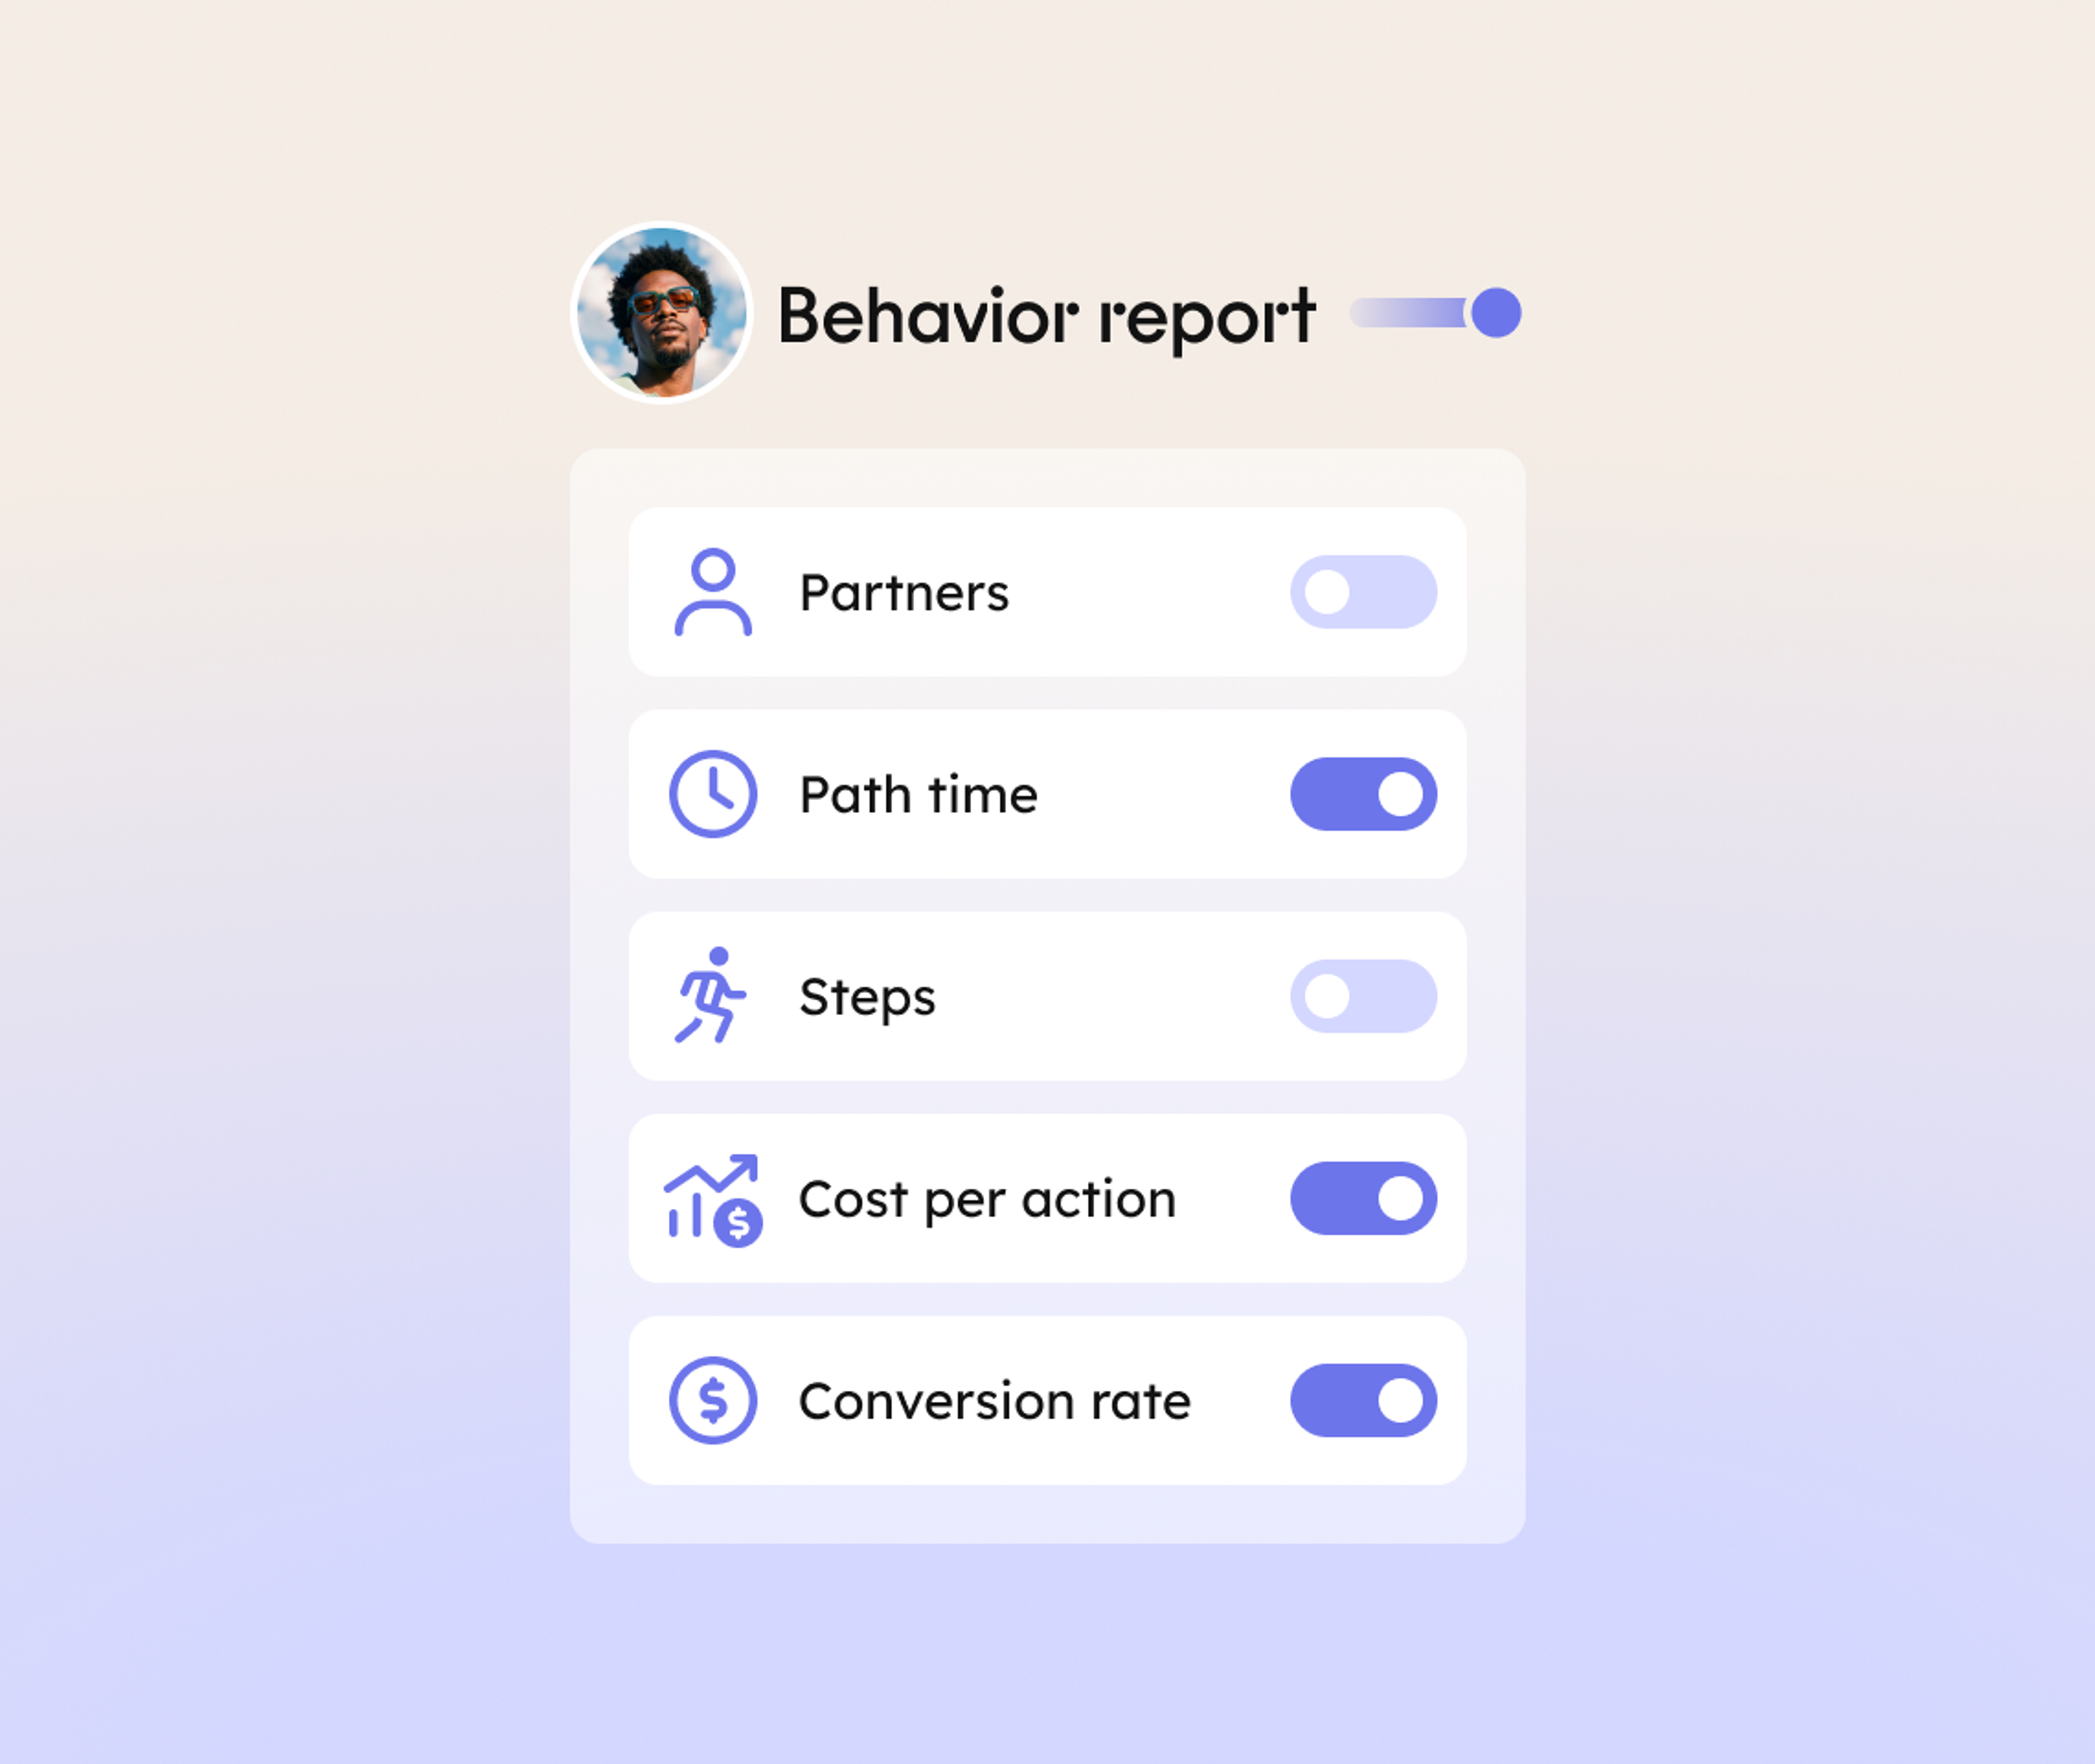
Behavior report
Average Path Time, Average Steps, Average Partners per conversion. See which partners drive the fastest and most efficient journeys.
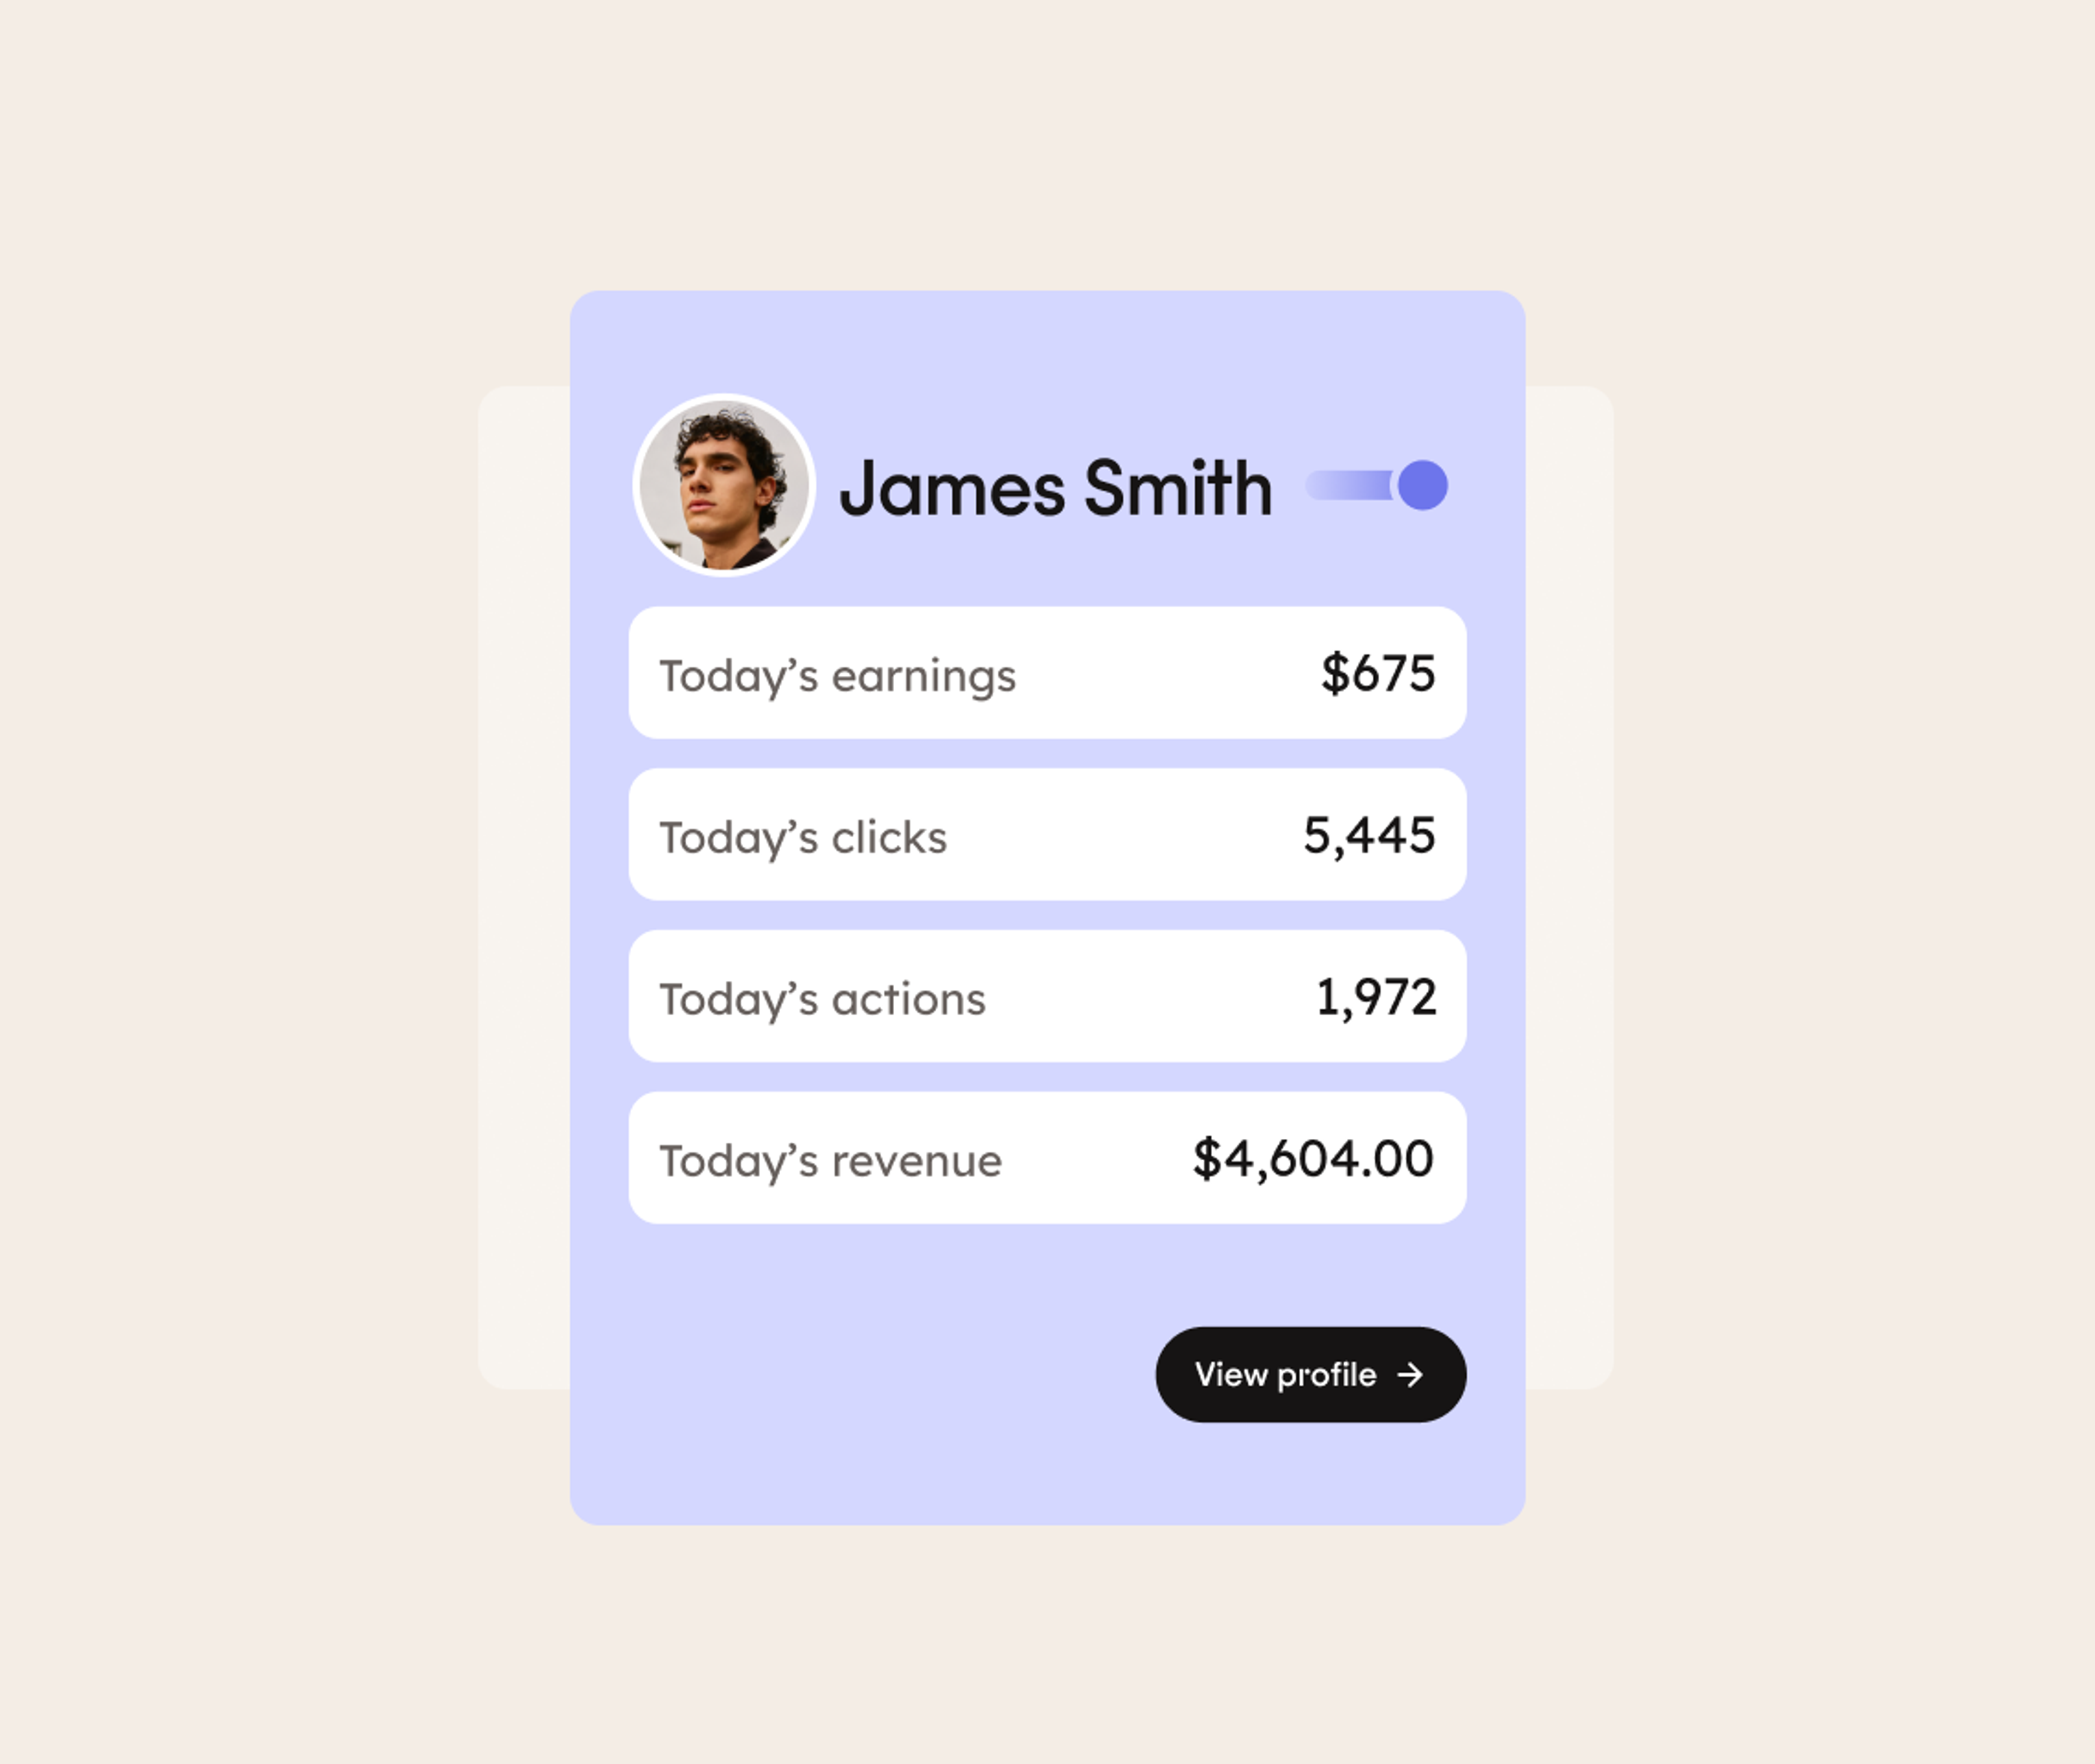
Value-based payouts
Connect what you know about customer quality to what you pay. Commission structures that reflect actual partner contribution.
“With impact.com, we could finally see which partners were bringing in genuinely new customers. That changed how we commission—and our numbers changed with it.”
CASE STUDY
25%
YoY revenue growth

PROGRAM INTELLIGENCE
Know where your partnership program stands—and where it’s going
Benchmarking shows how your program performs against anonymized peer data across your industry and region—conversion rate, ROAS, cost per action, partner mix, and more. See the gap between where you are and where the top of your segment stands, and walk into leadership reviews with context, not just numbers.
Forecasting projects performance out 90 days. Anomaly Detection surfaces deviations automatically—a spike worth replicating, a drop worth investigating—before you'd have found them manually.
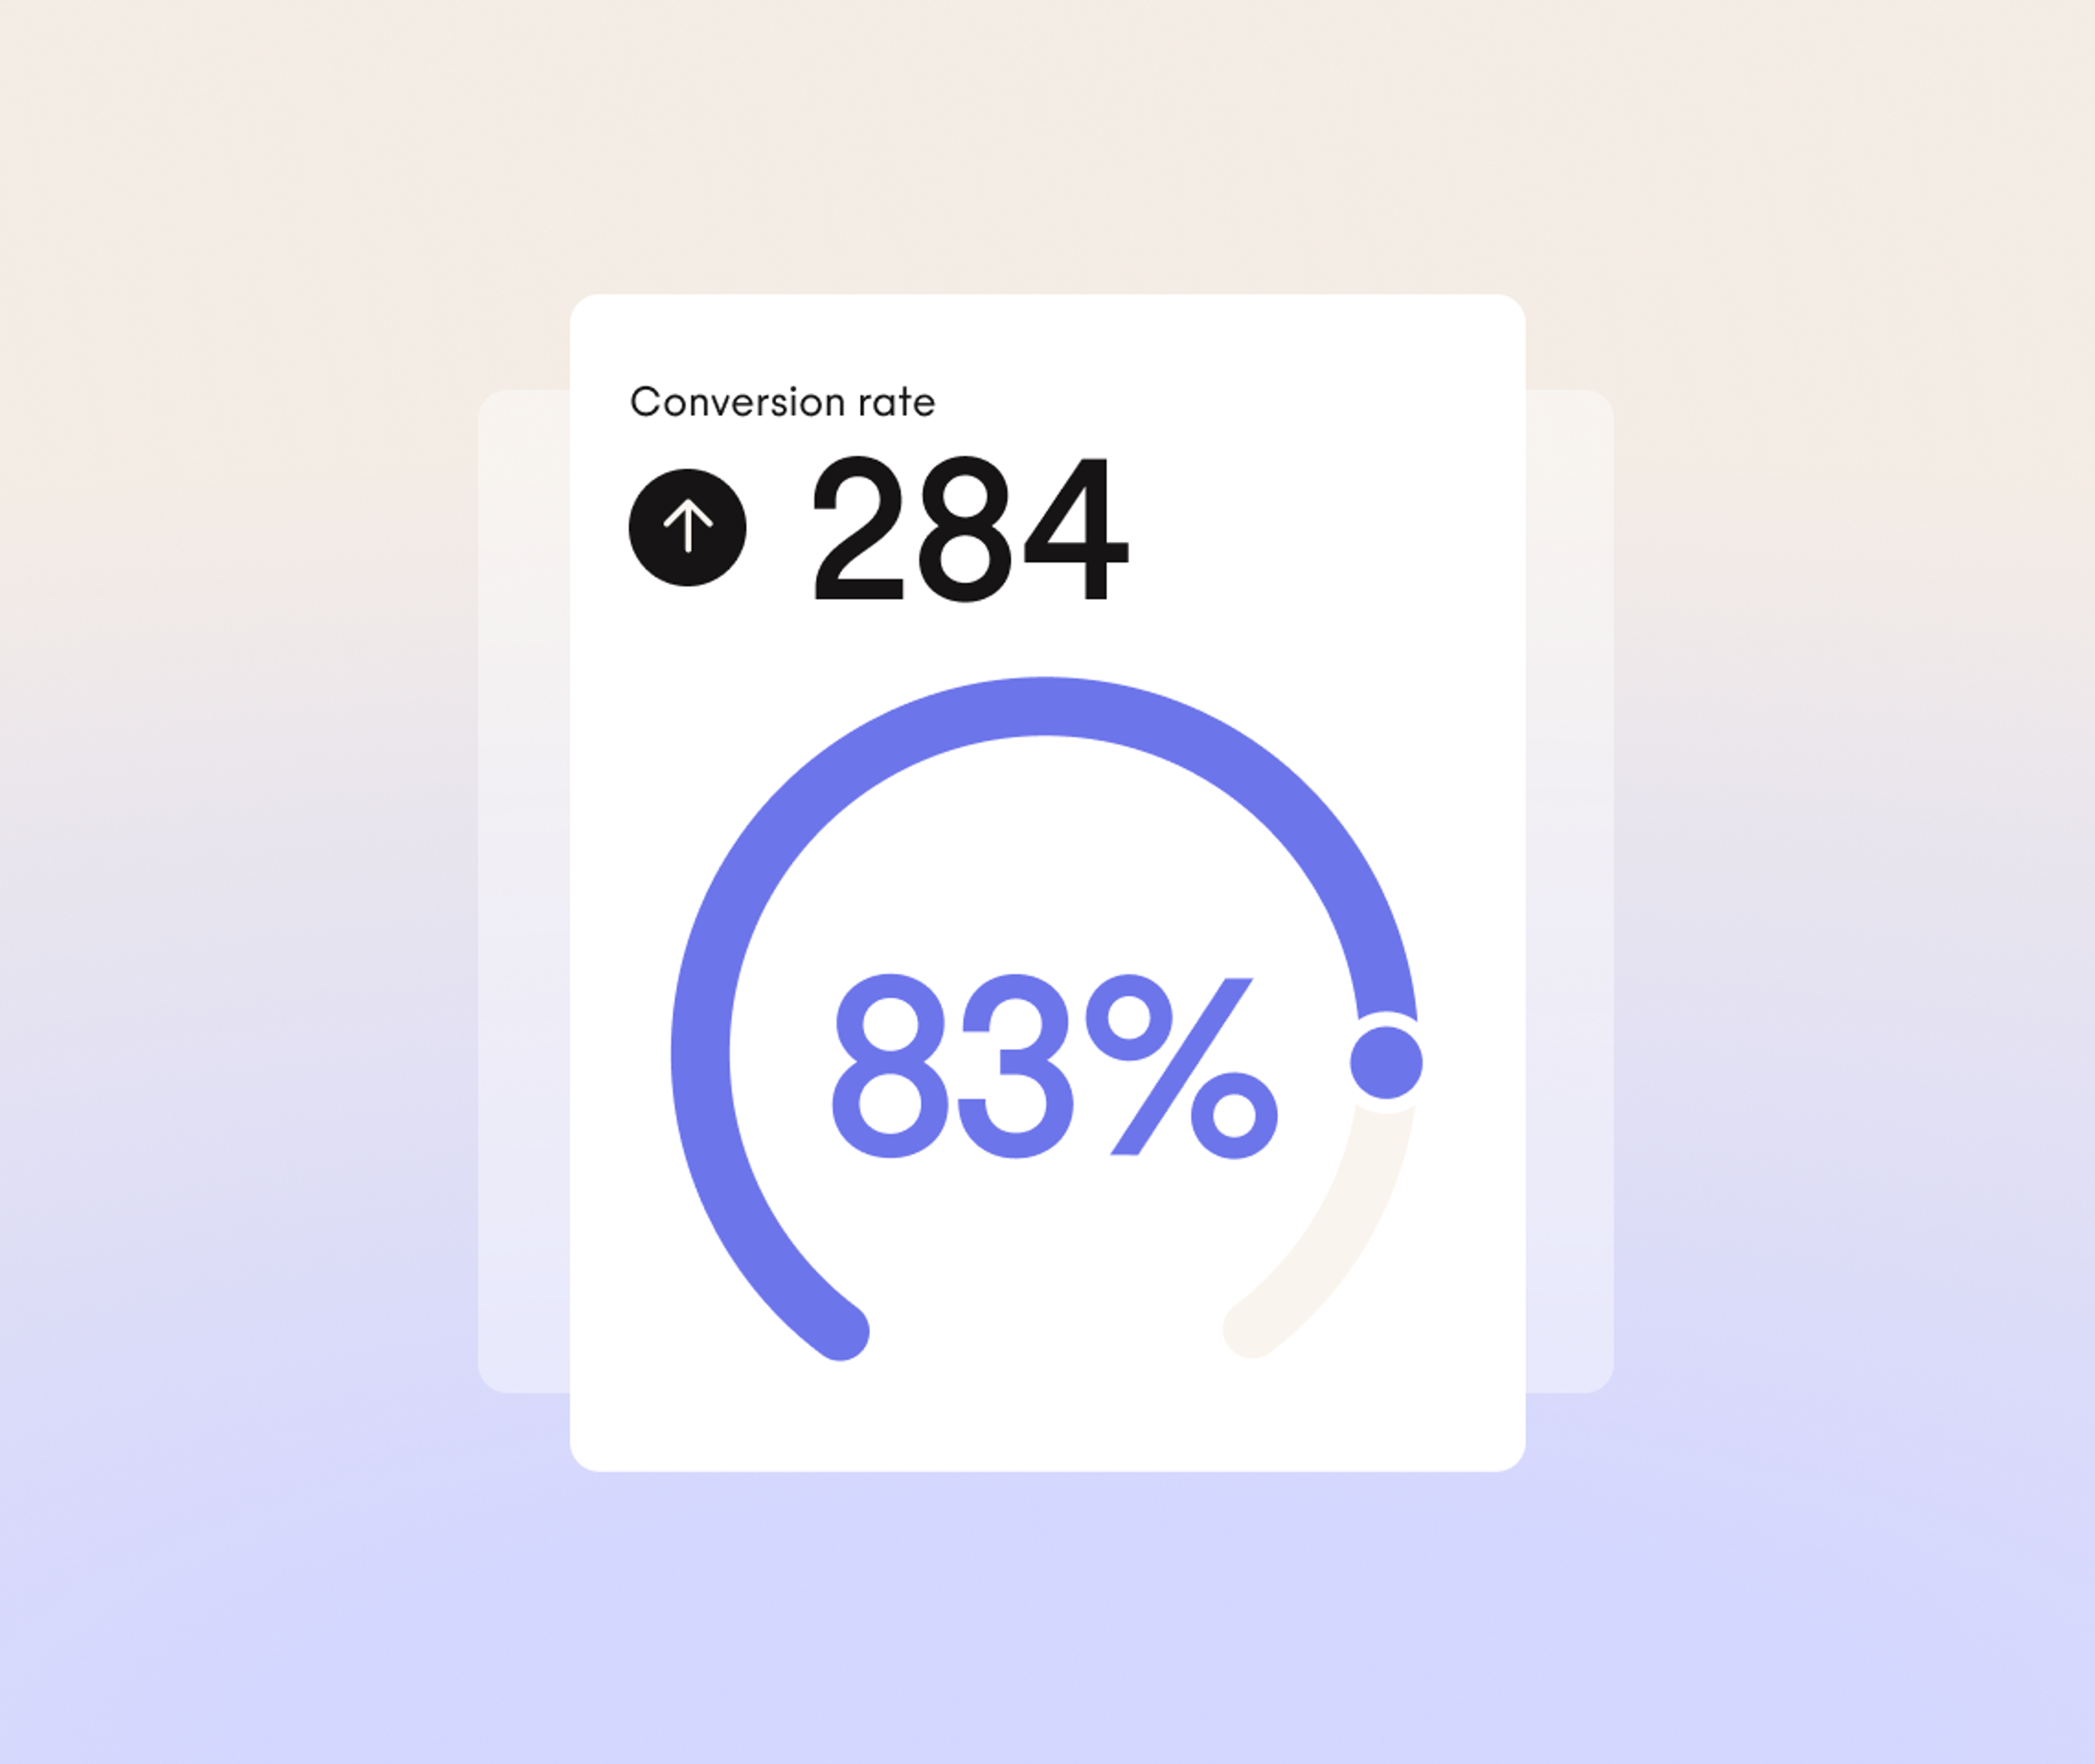
Benchmarking
Quarterly comparative data against your competitive segment. Conversion rate, ROAS, CPA, partner mix. Available for retail, travel, and education.

Forecasting
90-day performance projections built from your program data. Stop building models from scratch.
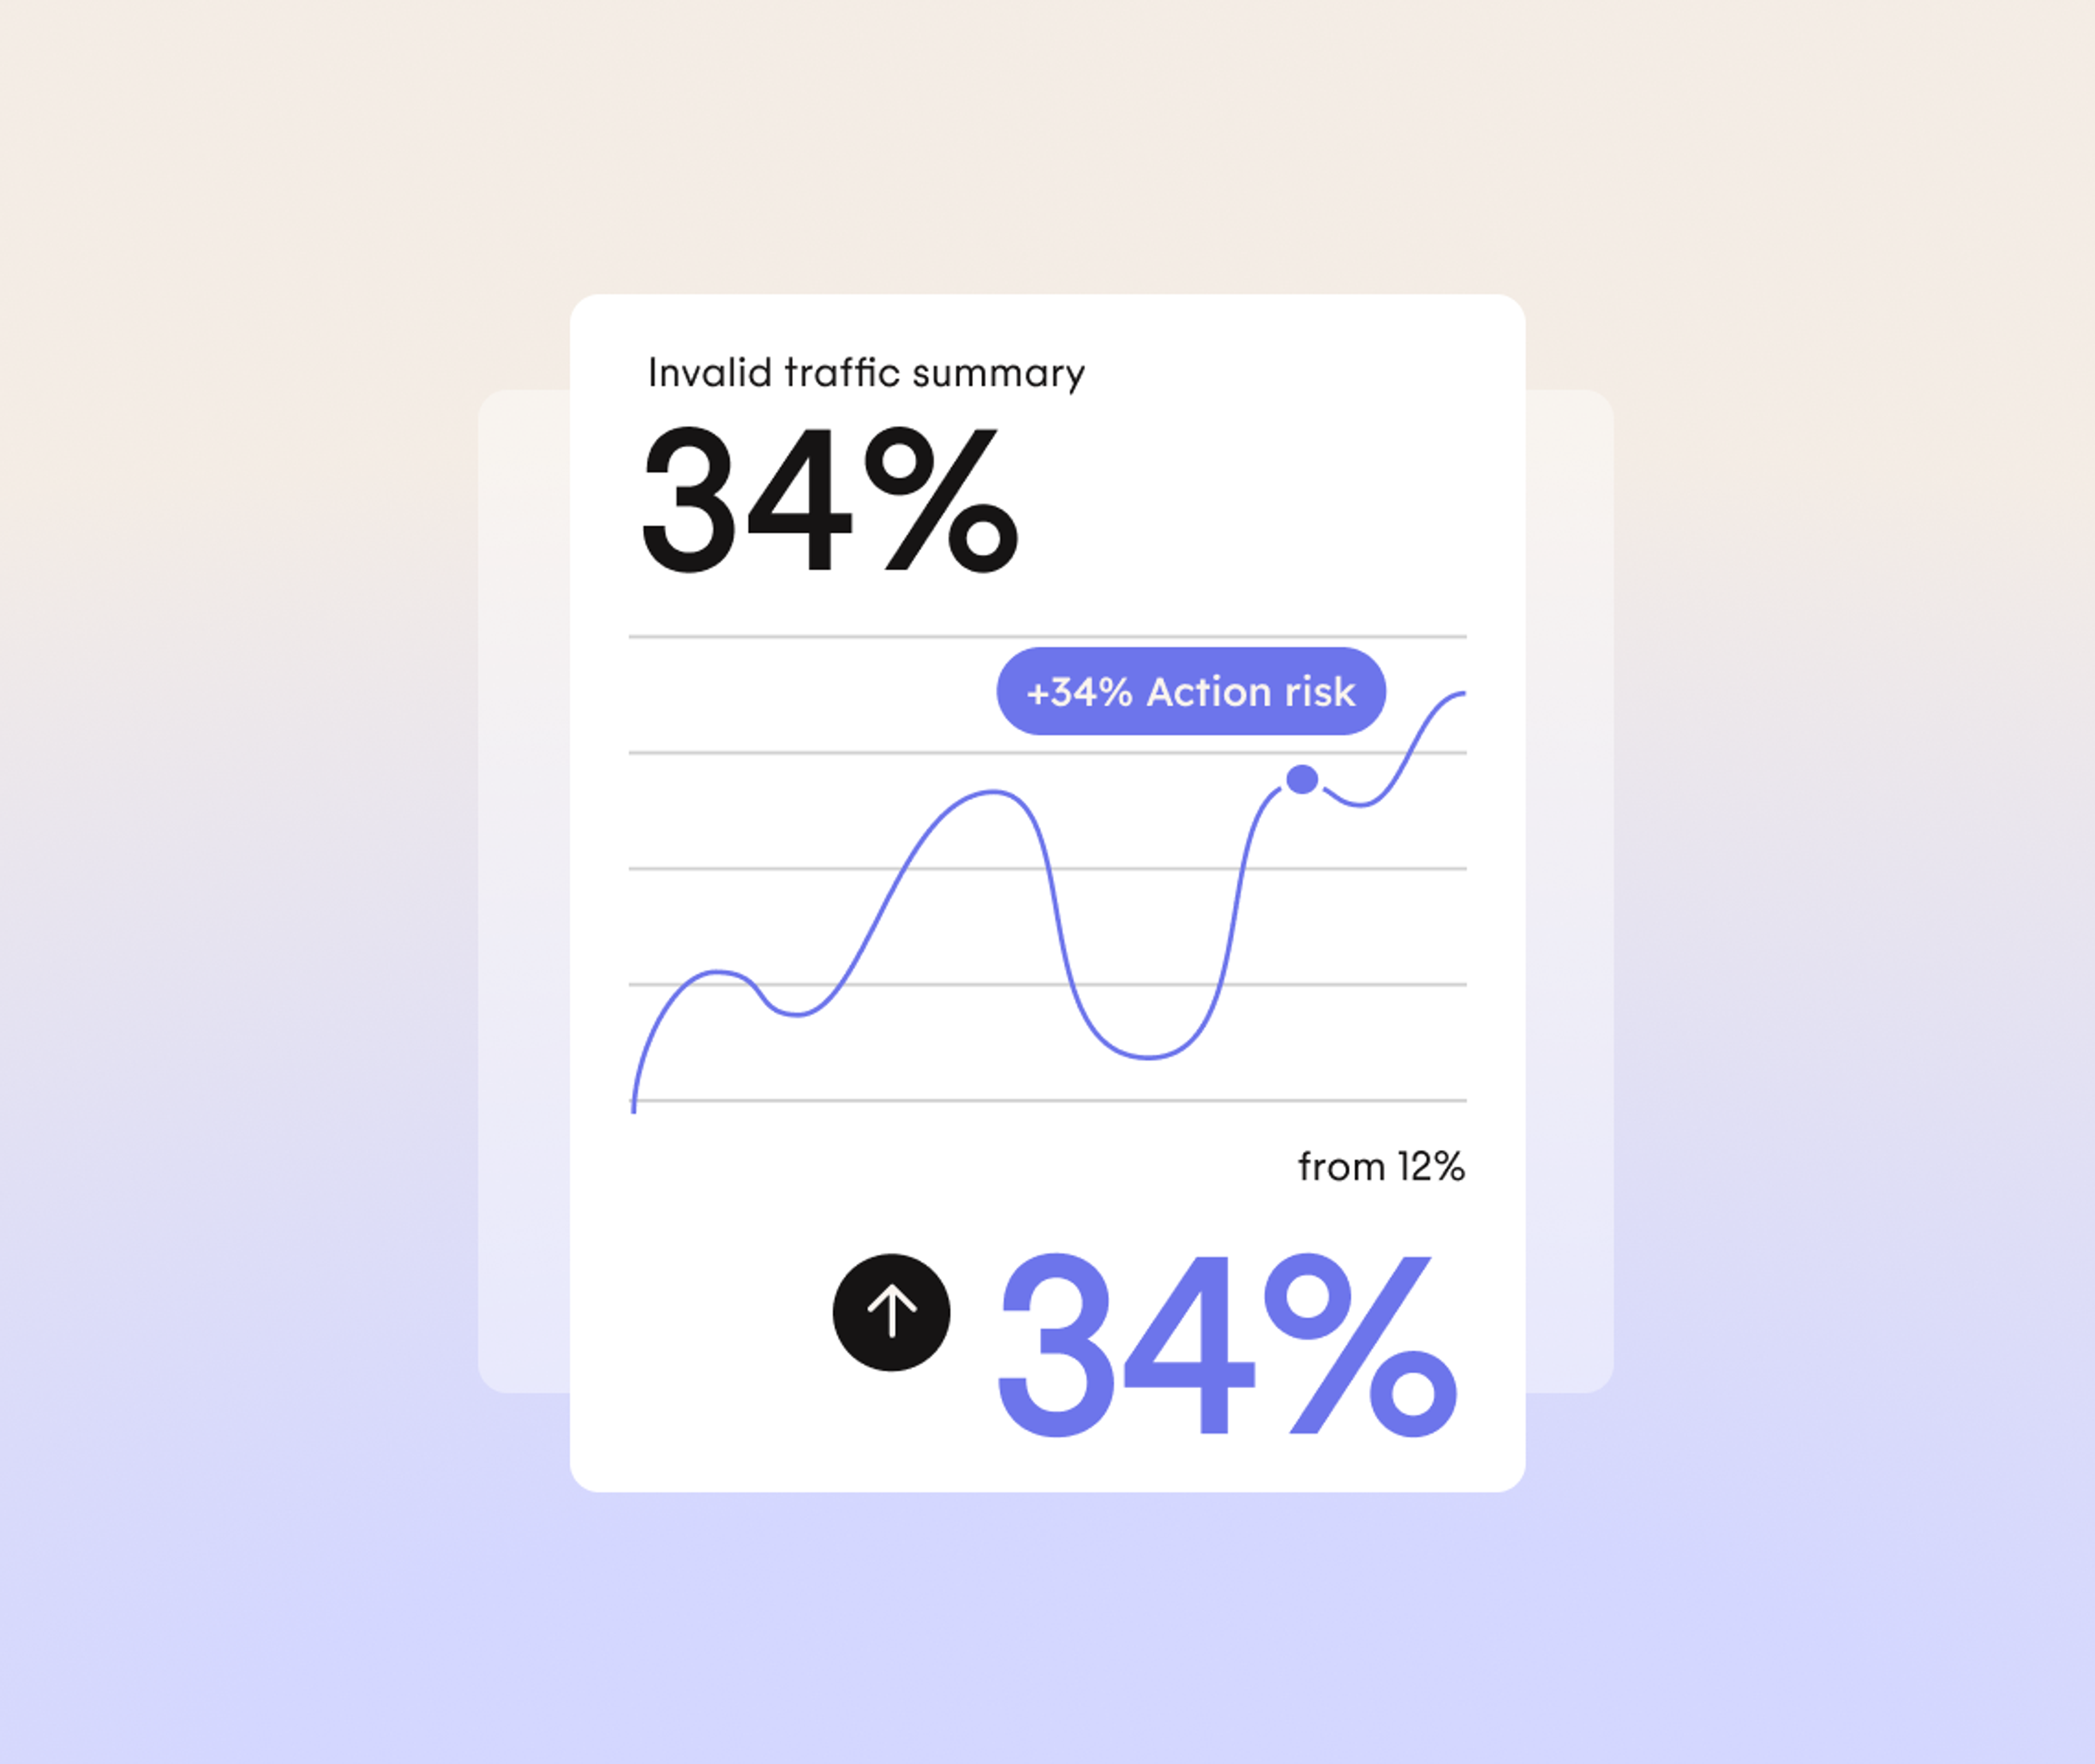
Anomaly detection
Automatic flagging of deviations from expected performance. Replicate success or catch issues before they compound.

Scaled a performance creator program from zero. Moved from one-off influencer campaigns to a hybrid commission model that now drives 12% of total sales
SMB / CPG
982%
ROAS
What brands achieve when they can see the full picture
15x
average return on ad spend year over year

Yamazaki Home arrived at impact.com with 597 affiliate applications sitting untouched in a queue and a program that had flatlined. Six months later: 15x ROI, a 576% revenue increase, and an active partner base that had been stalled for months. The migration wasn’t the story. What the platform made possible afterward was.

With impact.com’s advanced technology and Acceleration Partners’ partnership expertise, Vyond successfully implemented unique B2B performance-based partnerships, automated partner commission payouts, and gained real-time insights into its affiliate program.
23%
growth
Optimize works harder when the rest of the platform is behind it
The insights from Optimize connect directly to how you run the rest of your program. Know which partners drive incremental value and bring in high-lifetime-value customers. Then let Contract & Pay build commission structures that reward it.
See which partner types your program is underrepresenting. Then go straight to Discover & Recruit and the Marketplace to fill the gap.

Contract & Pay
Flexible commissions, electronic contracts, and automated payouts. Pay for the results that matter.

Discover & Recruit
Benchmarking shows the partner types your program is underrepresenting. Recruit directly from the Marketplace.
Protect & Monitor
Performance anomalies and fraud signals sit on the same platform. One view of what’s real.

Your best partnerships are already in your program
Optimize helps you find them, reward them, and build more like them.
Frequently asked questions
Affiliate program optimization is the process of using performance data to improve how a partnerships program allocates budget, structures commissions, and evaluates partner contribution. Rather than managing a program on volume metrics alone—clicks, conversions, total revenue—optimization means understanding which partners are driving incremental value, which are attracting your highest-quality customers, and how your program compares to others in your category. Features like Optimize on impact.com offer a suite of reporting and analytics tools built for this. Contribution Reports, Incrementality dashboards, Benchmarking, Forecasting, and Anomaly Detection, all designed to give program managers the data they need to make better decisions at every level of their program.
Multi-touch attribution in affiliate marketing is a method of assigning credit across all the partners involved in a customer’s journey to purchase, rather than giving all the credit to the last partner before checkout. In a standard last-click model, the partner who appeared closest to the conversion gets paid even if another partner introduced the customer, built consideration, or drove the original click. Multi-touch attribution models distribute that credit more accurately, reflecting each partner’s actual role: Introducer, Influencer, or Closer. Tools like impact.com’s Contribution Report and Incrementality dashboard use multi-touch and U-shaped attribution models to surface each partner’s real contribution, so commission decisions are based on evidence rather than proximity to the sale.
Incrementality in affiliate marketing measures how much revenue a specific partner is genuinely responsible for. The sales that would not have happened without that partner’s involvement. It answers a question that standard attribution can’t: if you removed this partner from your program tomorrow, how much would you actually lose? Incrementality analysis typically uses control and exposed groups, or attribution modeling, to isolate a partner’s true causal impact from the revenue they happen to be associated with. On impact.com, the Incrementality dashboard uses a U-shaped attribution model to distribute credit across all touchpoints and produces an Incrementality % for each partner—a single metric that shows their real contribution to program revenue, and one that holds up in a budget conversation.
Affiliate program benchmarking is the practice of comparing a program’s performance metrics—conversion rate, ROAS, cost per action, partner mix distribution—against anonymized aggregate data from other programs in the same industry and region. Benchmarking answers a question internal reporting can’t: not just how your program is performing, but how it’s performing relative to others at a similar stage and in a similar category. That context is what separates a number from an insight. Reports like impact.com’s Benchmarking reports draw on aggregated data across the platform to give program managers a quarterly view of where they sit in their competitive segment, and where the gap is between their current performance and the top of their category.
Affiliate analytics is a category of reporting built specifically around the structure of a partnerships program—tracking performance at the partner level, across multi-touch conversion paths, and against the commission and contract rules that govern each relationship. Standard web analytics tools like GA4 measure traffic, sessions, and on-site behavior, but they’re not designed to attribute revenue across a network of external partners, model incrementality, or benchmark a program against industry peers. Affiliate analytics surfaces the questions that matter to a program manager: which partners are driving new customers versus repeat buyers, which touchpoints in the journey are being over- or under-credited, and where the program has room to grow. Products like impact.com’s Optimize suite are built for this layer of analysis, giving partnerships teams the reporting depth that general web analytics tools aren’t designed to provide.