

The impact.com team has been hard at work rolling out new features to enhance the impact.com for Publishers suite.
This quarter, we focused on streamlining our user interfaces so you can achieve deeper data insights faster. As the marketplace grows increasingly competitive, you should have all the tools you need to do more with less.
Look at our top new features for Trackonomics and Pressboard this quarter.

Want to earn more from your content?
What’s new in Trackonomics
For Trackonomics, the team focused on providing more granular commerce content data this quarter. Here are the feature highlights that will help your commerce content program to the next level.
Extract more valuable insights with our new look
Now you have a revamped dashboard experience to give you faster loading times, a snappier feel, and increased flexibility.
Explore some new ways you can consume data:
- Add stacked bar charts for easy comparisons and draw trend lines to visualize performance trajectory.
- Understand the historical context of your data with the new date range comparison functionality.
- We replaced lengthy text-based filters with simple icons in each widget.
- If you have many data sources, use the limit results feature to zero in on relevant data and read your charts easily.
Users can now enjoy a streamlined setup process with Metric Validation, which hides any metrics that won’t work in conjunction with the existing selection. This change makes it easier to build new graphs and widgets.
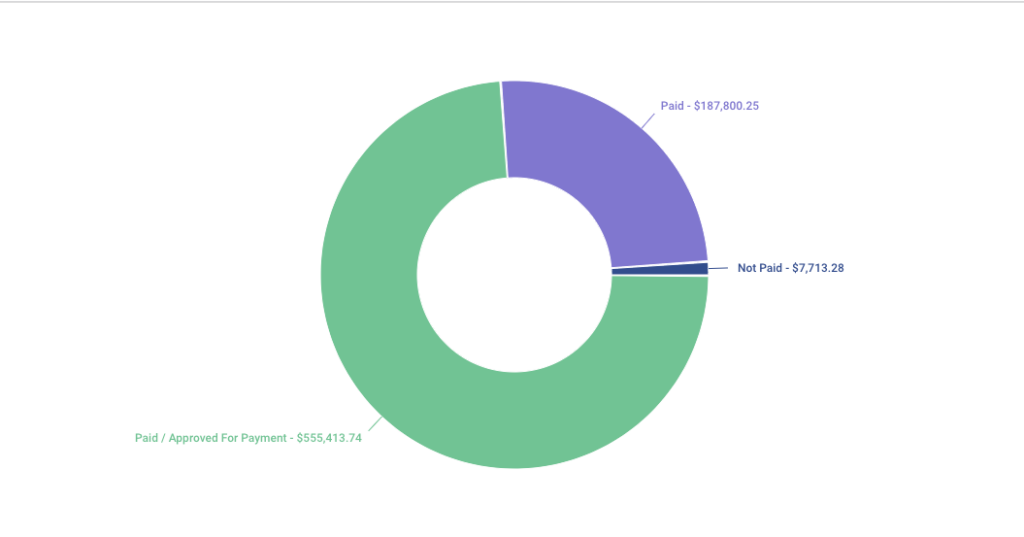
See when you’re paid at the page level
Managing commerce content payouts from various networks makes managing budgets and reporting to stakeholders difficult. That’s why we’ve made seeing when you get paid easier.
Check if partnering brands paid out from your dashboards with the new Payment Status field.
We currently support these major affiliate networks:
- impact.com
- CJ
- AWIN
- WebGains
- FlexOffers
- Partnerize
- PepperJam
- Skimlinks
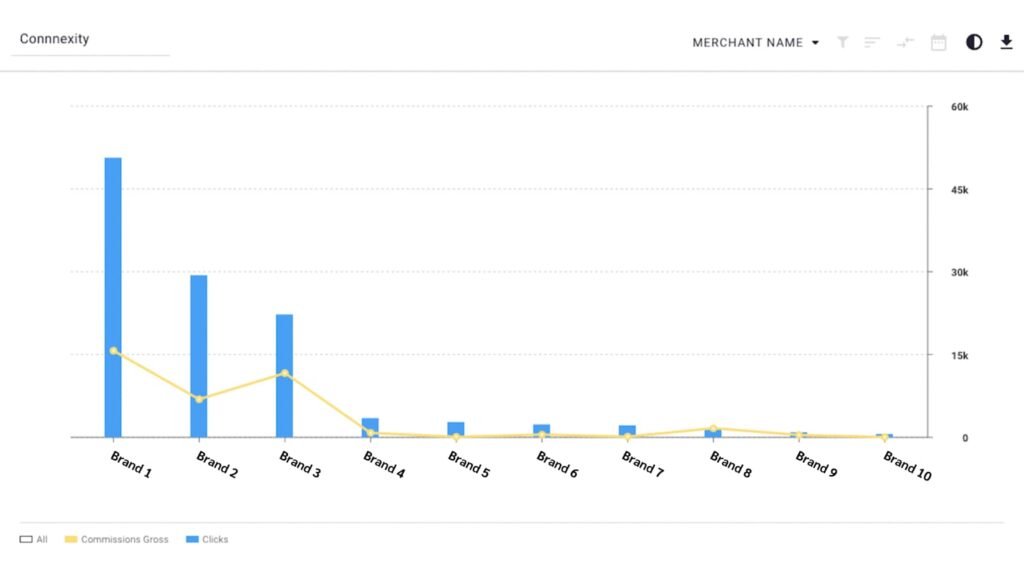
Analyze your top-performing brand partners
When you know which brands drive the most revenue, you know where to invest your time and how to negotiate better commissions.
That’s why you can now analyze earnings by merchant alongside top-level data for Connexity. Identify:
- Which merchants drive the most revenue
- Partnerships and strategies that could improve
- What partnerships and strategies to double down on
Eliminate irrelevant clicks from your data
Enhanced fraud prevention is a crucial benefit of having deeper visibility into your data. High-level dashboards allow you to identify unusual spikes in traffic or sales and quickly take action. Now, you can catch fake traffic in less time.
Bot detection identifies clicks humans didn’t generate, then highlights and splits out fraudulent clicks from the rest of your data. Instill more confidence in your click reports for internal teams and brand partners.

What’s new in Pressboard
For Pressboard, the team focused on creating more streamlined workflows for users this quarter. See the feature highlights that will make running your branded content campaigns even more effortless.
Filter your data intuitively with a streamlined UI
You can now enjoy cleaner visualizations of charts and graphs throughout your Pressboard dashboards. With the updated look and feel, you can filter data on the fly by clicking fields directly in the visualization.
To streamline your experience, you can also use Data Administrators to decide which report components you want to see. Cut through the noise by selecting the queries, charts, and tables that are most relevant to you.
Show clients how you’re progressing toward campaign goals
Many publishers use the Goal Tracking feature internally to monitor progress toward branded content campaign goals, such as page views, impressions, or article reads.
Now, you can share Goal Tracking with clients. Turn on the Goal Tracking module in your client-facing Custom Reports to reveal your progress toward each milestone. You can drill down even more by showing how each piece of content contributes to that goal.
Save even more time by adding filters to report templates
Templates already help you create new reports faster—but what if you could save even more time? Now you can by adding filters to your custom report templates.
A few scenarios where a filter is helpful in a template include:
- An advertiser only wants to see metrics for videos views above 25 seconds
- You only want to show traffic metrics for specific countries or regions
- You want to highlight articles reads above a certain quality

There are other pricing models for branded content
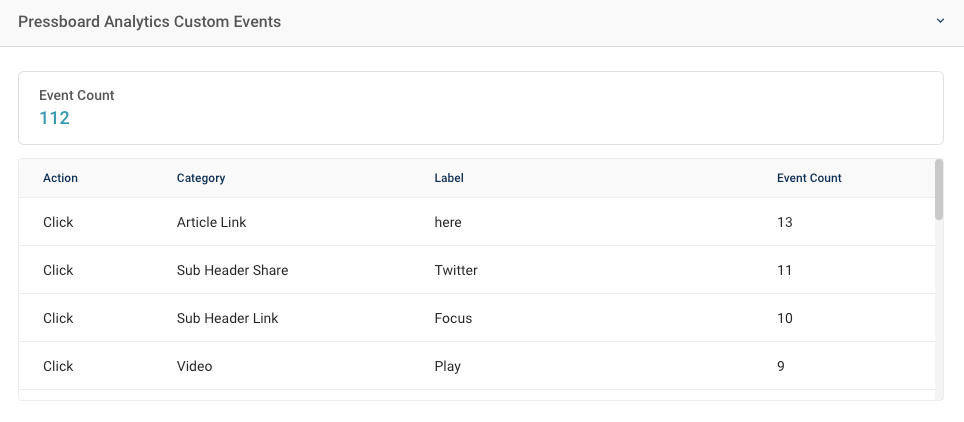
Measure the impact of your interactive content
The more branded content campaign metrics you can track, the more value you can provide advertisers.
As audience expectations evolve, interactive elements become integral to creating a premium content experience. That’s why you can now track certain interactive elements, pop-ups, and modals with Pressboard Analytics—no more using third-party tools!
Premium publishers can earn more while doing less
These new features are only some ways Trackonomics and Pressboard evolved this quarter. We continually improve each platform to ensure that premium publishers get the most streamlined, automated ways to diversify their revenue.
Want to see more of Trackonomics or Pressboard? Reach out to the team at publishersales@impact or request a demo.