

Defining big data allows you to derive more value from partnership marketing, and the seven Vs sum it up pretty well:
How big data makes a major difference in partnership marketing
Whether you employ traditional marketing tactics like paid ads or leverage cutting-edge partnership strategies, data plays a crucial role in growth.
There’s no shortage of applications for big data in partnership marketing. Big data is the fuel that delivers real-time analytics. Visualizing these analytics helps partnership managers understand the performance of every partner and their program at large. Using data in a thoughtful, effective manner will pave the way for confident decisions about how to grow your program and where to invest.
Those same analytics are the actionable insights that drive program decisions. The more information you have on your performance, the better you can optimize the partnership program to deliver the highest return on ad spend.
Big data provides detailed insights about the customer’s website experience, helping you identify the partners contributing to conversions, even if they aren’t the last click. It enables a better understanding of which customers have the highest lifetime value so that you can adapt your program to reach similar buyers.
Investing in partnerships that deliver maximum return and possibly even diverting spending away from search and display creates value for your business.
The 7 Vs explained
As more brands turn to partnership marketing as a revenue-generating channel, understanding the 7 Vs of big data results in a winning partnership program and, ultimately, business growth.
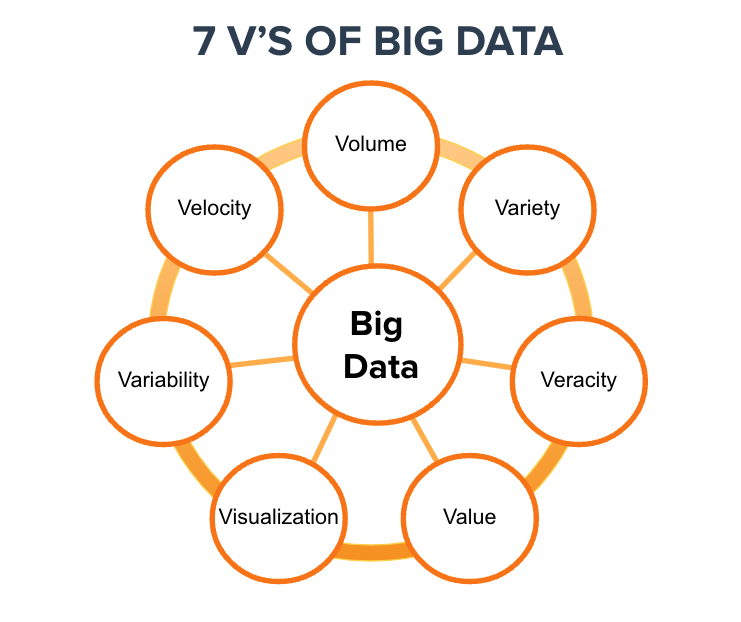
1. Volume
Volume defines how much data we have – what we used to measure in Gigabytes is now measured in Zettabytes (ZB) or even Yottabytes (YB). The Internet of Things (IoT) creates exponential growth in data. Projections show the volume of data changing significantly in the coming years.
2. Velocity
Velocity represents the speed at which data is processed and becomes accessible. Today, if delivery is not real-time, it’s usually not fast enough.
3. Variety
Variety describes one of the biggest challenges of big data. The insights may come without structure. The total asset may include many data types, from XML to video to SMS. Organizing the data in a meaningful way is no simple task when the data itself changes rapidly.
4. Variability
Variability is different from variety. A coffee shop may offer six different blends of coffee, but if you get the same blend every day and it tastes different every day, that is variability. The same is true of data. If the meaning constantly changes, it can significantly impact your data homogenization.
5. Veracity
Veracity ensures the data is accurate, which requires processes to keep the insufficient data from accumulating in your systems. The simplest example is when contacts enter your marketing automation system with false names and inaccurate contact information. How many times have you seen Mickey Mouse in your database? It’s the classic “garbage in, garbage out” challenge.
6. Visualization
Visualization is critical in today’s world. Using charts and graphs to visualize large amounts of complex data is much more effective in conveying meaning than spreadsheets and reports chock-full of numbers and formulas.
7. Value
Value is the end game. After addressing volume, velocity, variety, variability, veracity, and visualization — which takes a lot of time, effort, and resources —, you want to be sure your organization is getting value from the data.


The ultimate guide to partnership marketing
Discover how you can tap into the power of partnership marketing and harness its benefits, like increased revenue, brand awareness, and conversion rates. Get my free guideDeciphering data with the right partnership platform
Brands’ main challenge is digesting the big data available to make sense of the data and identify actionable insights. Visualization allows partnership managers to highlight patterns and outliers, saving time and making sharing insights with internal stakeholders easier.
Many brands explore partnership platforms to manage their program to unite their partners and automate the six stages of the partnership life cycle.
While automation is critical, brands also need a platform to function as that single source of truth that can provide all seven V’s of big data. Investing in a single, easy-to-understand partnership platform, like impact.com, helps eliminate siloes and unites all data to better understand your program’s performance.
The impact.com platform provides an extensive library of performance reports where brands can view data and create customizable reports. With tools like the impact.com Data Lab, brands create visualizations that tell compelling stories about the data, answer unique questions, and provide valuable insights. Request a demo to ignite growth through data with impact.com today.
Expand your knowledge of partnership marketing with these informative impact.com resources