

Summer is over, fall is here, and big questions loom for companies looking to drive growth and revenue at the end of the year.
Our series of partnership benchmarks returns this month, looking at data from October 2021 to gauge how consumers are responding to living life with the COVID-19 virus and how they’ll gear up for a second straight holiday season affected by the pandemic.
How are partnerships faring now?
Looking across nearly two years’ worth of data, it’s clear that consumer spending habits have changed since the early days of the pandemic. Clicks, conversions, and conversion rates in October were far from the highest points we’ve seen over the course of this study, yet average order value (AOV) remains as strong as previously seen. After peaking in September, the metric declined by a modest 5 percent this past month to remain 60 percent above baseline. Clearly, consumers are comfortable spending more than they were in the early days of the pandemic or even just a year ago.
Conversions and clicks appear to be on the upswing but are still nowhere near what they were in the early days of the pandemic. Meanwhile, conversion rates peaked this May, then began a slow and steady skid to end up below baseline in October.
Revenues and commissions tell a different story. While their trend lines are full of herky-jerky movement, both metrics remain higher than what we saw in spring and summer of 2020.
Our data scientists have been tracking the performance of key metrics across the partnerships channel since January 6, 2020. We published those results for the first time in May 2020 and provided a monthly analysis of eight key verticals in the United States with data through October 2021. The analysis compares those verticals to previous months and to impact.com’s benchmarks, based on pre-pandemic data. The data allows our brands and their partners to stay informed, benchmark their campaigns, and calibrate their decisions as needed.
What the data shows as of October 2021:
Clicks and conversions rebound from summer swoons
Clicks rose to 25 percent above baseline in October, the highest mark for the metric since March. This was the fourth straight month of positive growth for the metric, which was in steady decline in the spring and early summer. At 20 percent above baseline, conversions were flat compared to September. It’s also worth noting that conversions were 5 percent greater than they were in October of 2020.
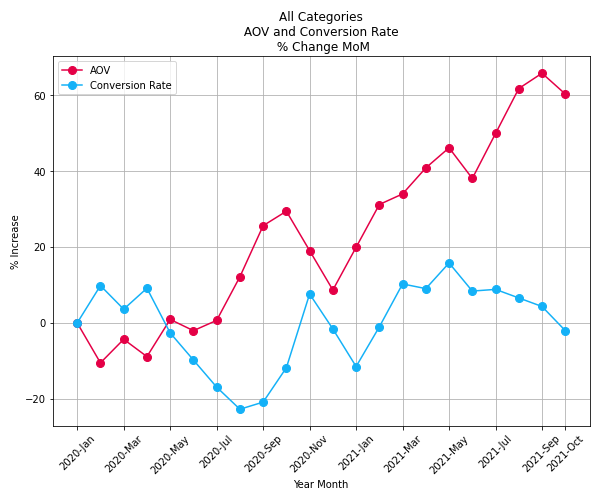
Average order value remains high
While AOV declined in October, it’s not necessarily a worrisome shift given the trajectory throughout the year. This was only the second month of decline for AOV in the calendar year, and the metric was still 60 percent greater than the pre-pandemic benchmark which remains nearly the highest it’s been since the study began.
The same cannot be said for conversion rates, which continued a slow decline that began back in June. With clicks trending up and conversions trending down, the metric sunk below baseline for the first time since February.
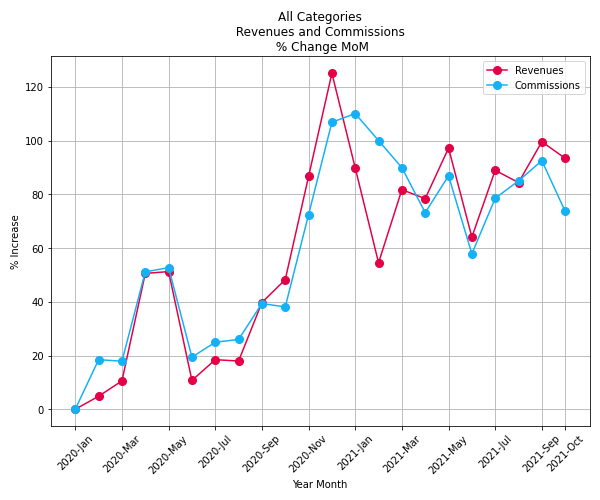
Revenues and commissions continue up-and-down trend
Monthly revenue and commission numbers continued to bounce up and down in 2021. Both metrics were down in October after rising in September. Still, with revenues 90 percent above baseline and commissions 75 percent above baseline as well, these numbers are much healthier than what we saw throughout 2020. Both metrics are well above where they were in October of last year, which can be seen as a positive sign for the viability of partnerships.
A recap of the methodology behind the results
This report features month-over-month (MoM) benchmarking on eight verticals to see how events around COVID-19 have impacted partnership metrics.
impact.com’s analysis began on January 6, 2020, and goes through the end of October 2021. This timeframe offers a full picture of U.S. consumer behavior from:
- Before the World Health Organization’s March 11, 2020 announcement of COVID-19 as a global pandemic
- March 2020, as states declared stay-at-home orders
- Summer 2020, when the United States surpassed 6 million COVID-19 cases, yet some states saw infection rates of less than 1 percent and began reopening indoor dining
- October 2020, when infection rates began to rapidly increase, resulting in new daily records for confirmed cases and marking the start of a much-feared “second wave”
- November 2020, when the country participated in a crucial election and Black Friday marked the beginning of the holiday shopping season
- December 2020, when cases and deaths continued to set new records but the first doses of newly approved vaccines were administered
- Spring 2021, when vaccines became readily available to all Americans over the age of 16
- May 2021, when infections hit their lowest level since June 2020, 57 percent of U.S. adults had received at least one shot of a vaccine, and the vaccine became available to children aged 12 to 15
- June 2021, when many consumers resumed their vacation plans and states lifted travel restrictions
- July 2021, when the highly contagious Delta variant contributed to surging cases
- August 2021, when hospitalizations reached their highest point in the prior eight months
- September 2021, when schools around the country welcomed students back to the classroom
- October 2021, when many industries grappled with supply chain disruptions and labor shortages
Throughout this period, data scientists at impact.com pulled data using the same cohort of brands across groups, remaining consistent across each week. They ran a statistical analysis to determine the number of brands to include in each category, identifying and filtering out outliers that drove entire categories.
Apparel, Shoes, and Accessories
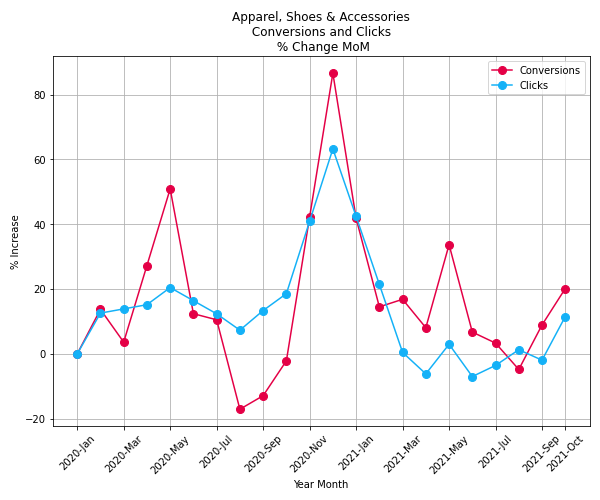
Clicks and conversions in the Apparel, Shoes, and Accessories category were up in October. Both metrics had hovered around baseline for several months before conversions popped in September. Clicks finally followed suit, rising to 10 percent above baseline in October and hitting their highest point since February. Meanwhile, conversions rose to 20 percent above baseline, their highest point since May.
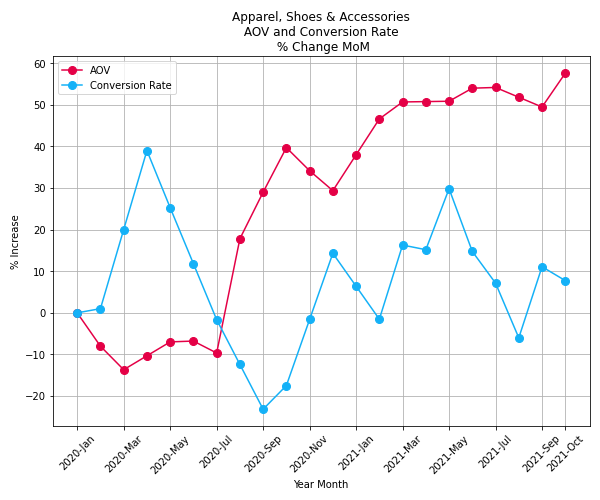
AOV grew in October, reaching nearly 60 percent above baseline after remaining relatively flat since March. The conversion rate continued its up-and-down trajectory. After falling below baseline in August, the metric rebounded in September, dropped slightly in October, and ended the month approximately 10 percent above its pre-pandemic benchmark.
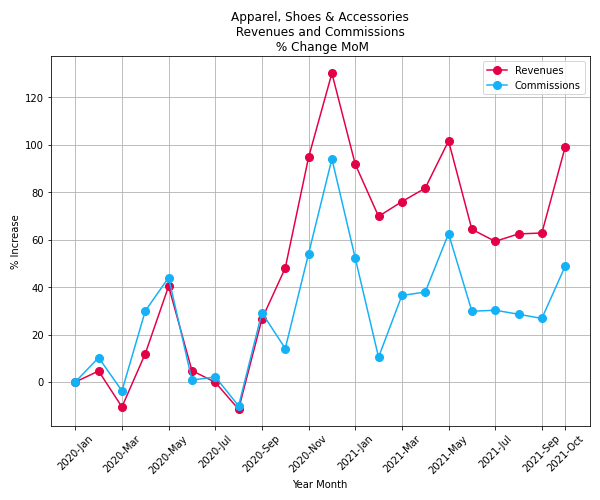
Yet again, revenues and commissions moved in near parallel trajectories in the category. An uptick in AOV helped both metrics increase in October; revenues grew at a greater rate, up nearly 40 percent from the previous month, while commissions increased 20 percent. This shift came after both metrics had remained flat for four consecutive months.
Arts and Entertainment
The Arts and Entertainment category includes a wide range of subcategories — from books, art, photography, and music to tickets and shows, dating services, online gaming, and digital TV and video-on-demand services — some of which were severely hurt by the pandemic while others experienced windfall gains.
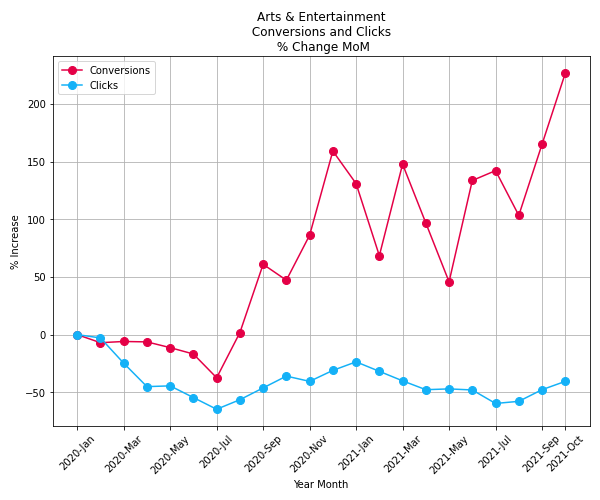
Conversions saw a second straight month of meteoric growth. Following a drop to 100 percent above baseline in August, they’ve now grown by more than 100 percent over the past two months — in the process hitting a new high point in October. Clicks tell a very different story as they’ve remained flat throughout 2021, with little fluctuation since the pandemic began. The metric inched its way up in October but still remains nearly 50 percent below baseline.
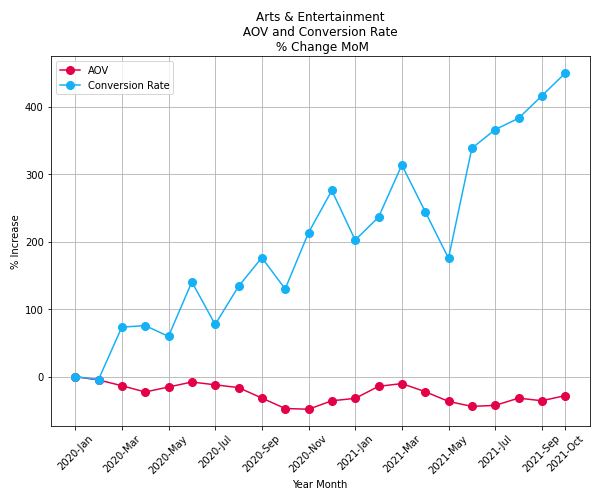
Conversion rates in the category continued to soar in October, hitting a new peak for the fifth consecutive month. Where conversion rates are trending upward, AOV remains level, with gentle rolls. The metric hovered around 50 percent below baseline in October, close to where it sat since May.
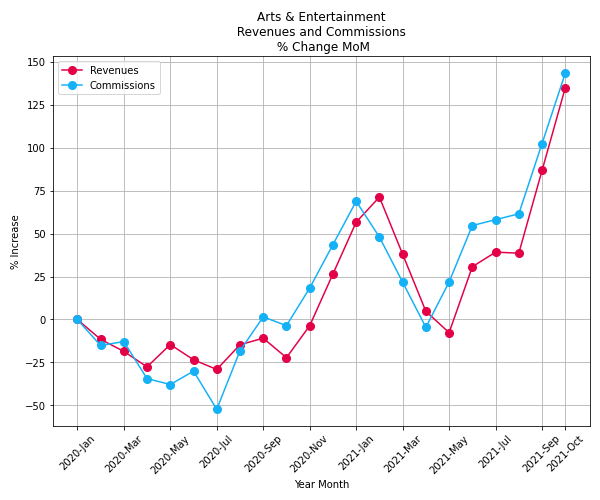
Revenues and commissions rode the conversion rate boost skyward, hitting new peaks in October. Both metrics grew nearly 50 percent over the month and have grown by approximately 100 percent since September.
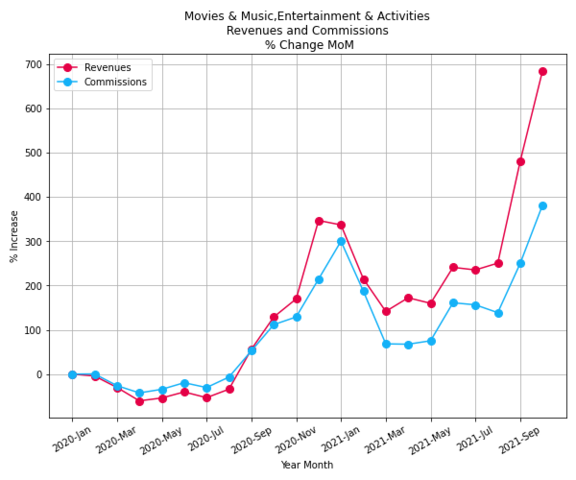
A deeper look at the vertical shows much growth driven by the Movies and Music, Entertainment and Activities subcategory, where the growth trend shows a positive correlation to the larger Arts and Entertainment category. Revenues in the subcategory grew by 200 percent in October to hit a new peak.
Computers and Electronics
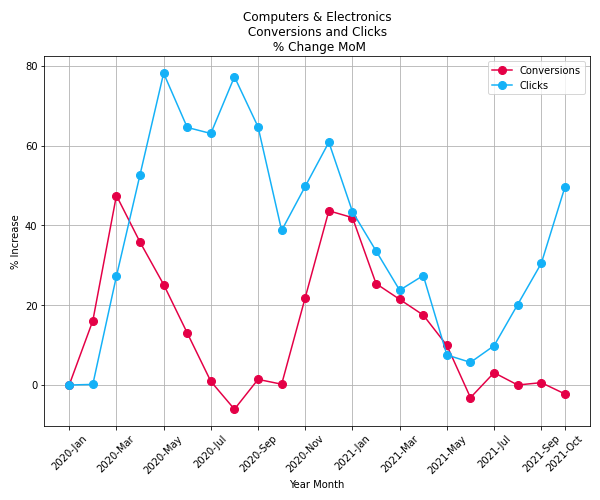
Clicks have been on the upswing in the Computers and Electronics category since the summer, showing positive growth for the fourth straight month. The metric was 50 percent above baseline in October, the highest it’s been all year. Conversions haven’t had quite the same experience as the metric remained nearly flat compared to September.
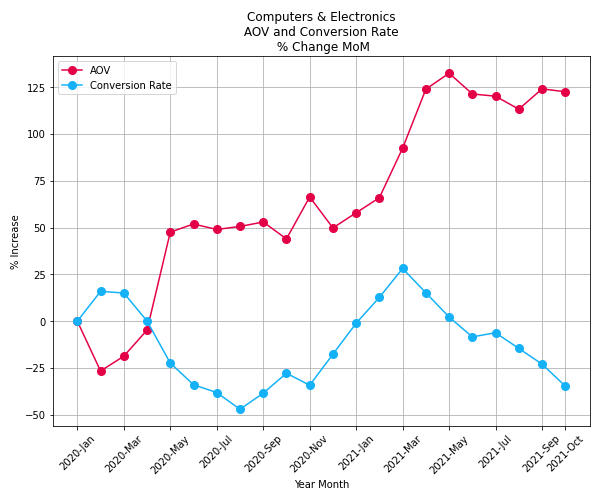
Rising clicks and minimal movement in conversions pushed conversion rates down for the fourth straight month. At 30 percent below baseline, this is the lowest we’ve seen conversion rate in the category since November of 2020. Average order value remained flat for the month, but that simply means it remained incredibly high. AOV has hovered around 125 percent above baseline for seven consecutive months.
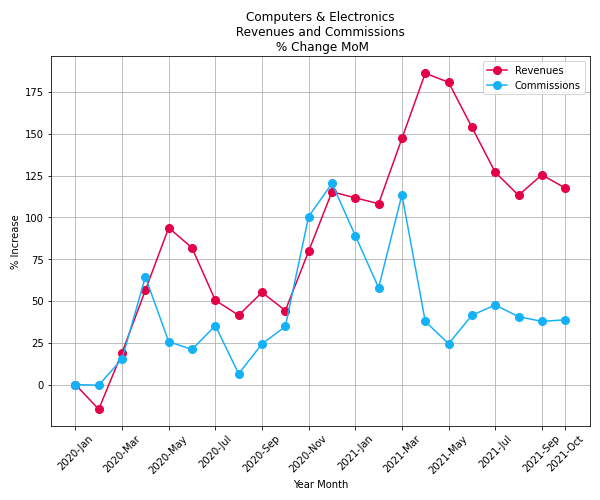
After a small rebound in September, revenues were back on the downswing in October as they continued to fall from a springtime peak. Still, the metric remained around 125 percent above baseline. Commissions remained flat for the fifth straight month, approximately 40 percent above baseline.
Flowers, Gifts, Food, and Drink
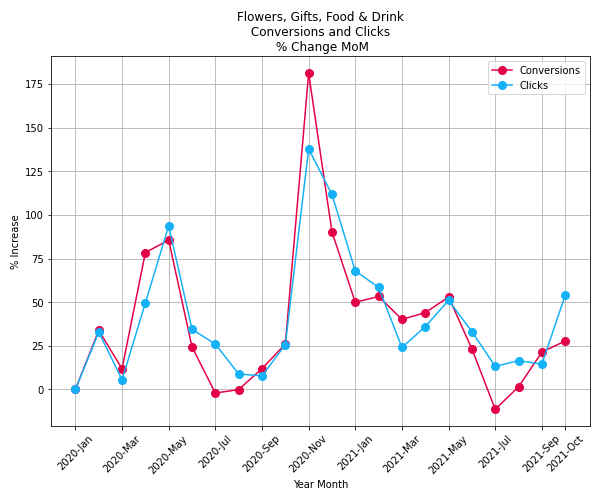
Both conversions and clicks saw some gains in the Flowers, Gifts, Food, and Drink category in October as they continued to recover from a July nadir. Clicks were 50 percent above the pre-pandemic benchmark, among the highest they’ve been all year. Conversions hovered around 25 percent above baseline for the second month in a row.
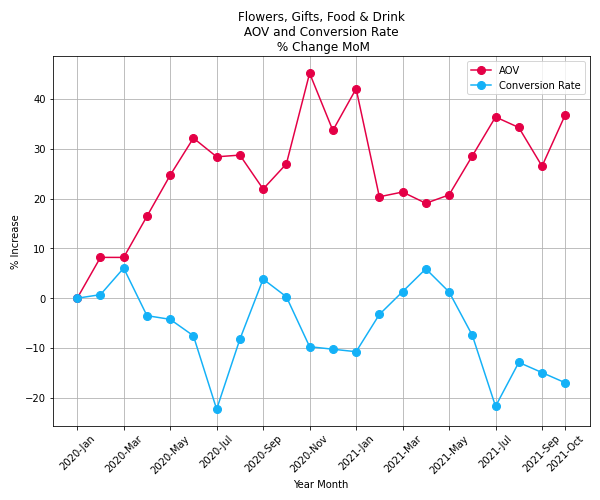
Conversion rate in the category has been below baseline since June, and greater growth in clicks in October didn’t help matters as the metric took a modest loss in that month. AOV saw a sharp rise in October, possibly spurred by Halloween. At nearly 40 percent above the benchmark, it’s among the highest numbers we’ve seen since the study began.
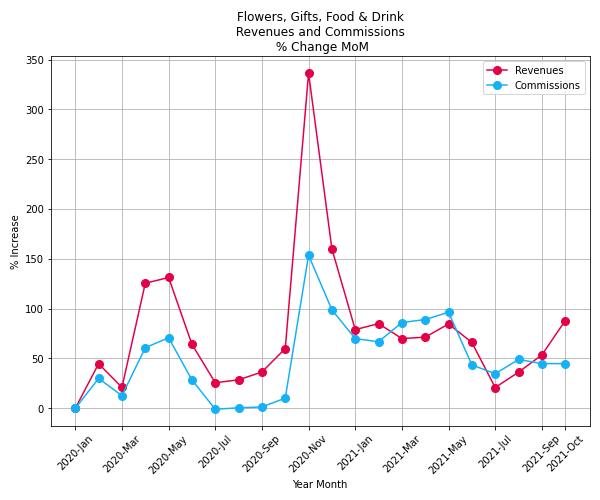
Revenues grew nearly 50 percent in October, a substantial gain that merely looks modest compared to what we saw in November of 2020. Commissions have been hovering close to 50 percent above baseline since June, which is on the lower end of what we’ve seen throughout the year.
Health and Beauty
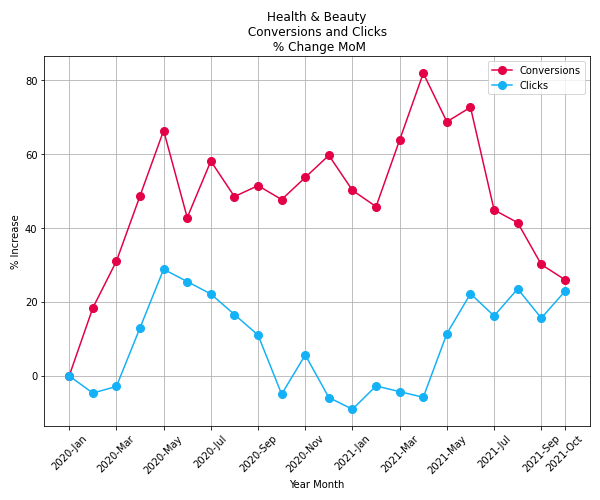
The Health and Beauty category was a big story early in the pandemic, but that may be changing as we move through fall and into a second pandemic winter. Conversions were around 25 percent above baseline in October, which is the lowest we’ve seen since February of 2020. Clicks have nicely bounced back since they plummeted in late 2020 — the metric was around 20 percent above baseline in October, nearly the highest it’s been all year.
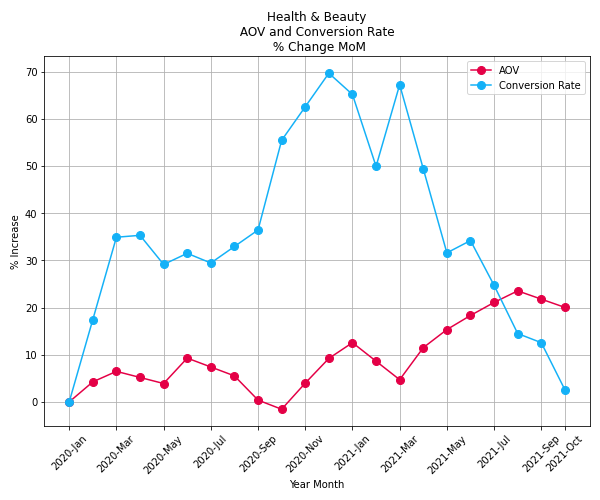
Conversions were the lowest they’ve been since February 2020, and that contributed to the lowest conversion rates the category has seen since the baseline was set in January of 2020. That hasn’t hampered AOV, though. Although the metric was down a fraction in October, at 20 percent above baseline it wasn’t too far off from its August peak.
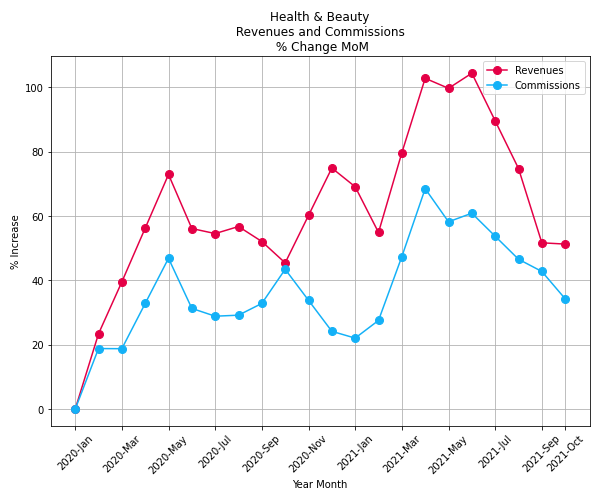
Revenues stabilized in October after three consecutive months of decline. However, at 50 percent above the pre-pandemic benchmark, they are healthy. Meanwhile, commissions fell for the fifth time in the past six months but remained higher than what we saw throughout most of 2020.
Home and Garden
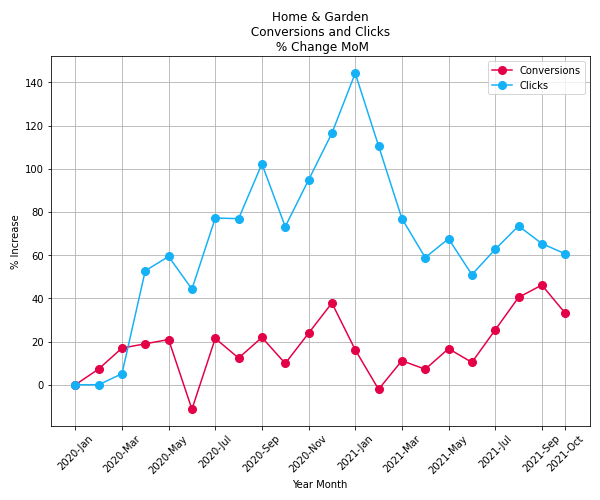
Conversions were down for the Home and Garden category in October, ending three consecutive months of growth that led to a new peak in September. Clicks were down as well. This mirrors what we saw in October of 2020, right before both metrics grew steadily that November and December.
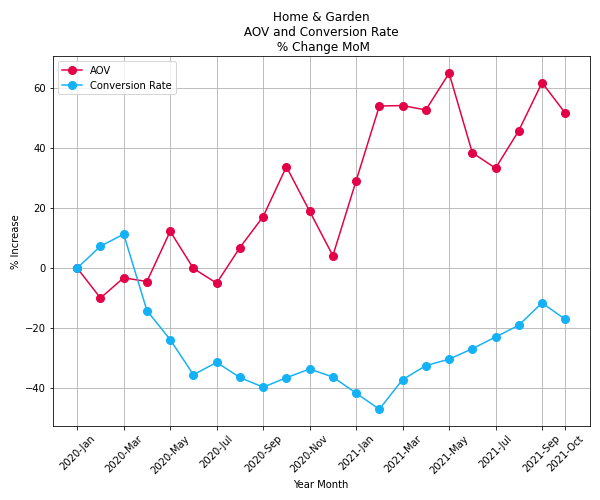
AOV remains high in the category. Although the metric fell by about 10 percent in October, it was still one of the highest performing months we’ve seen for the category. Meanwhile, conversion rate was down for the month, ending seven months of positive growth for the metric. Unfortunately, even with that much consecutive growth, the metric has failed to rise above baseline since March of 2020.
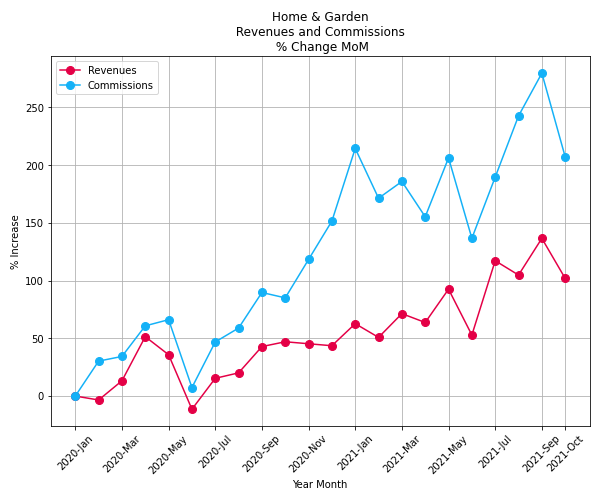
Revenues and commissions were down in October, but that was after both metrics hit new high points in September. Commissions remain nearly 200 percent above baseline while revenues are 100 percent above it.
Telco and Utilities
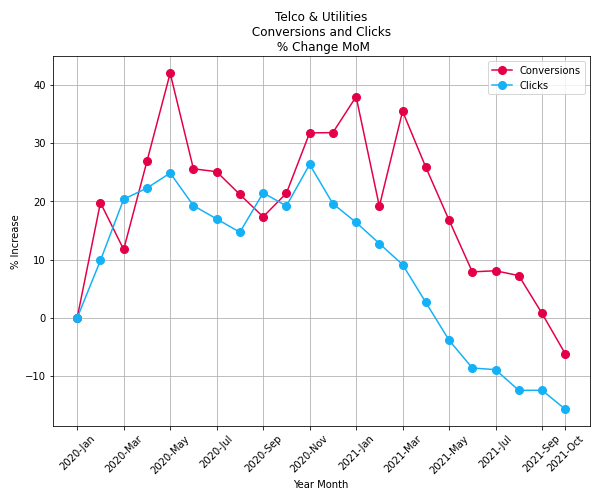
Click and conversion activity within the Telco and Utilities category continued its steep decline. Both metrics hit new low points in October. Clicks were 15 percent below baseline and have shown either flat or negative growth every month since November 2020. Conversions were around 5 percent below baseline, having shown no growth since March of this year.
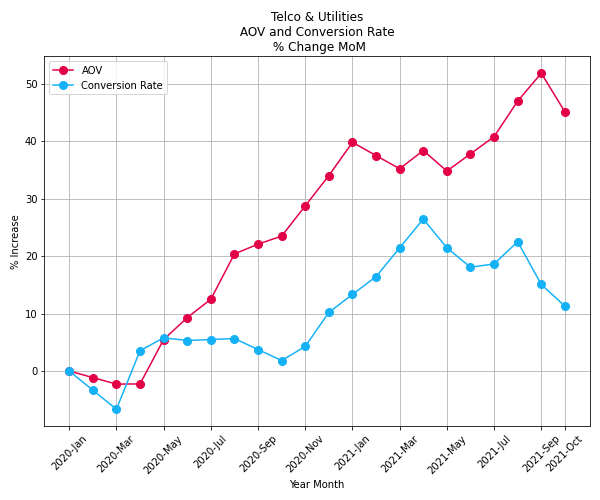
As we’ve seen in other categories, basket size took a small dip but remained among the highest we’ve seen over the course of this study. At 45 percent above baseline, the metric remains positive for brands. However, plummeting clicks and conversion didn’t help conversion rates, which were down for the second consecutive month.
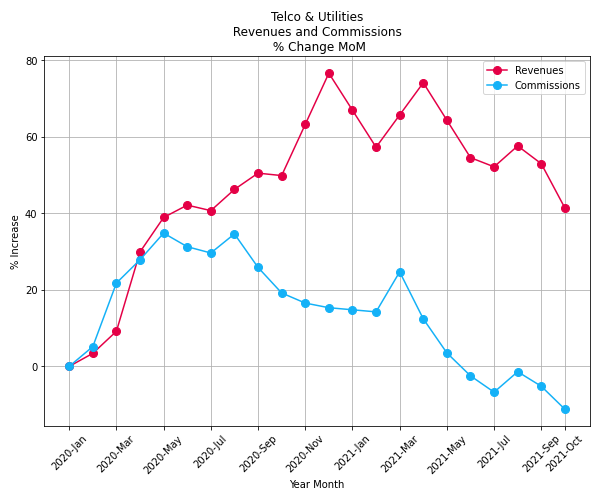
Revenues fell to 40 percent above baseline in October, which is the lowest they’ve been for any month since July of 2020. Meanwhile, commissions were 15 percent below, the lowest point we’ve seen since the study began.
Travel
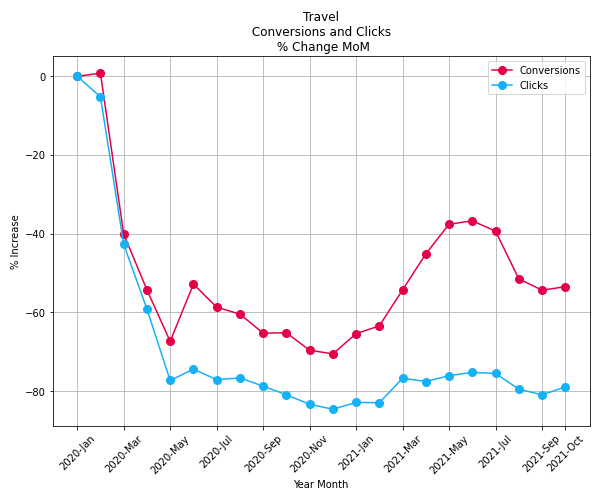
Woes continue for the Travel category. A spring and early summer of hope gave way to a caution-filled fall, and clicks (-80 percent) and conversions (-50 percent) have remained static for the past three months. In doing so, they remain well below baseline, which is where they’ve been since February of 2020.
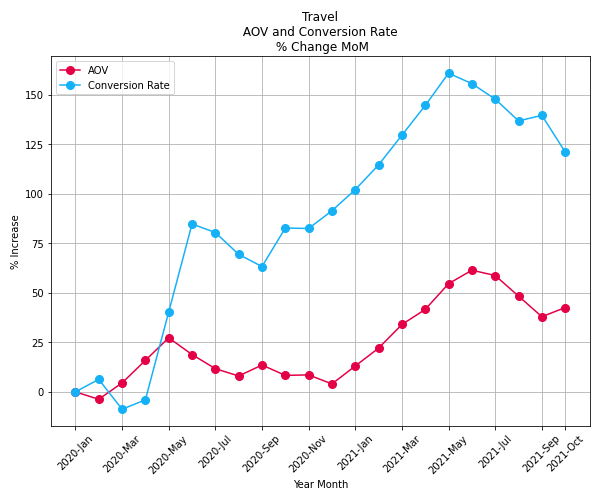
Even with anemic click and conversion activity, we’ve seen healthy conversion rates for the Travel category throughout the year. The metric experienced a big drop in October, declining by about 20 percent but remaining 125 percent above baseline. AOV moved just slightly in the positive direction, ending October at 45 percent above the benchmark.
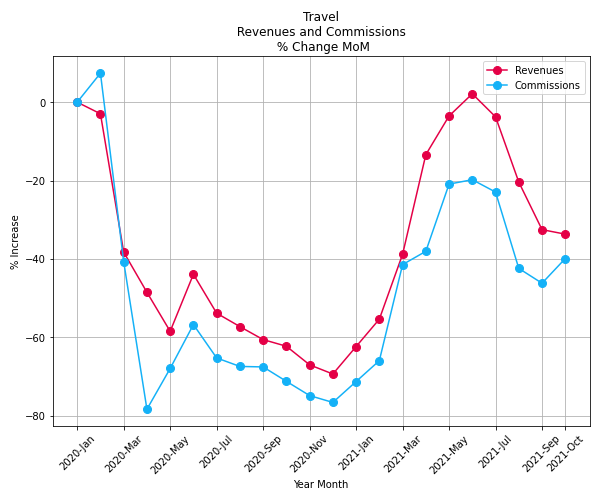
Commissions were up and revenues were down in Travel in October. Both metrics hovered around 40 percent below the pre-pandemic benchmark, and while not great, that’s not as bad as what we saw throughout much of 2020.
Grappling with a new normal and a question-filled Q4
The “return to normal” that many Americans expected this past summer never materialized, and we’re now deep into an autumn that in the best case can only be described as “close to normal.”
Pre-pandemic activities like Halloween trick-or-treating returned in October but travel still hasn’t rebounded, showing that many consumers remain cautious. It remains to be seen whether FDA approval for children as young as five to receive the COVID-19 vaccine will change the outlook on travel during the coming holiday season.
Meanwhile, many sectors continue to feel the pain of a worsening supply chain crisis, which could affect their critical Q4 sales. At impact.com, we’ll continue to track progress in the partnerships sector in 2021 and report on the latest performance metrics as they progress.
To see how you can connect with your audiences in authentic and valuable ways through partnerships, reach out to an impact.com growth technologist at grow@impact.com. We’ll help guide you through.