Cyber Week 2024 drove $41.1 billion in online spending across the five-day period, according to Adobe—marking a significant milestone in holiday retail performance. This strong performance emerged from a notable shift in consumer buying patterns: shoppers approached purchases more strategically, extensively researching products and creating wish lists months in advance.
The impact.com team analyzed data from thousands of North American retail brands during the four weeks leading up to and including Cyber Week (November 2 – December 2, 2024). Our findings reveal how this more calculated approach to holiday shopping is reshaping partnership marketing strategies and creating new opportunities for brands to engage value-conscious consumers.
Key market indicators show consumers are increasingly sophisticated in their deal-hunting approach:
- 92% of shoppers began research before the holiday season
- 44% utilized wish lists to track price drops
- Conversion rates rose 19% in the analysis period compared to 2023, despite an 11% decrease in overall clicks
- Average order values increased 5% during the analysis period as shoppers consolidated their purchases
These trends signal a critical shift in how brands need to approach their partnership strategies, particularly in engaging consumers earlier in their decision-making journey.
Strategic insights for brands
- Optimize for research-first shopping: While clicks decreased 14% YoY during Cyber Week, conversion rates increased 23%, indicating a shift toward pre-planned purchases.
- What brands can do: Strengthen your pre-Cyber Week content strategy and ensure partners have detailed product information available by September.
- Capitalize on increased consumer investment: With 6% YoY growth in both spending and transactions during Cyber Week, consumers are ready to buy—but more selectively.
- What brands can do: Focus partnership strategies on value demonstration rather than pure discounting to capture higher-intent purchases.
- Make the most of Black Friday momentum: Black Friday transactions exceeded Cyber Monday by 16% in 2024.
- What brands can do: Consider extending Black Friday offers to loyalty partners earlier, while maintaining separate Cyber Monday promotions for technology and entertainment categories.
- Adapt to category-specific timing: Computers and Electronics sales shifted predominantly to Cyber Monday, despite the overall Retail and Shopping vertical’s higher Black Friday performance.
- What brands can do: Tailor your partnership activation timeline by category, with technology-focused partners receiving priority placement during Cyber Monday.
- Invest in high-performance partnerships: Commission payments rose 11% overall, with an 8% increase during Cyber Week, reflecting stronger partner performance.
- What brands can do: Review commission structures now to reward partners who drive higher-converting traffic, particularly in the pre-purchase research phase.
Methodology
The impact.com Cyber Week Research tracked key metrics across thousands of North American brands in the Retail and Shopping vertical. The study compared brand performance during Cyber Week 2023 and Cyber Week 2024 in a year-over-year (YoY) analysis.
Cyber Week refers to the period from Thanksgiving to Cyber Monday. While the analysis period covers the four weeks leading up to Thanksgiving and including Cyber Week:
- 2023: 10/28 – 11/27
- 2024: 11/2 – 12/2
While the complete analysis of the Retail and Shopping vertical includes various sub-categories, the following were highlighted for this report:
- Apparel, Shoes, and Accessories
- Computers and Electronics
- Health and Beauty
- Home and Garden
- Sport, Outdoor, and Fitness
- Flowers, Food, Gift and Drinks
- Mattresses and Bedding
- Arts and Entertainment
Our analysis tracks key performance metrics: average order value (AOV), clicks, transactions, conversion rates, brand, and consumer spending. Researchers tracked these KPIs by comparing same-store data, from brands that actively used the impact.com platform during both analysis periods.
| CYBER WEEK 2024 GLOSSARY |
| WORD | DEFINTION |
|---|---|
| Total brand spending | The start of action-based and non-action-based payments. |
| Non-action based payment | Brand expenditure that occurs when brands pay their partners (bonuses, paid placement fees, etc.) |
| Action-based (commission) payment | Brand expenditure that occurs when brands pay their partners a commission for a specific, predefined action. |
| Network partners | Publisher platforms that broker access to brand campaigns and provide tracking, reporting, and payment services. This includes publishers categorized as network, syndication blog networks, or CPA networks. |
| Content review partners | Publishers that produce editorial content to promote, compare, and list products and services. This includes premium publishers, shopping comparisons, financial comparisons, content, bloggers, etc. |
| Loyalty and reward partners | Publisher platforms that incentivize transactions from consumers, employees, or businesses through a membership or benefits reward program. |
| Deal and coupon partners | Publishers who aggregate and classify deals and promotions for consumer savings. |
| Commerce solutions | Site-side shopping tools and services that drive conversion optimization for brands. |
| Media arbitrage | Search engine, social, or programmatic marketers that manage keyword campaigns for brands, often on a performance basis. |
| Cross-audience monetization | Businesses that publish offers, content, and complementary products to current customers or audiences (e.g., exit traffic, improved UX) to drive incremental revenue. |
| Analysis period | The 30 day period leading up to and including Cyber Monday. The date range for 2023 is October 28 to November 27, 2023, and for 2024, November 2 to December 2, 2024. |
| Cyber Week | Cyber Week refers to the period from Thanksgiving to Cyber Monday. |
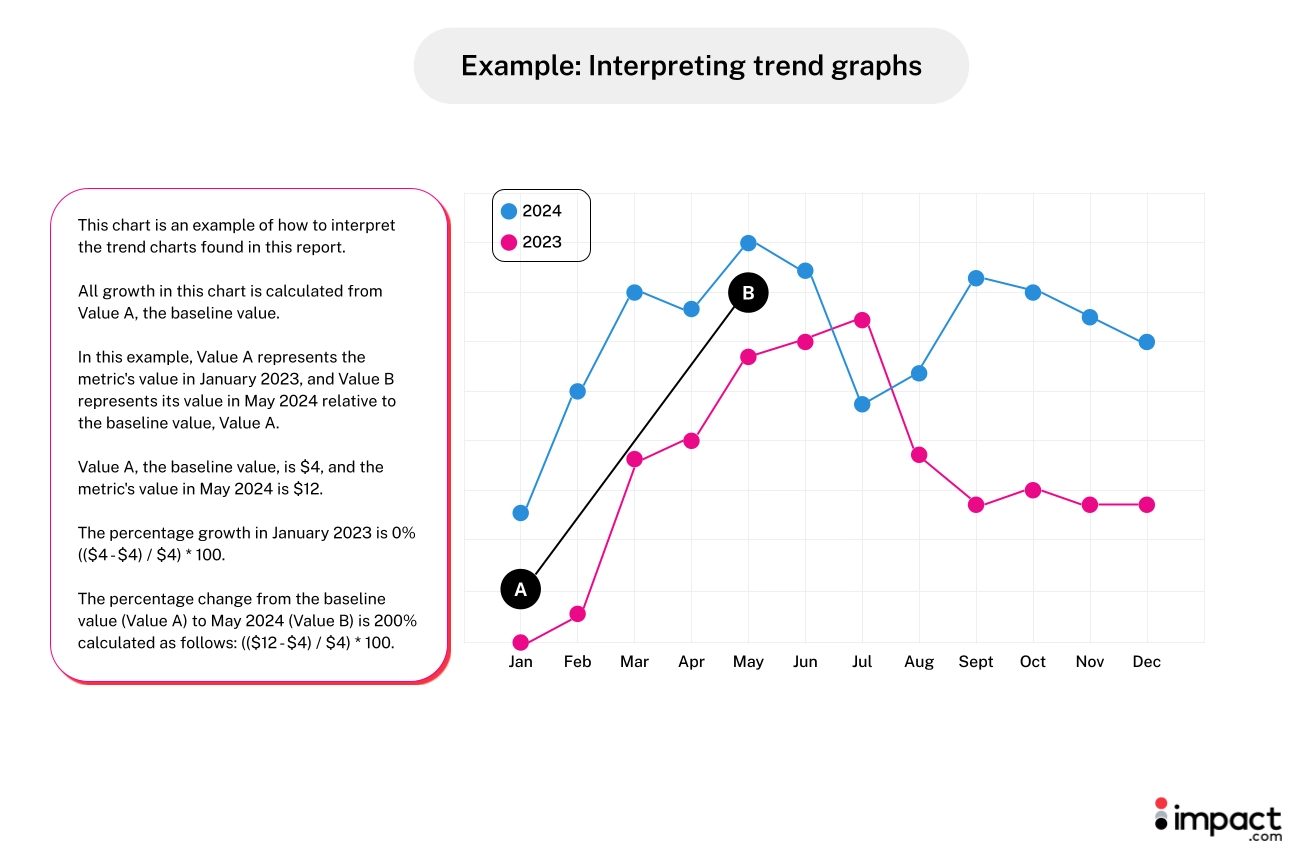
Interpreting the graphs
8 key insights: Measuring partnership success during Cyber Week 2024
Our analysis of Cyber Week 2024 reveals a significant shift in holiday shopping behavior. Consumers approached purchases methodically, researching products months in advance and leveraging partnership platforms to make informed decisions. These changes in consumer behavior created new opportunities—and challenges—for brands and their partners.
The following insights examine how these changes affected key performance metrics and what they mean for future partnership strategies.
Discover our Cyber Week 2024 insights:
- Click volume 14% decrease shows a shift in consumer search behavior
- Pre-Cyber Week conversion rates rise 19% as shoppers start earlier
- A 16% higher transaction volume on Black Friday vs. Cyber Monday
- Computers and Electronics and Arts and Entertainment lead Cyber Monday sales, revealing category performance shift
- Average order values remain similar while item values drop 4%
- Consumer spending jumps 11% driven by higher transaction values
- Loyalty partners generate 66% of transactions and 62% of revenue
- Partner commission payments increase 11% with 8% Cyber Week growth
1. Click volume 14% decrease shows a shift in consumer search behavior
Like last year, click volumes in 2024 picked up the Sunday before Thanksgiving and spiked on Black Friday and Cyber Monday.
While click volumes were up from the Sunday before Thanksgiving and during Cyber Week, the overall volume was lower than last year.
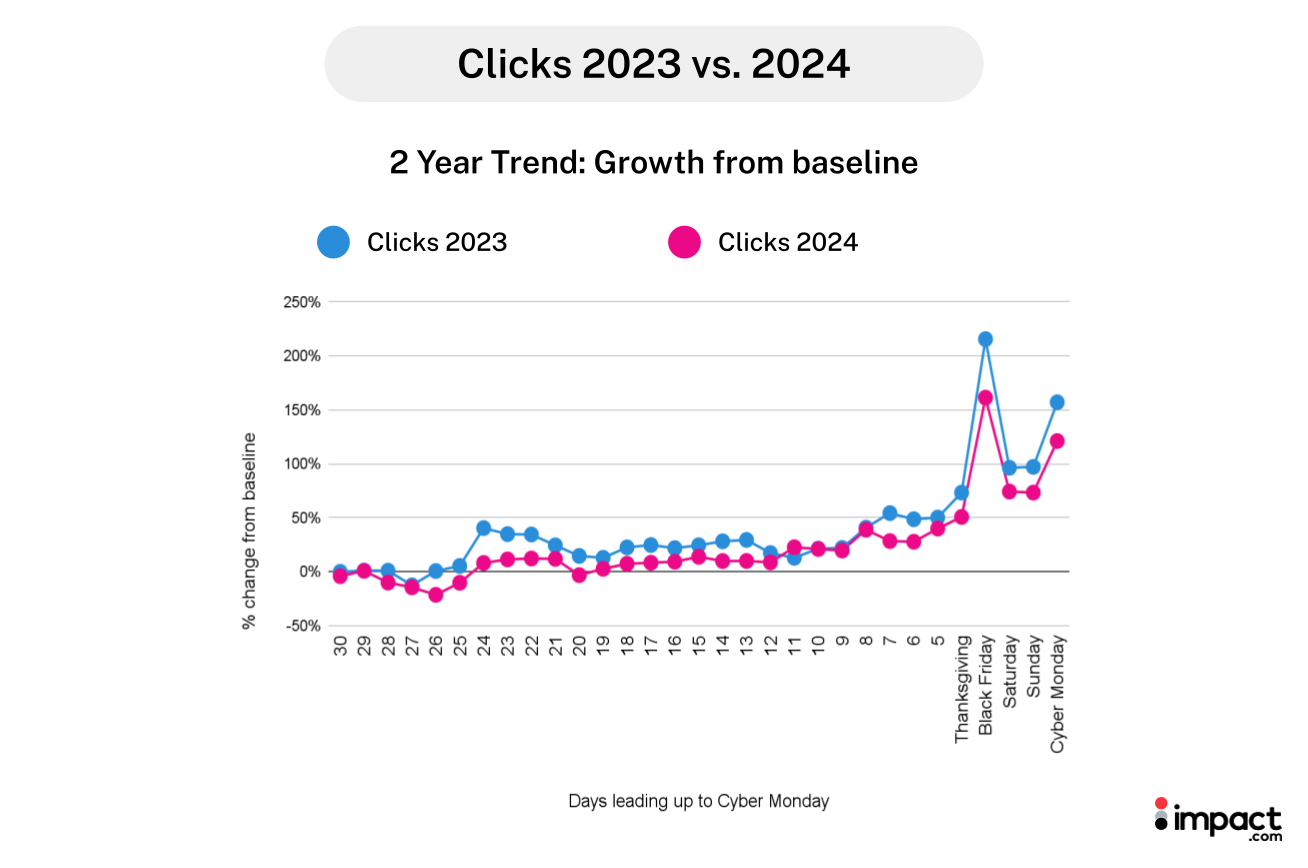
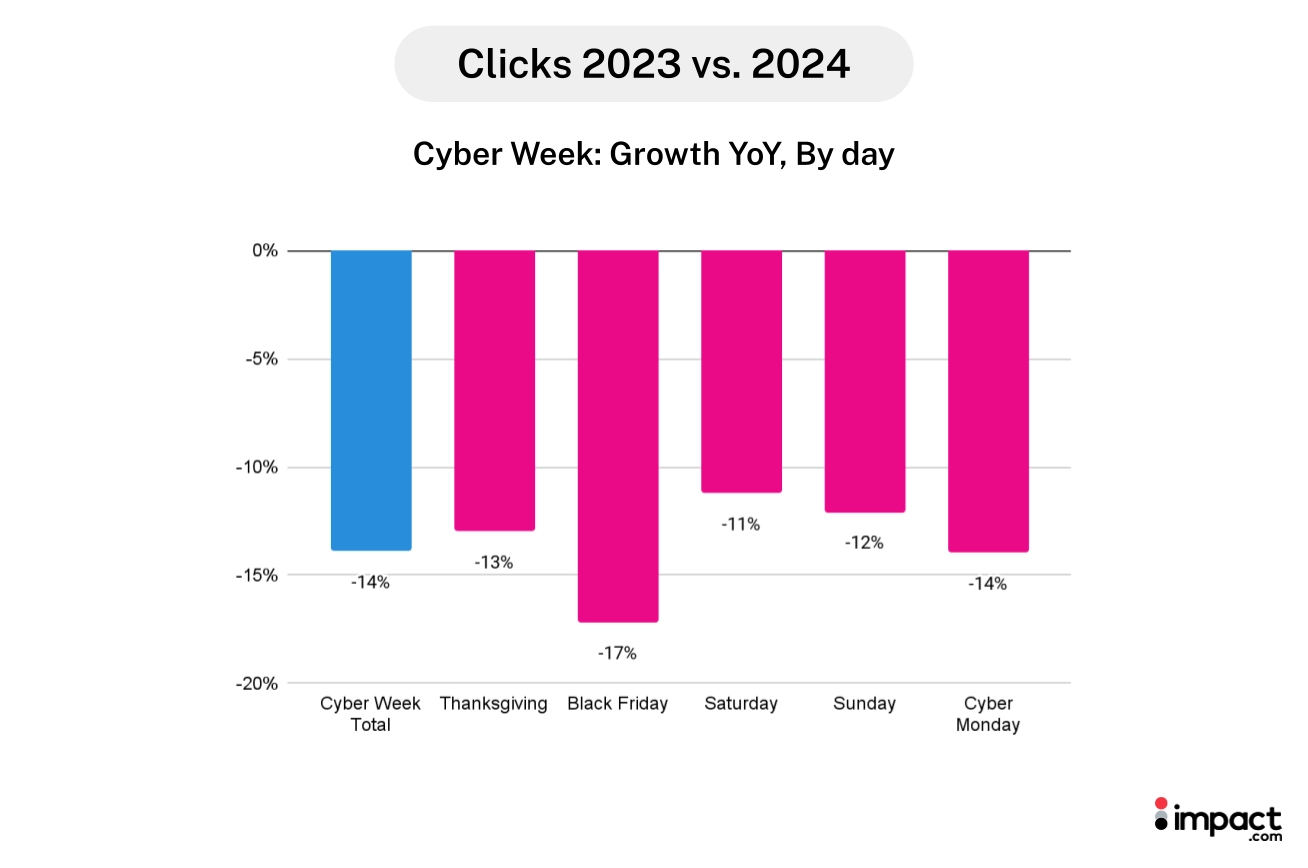
Clicks decreased by 11% during the analysis period and 14% during Cyber Week. The decline in clicks is likely due to shoppers making more planned purchases this year.
Other factors that may have contributed to this trend:
- Buyers used wish lists and price trackers to track price drops, focusing on securing the best deals for planned items instead of browsing for impulse buys.
- Publisher content influenced buying decisions. Social proof from online reviews and product ratings may have helped people decide which items to buy.
- Solid discounts made products more attractive. Our data shows that the average item value decreased and the average items per purchase increased during Cyber Week, indicating that high-quality deals might have encouraged a more simplified path to purchase.
According to our 2024 consumer research, 92% of shoppers research before buying during Cyber Week, with some starting in September or earlier.
2. Pre-Cyber Week conversion rates rise 19% as shoppers start earlier
While consumers were less likely to make unplanned purchases, they were prepared to shop earlier than last year.
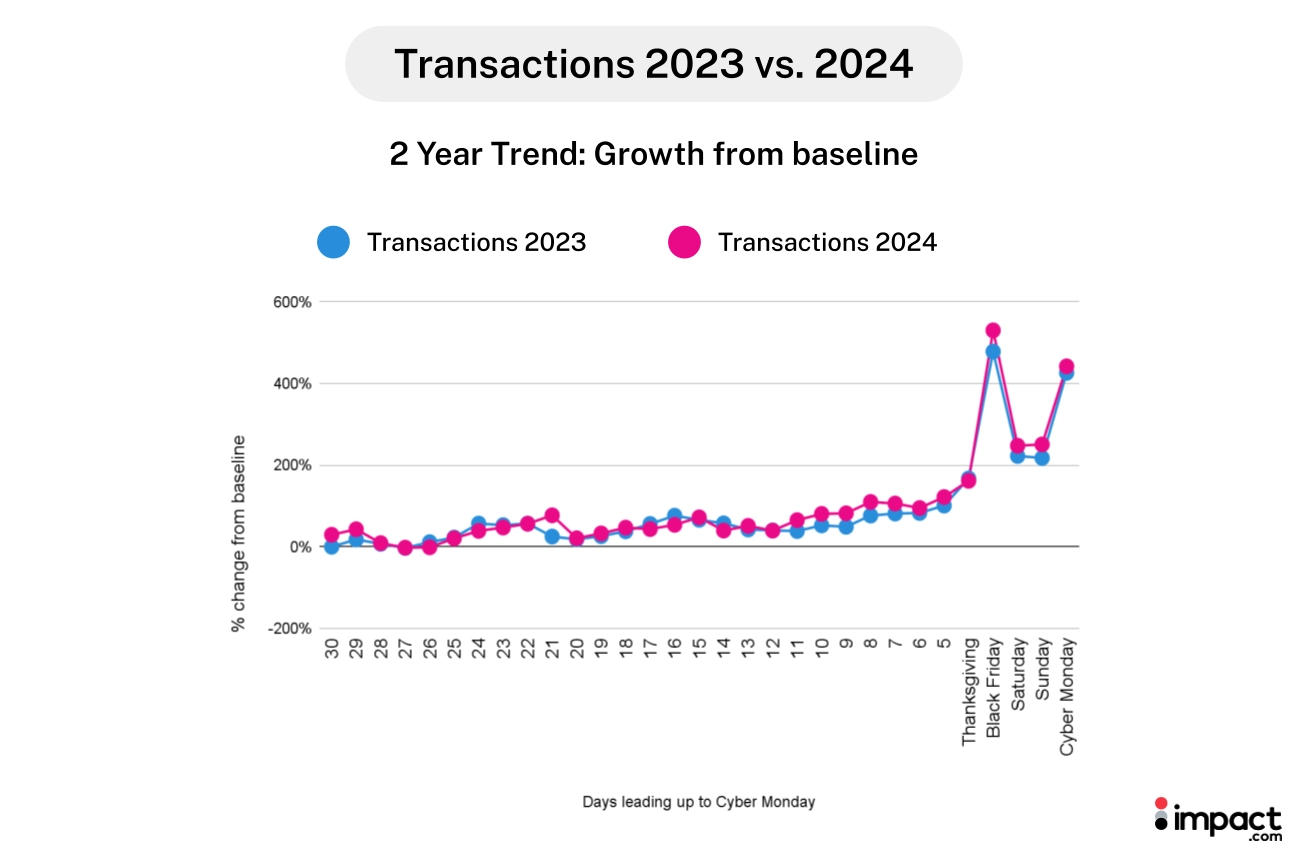
Conversion rates during the 2024 analysis period rose 19% compared to last year, gaining momentum on the Friday before Thanksgiving (day 10 on the chart). This was earlier than in 2023, when conversion rates started to pick up closer to Cyber Week.
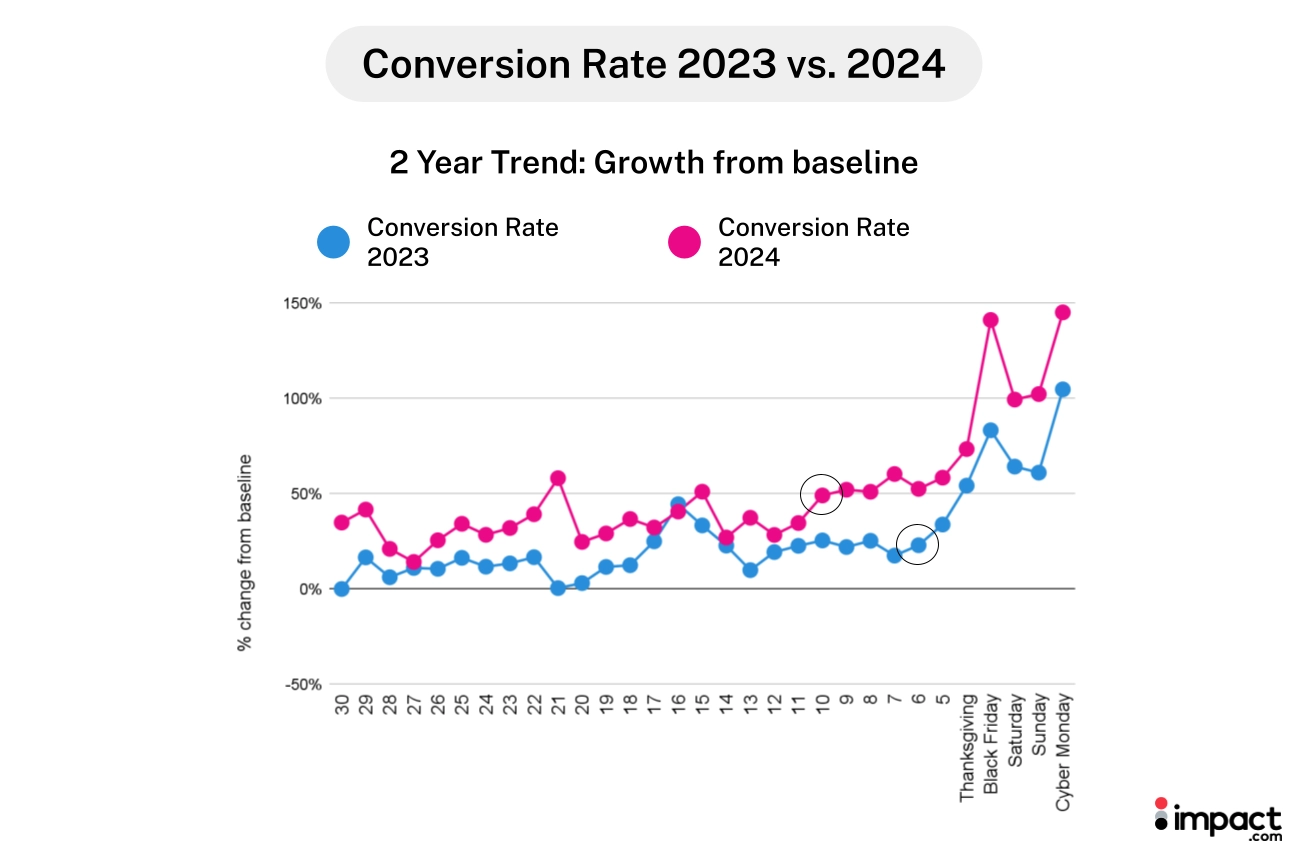
The rise in conversion rates leading up to Cyber Week and the surge in Black Friday and Cyber Monday transactions suggests that shoppers waited for better deals before making their purchases.
Although conversion rates increased earlier this year compared to last, overall purchase trends remained consistent YoY. This could indicate that they still held out for the best discounts.
Shoppers started their research in September or earlier, so they likely had a clear idea of their ideal purchase price by the time the deals rolled around.
This might be because many consumers (44%) used wish lists to track price drops. Others may have bought when prompted by retailer mobile apps, email alerts, influencers, and other notifications.
3. A 16% higher transaction volume on Black Friday vs. Cyber Monday
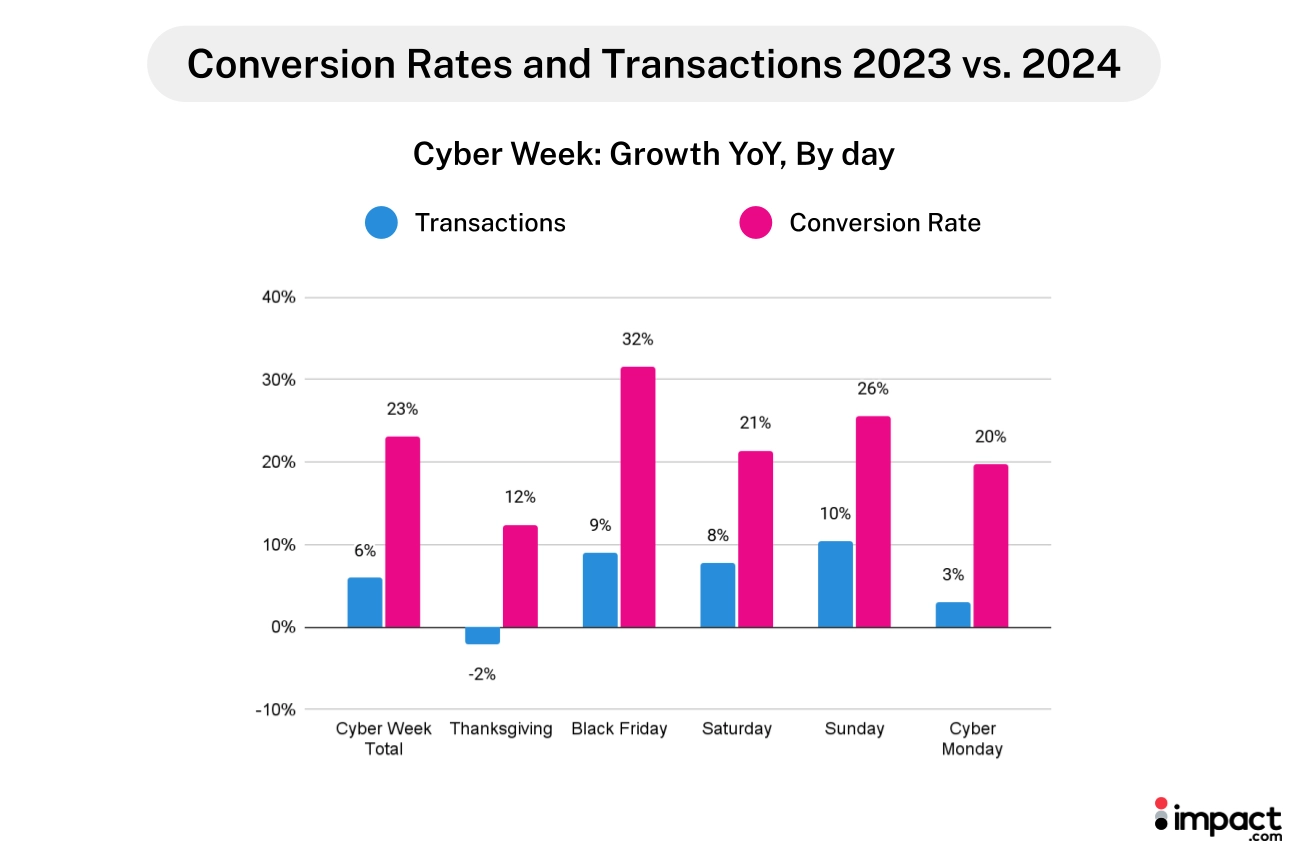
This year, conversion rates increased by 23% during Cyber Week compared to last year. This led to transactions rising 6% during Cyber Week YoY.
During Cyber Week, most transactions occurred on Black Friday, followed by Cyber Monday—the same as last year. Black Friday transactions exceeded Cyber Monday by 16% in 2024, compared to 10% last year.
4. Computers and Electronics and Arts and Entertainment lead Cyber Monday sales, revealing category performance shift
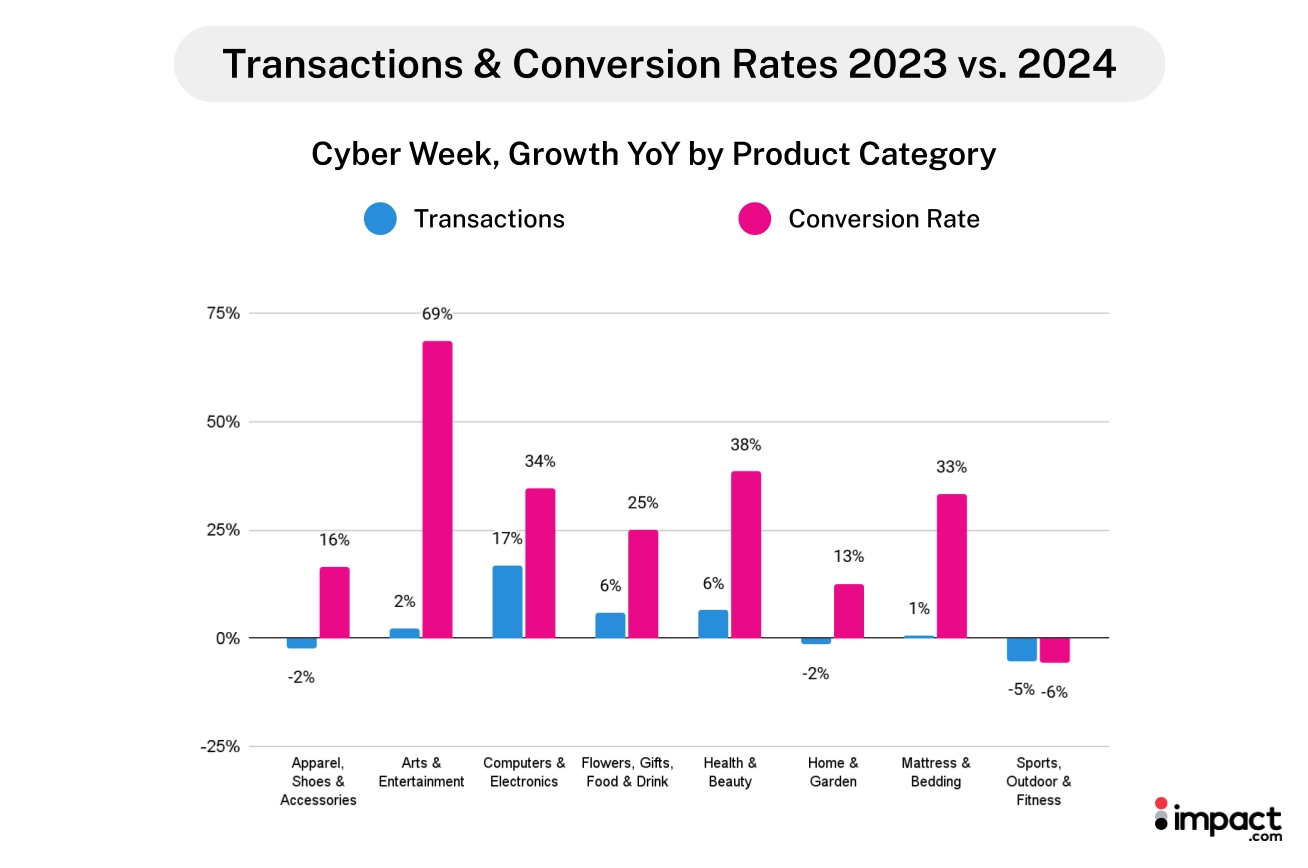
Despite lower clicks than last year, conversion rates were higher for most product categories analyzed for this report.
Conversion rates in the sectors we analyzed saw YoY increases of between 16% (for Apparel, Shoes, and Accessories) and 33% (for Mattress and Bedding), except for Sports, Outdoor, and Fitness, which saw a 6% dip in conversion rate.
The biggest conversion rate jump (69%) was in Arts and Entertainment.
This year’s conversion rate hike netted the sector a 2% increase in sales, likely helped by the movies “Wicked” and “Gladiator II.” Both films opened on Black Friday and earned a combined $270 million in global ticket sales over the Thanksgiving weekend.
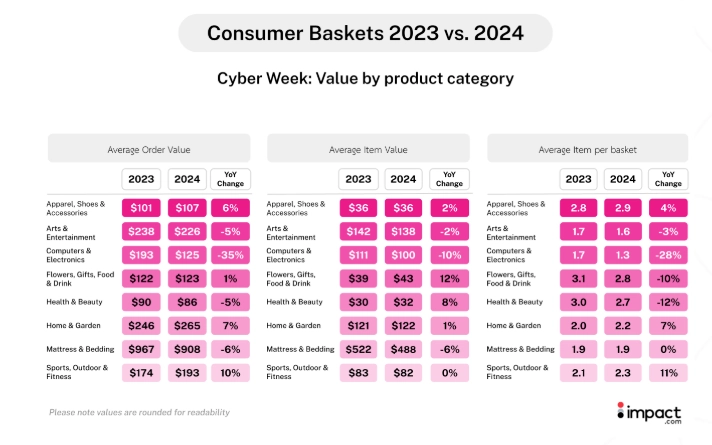
The Computers and Electronics category saw a significant increase in transactions (17%) compared to last year. However, average order value fell by 35% during Cyber Week.
This was likely a result of bigger-than-expected discounts, which peaked at 30% and 21% off listed prices for electronics and computers respectively, as indicated by the lower average item value this year. Our data also found that consumers purchased 28% fewer items per order in this category than in 2023.
Arts and Entertainment; Computers and Electronics; and Flowers, Gifts, Food, and Drink had the most transactions on Cyber Monday this year—exceeding Black Friday sales.
During last year’s Cyber Week, more Computer and Electronics transactions were made on Black Friday than Cyber Monday.
5. Average order values remain similar while item values drop 4%
Shoppers purchased 4% more items per order than last year, leading to the average order value increasing 5% for the analysis period. During Cyber Week, AOV remained similar to last year.
Retailers likely offered more attractive discounts closer to Cyber Week. On the Saturday after Thanksgiving, the average item value in shoppers’ baskets was at its lowest—-even though basket sizes were similar to those on Black Friday.
But customers likely got better deals than last year. The average item value decreased 4% YoY.
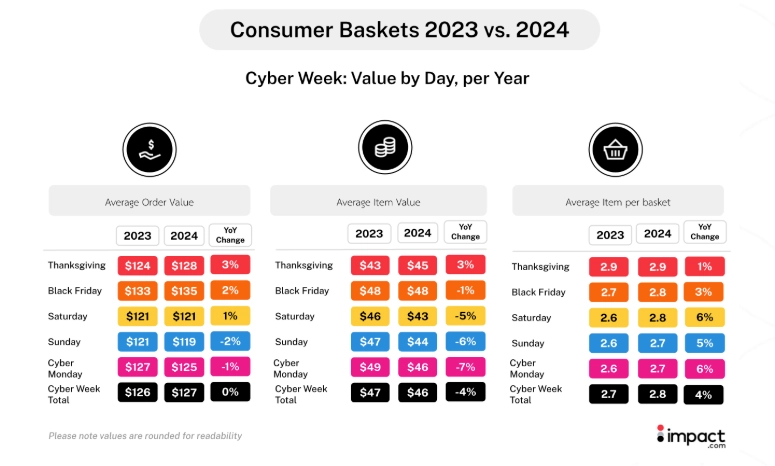
The best discounts during Cyber Week were likely in the Computers and Electronics and Mattresses and Bedding sectors, which saw their average item values drop 10% and 6%, respectively.
Sports, Outdoor, and Fitness enjoyed the biggest YoY AOV jump (10%) during Cyber Week as shoppers purchased 11% more items per order at a similar item value as last year (less than 1% decrease).
Although consumers bought 10% fewer items per order in Flowers, Food, Gifts, and Drinks during this year’s Cyber Week, the purchases were of higher value (12%).
6. Consumer spending jumps 11% driven by higher transaction values
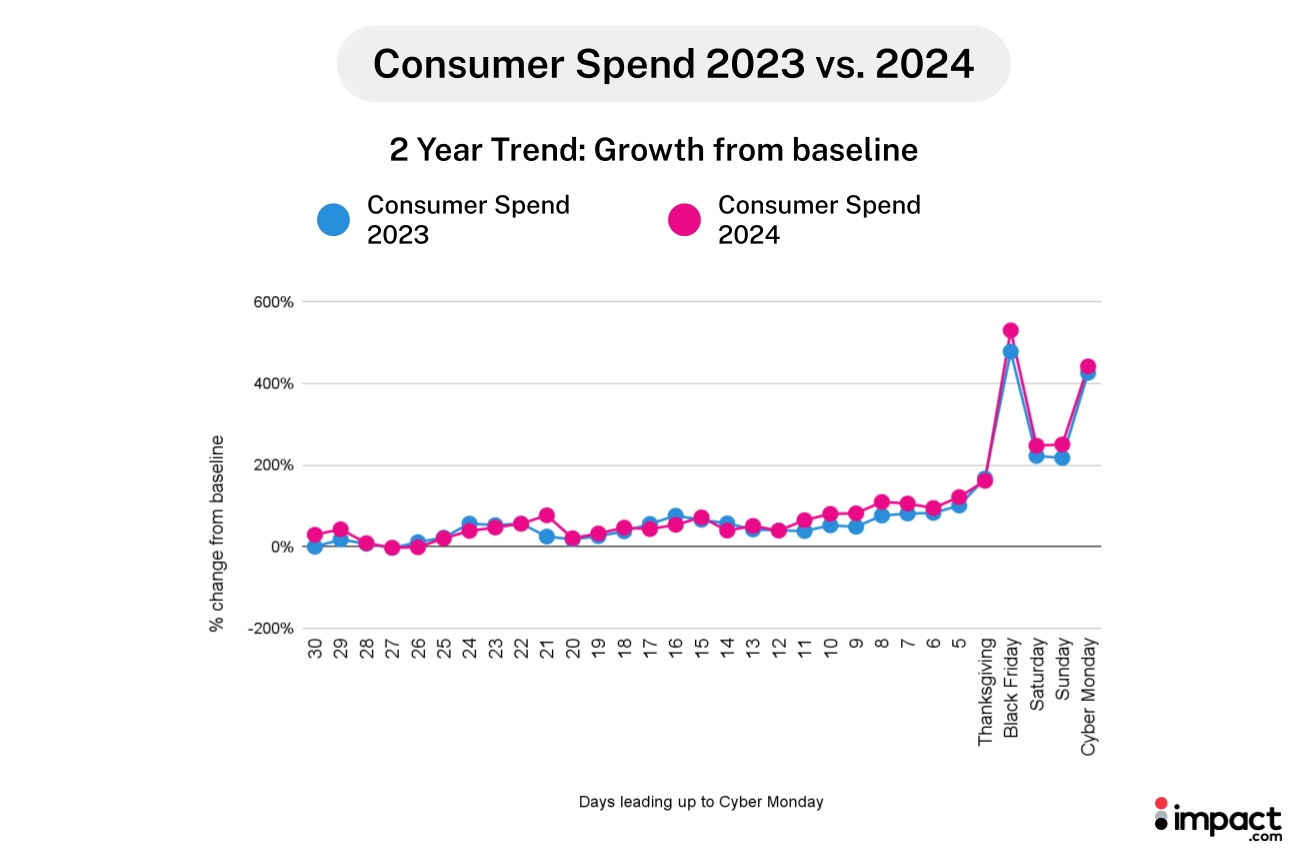
Consumers stuck with their plan to spend either the same amount or more than in 2023. Data during Cyber Week revealed a 6% YoY increase in consumer spending.
Overall consumer spending during the analysis period increased 11% YoY due to more transactions at a higher average order value (5%).
7. Loyalty partners generate 66% of transactions and 62% of revenue
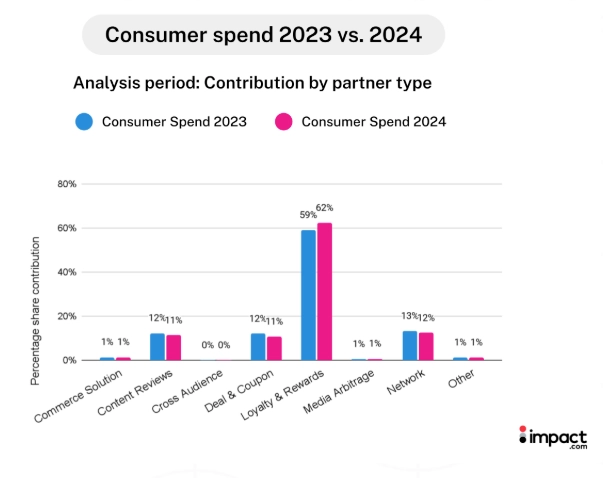
Loyalty and Rewards partners were many consumers’ last touchpoint before checkout—the same as last year.
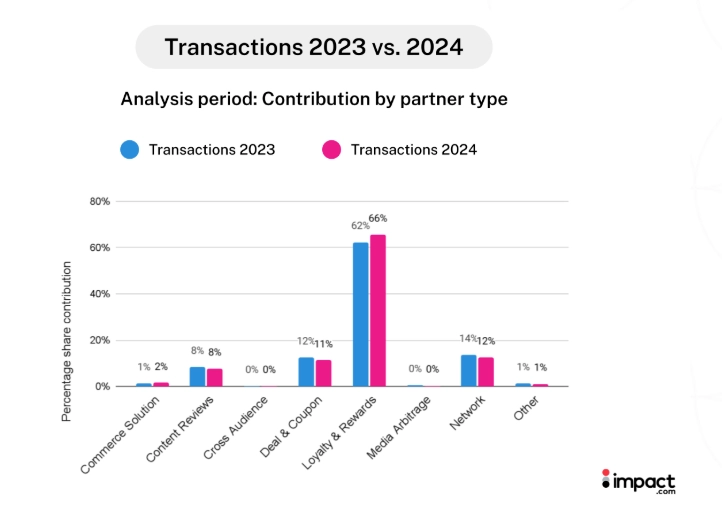
With 66% of transactions and 62% of consumer spending attributed to Loyalty and Rewards partners, brands should continue to grow and nurture this community.
While Loyalty and Rewards partners continue to be lucrative, it’s still essential for brands to invest with other partner types. Other affiliate partners likely play a role earlier in the customer journey and consistently contribute to overall consumer spend.
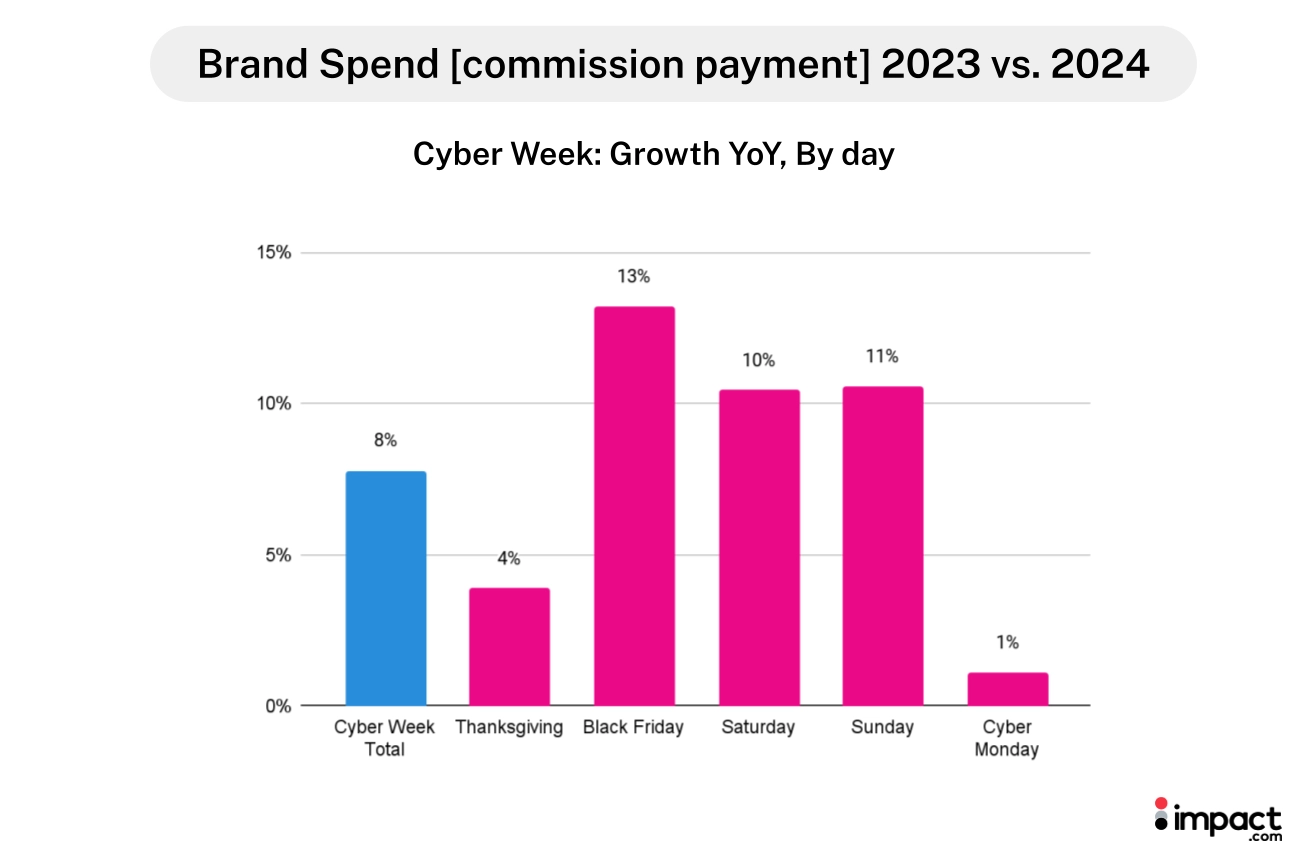
8. Partner commission payments increase 11% with 8% Cyber Week growth
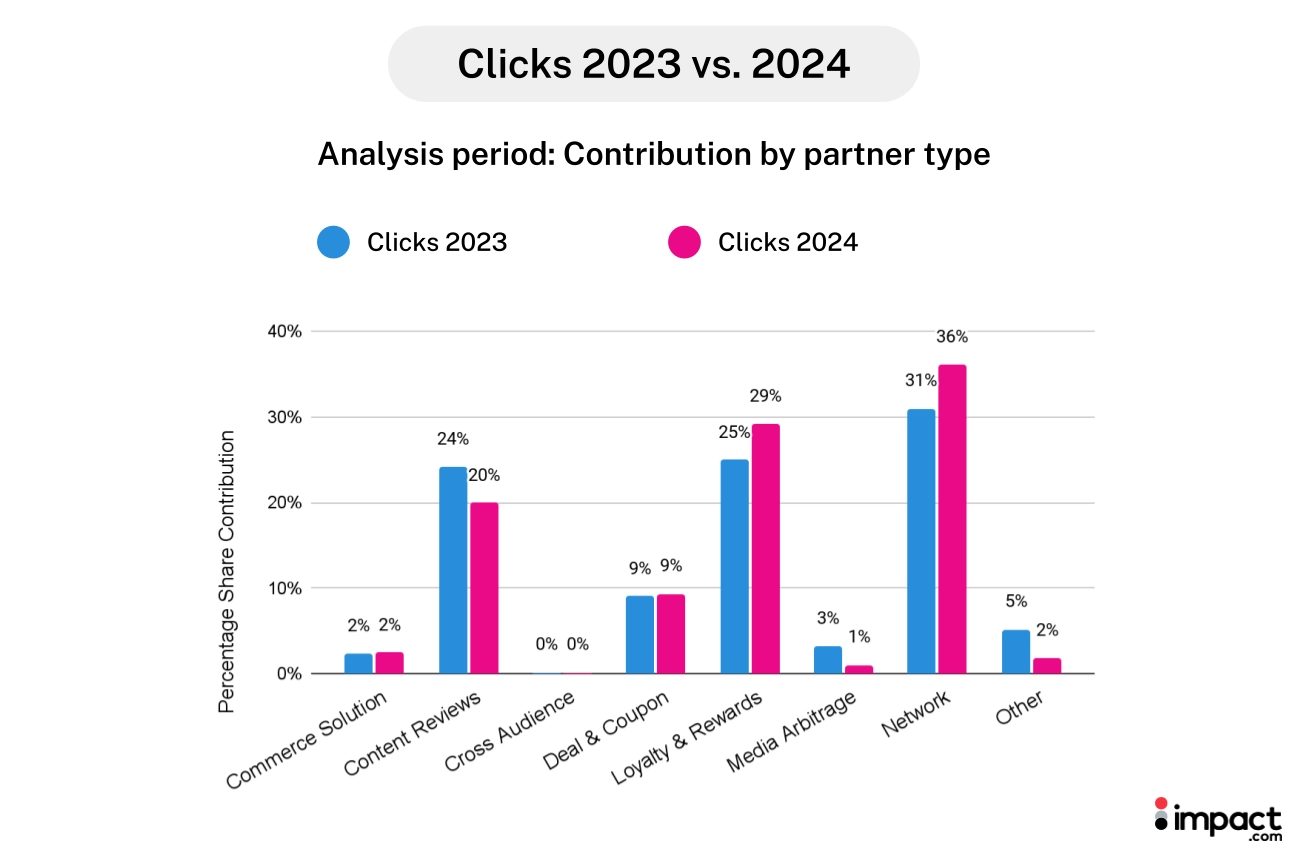
During this year’s analysis period, 36% of clicks were attributed to Network partners.
Similar to last year, Network, Loyalty and Rewards, and Content Review Sites drove the most clicks.
Loyalty and Rewards and Network partners contributed to more clicks this year than last.
As affiliate partners continued to be consistent contributors toward consumer transactions, commission payments jumped 11% during the 2024 analysis period.
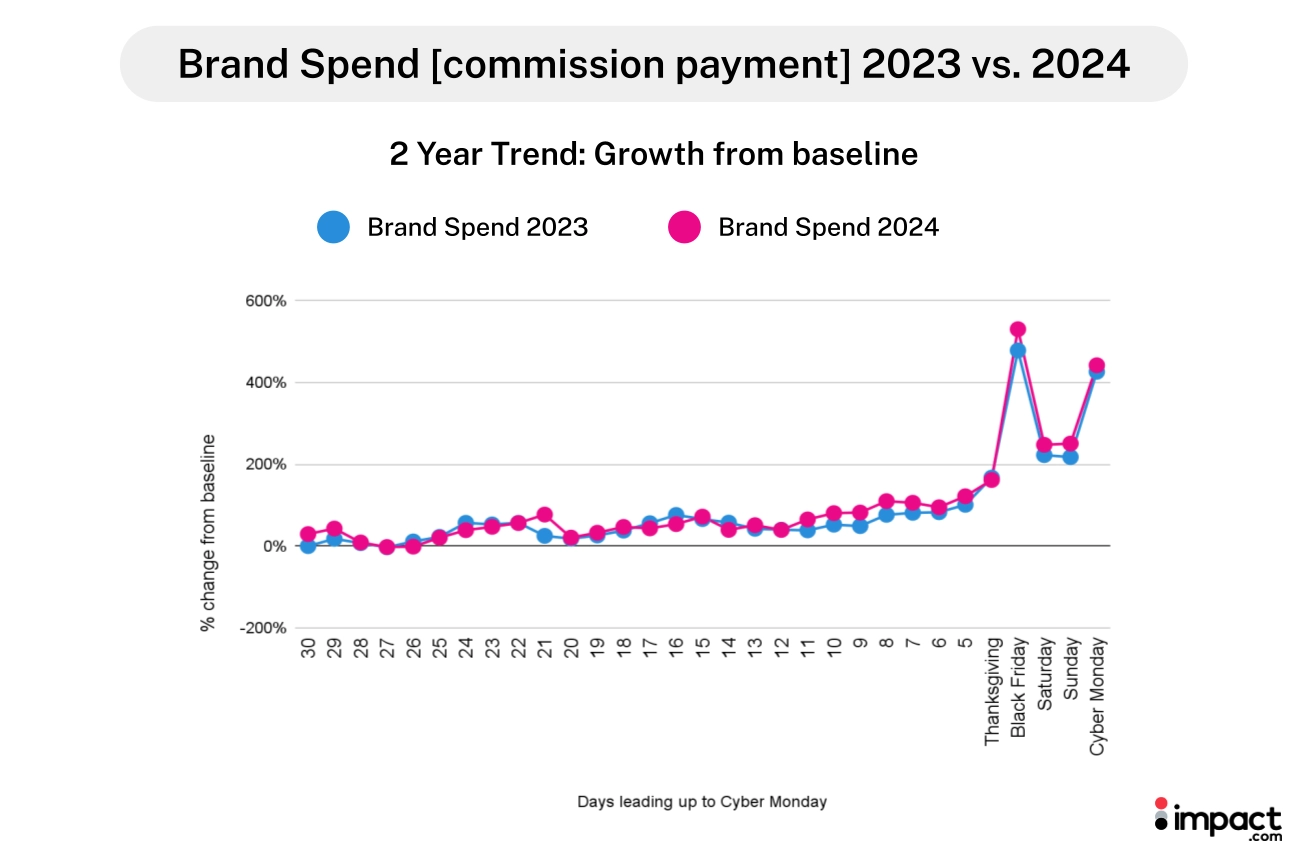
Commission Payment Trends 2024:
Overall Performance:
- 11% increase in commission payments during the analysis period
- 8% increase during Cyber Week specifically
- Slight uptick (1%) in commission rates from pre-Thanksgiving to Cyber Week
Distribution by Partner Type:
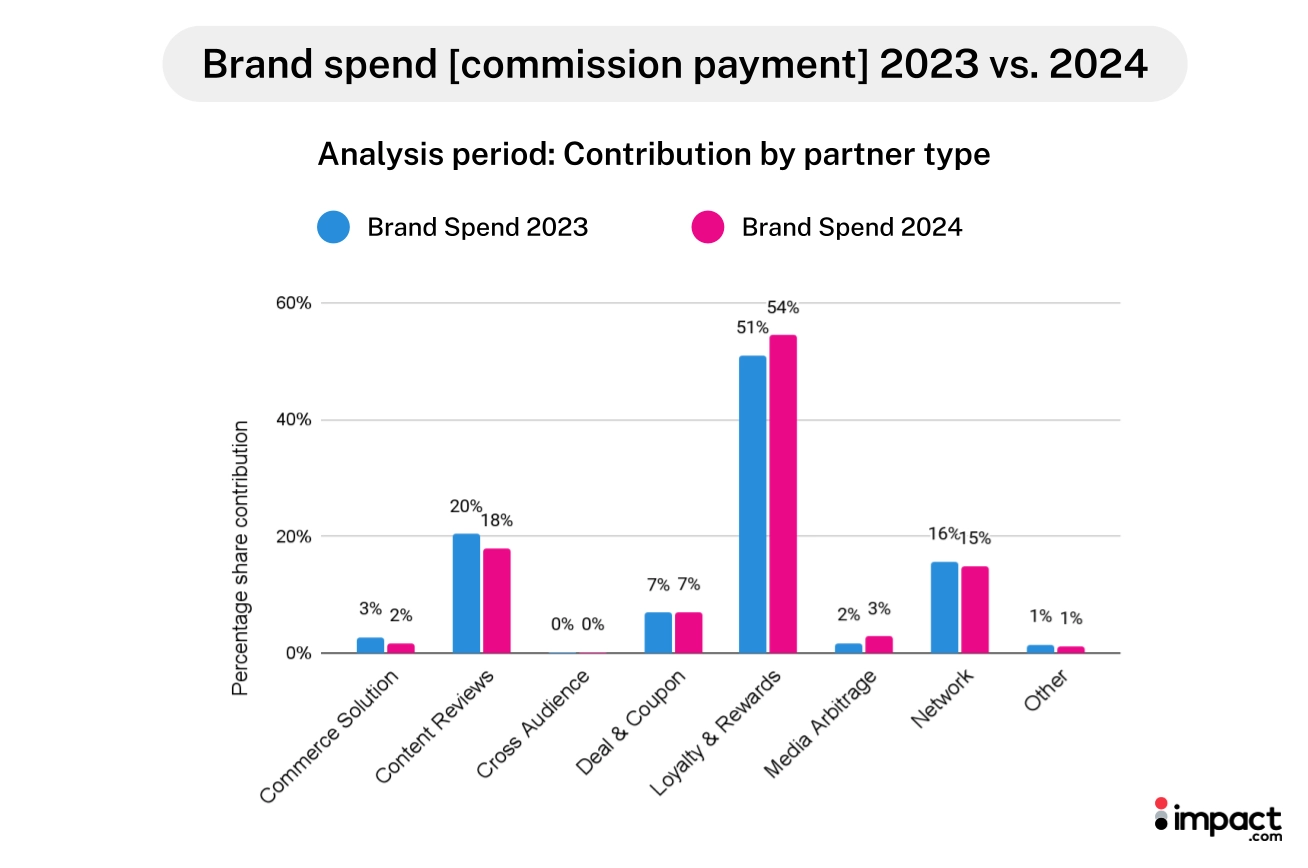
- Loyalty and Rewards partners: 54% of payments
- Content Review partners: 18% of payments
- Network partners: 15% of payments
This distribution remained consistent with 2023 patterns, while total payments increased, indicating stronger partner performance rather than structural changes in commission rates.
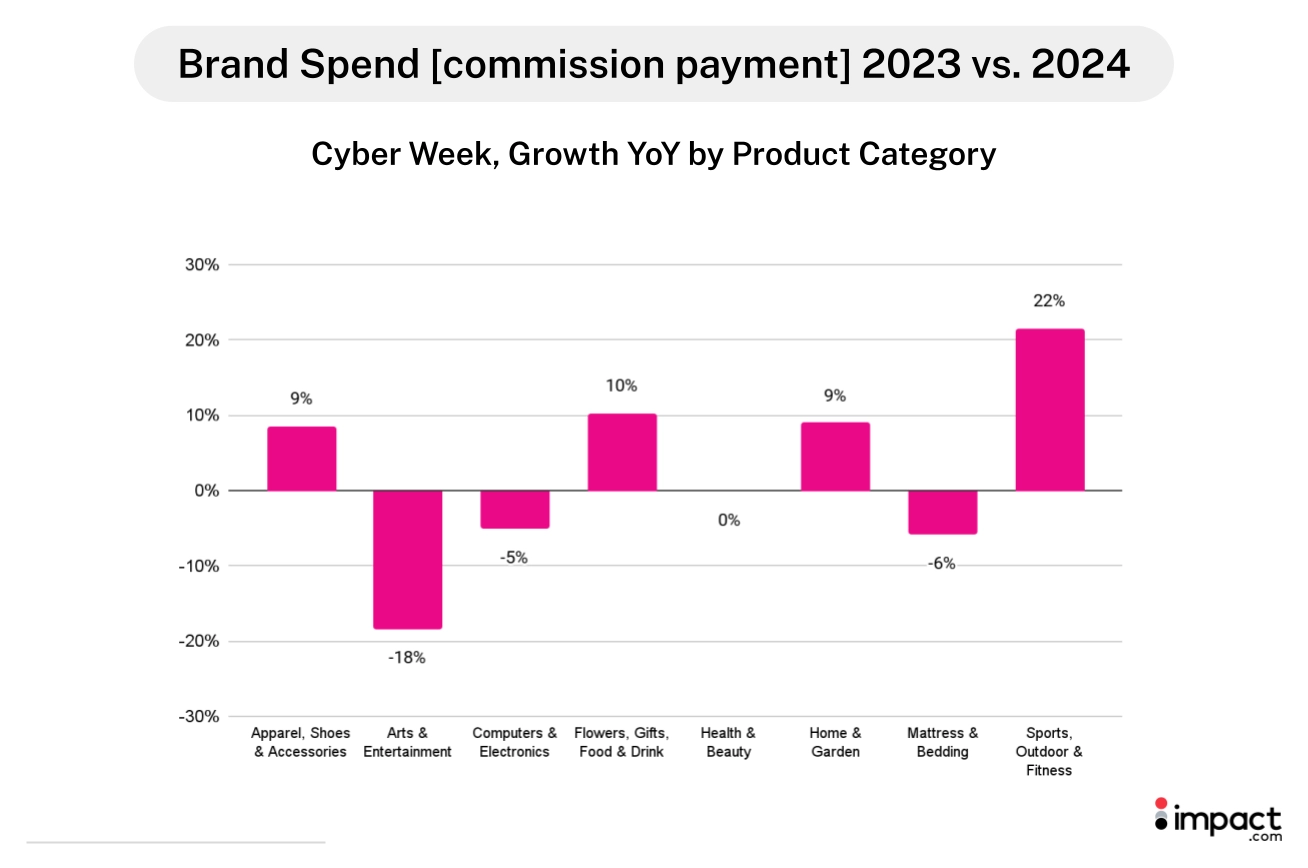
Due to higher commission rates, Sports, Outdoor, and Fitness brands paid 22% more in commissions than last year.
During Cyber Week, AOV increased because there were more items per order this year than last year—despite the value per item remaining the same.
Although there were fewer transactions during Cyber Week this year than last year, consumer spending still increased as buyers made fewer but higher-value transactions.
This could indicate that the partners brands worked with were perfectly aligned with target audiences interested in purchasing Sports, Outdoor, and Fitness products.
During the analysis period, 54% of commission payments in the retail and shopping category were attributed to Loyalty and Rewards partners, 18% to Content Review partners, and 15% to Network partners—similar to last year.
Partnerships empower smarter Cyber Week spending
Cyber Week 2024 marked a significant shift in consumer behavior, with data revealing a more sophisticated approach to holiday shopping:
Key success metrics:
- Overall consumer spending increased 6% YoY despite 14% fewer clicks
- Conversion rates rose 23% during Cyber Week
- 92% of shoppers conducted pre-purchase research
- 44% utilized wish lists for price tracking
Partnership performance demonstrated measurable impact during Cyber Week 2024, with different partner types collectively driving significant results across all key metrics:
- Loyalty and Rewards partners drove 66% of transactions
- Network partners generated 36% of clicks
- Commission payments increased 8%, reflecting partner value
- Multi-partner engagement supported the entire customer journey, from research to purchase
Based on this year’s performance data, successful partnership programs in 2025 will require brands to take decisive action in four critical areas:
- Early engagement: Brands must activate partnership content by September to capture research-phase shoppers
- Channel optimization: Align partnership types with consumer behavior—using content partners for the research phase and loyalty partners for conversion
- Value communication: Focus on helping partners demonstrate product value rather than just promoting discounts
- Timing strategy: Customize partnership activations by category, recognizing the distinct Black Friday and Cyber Monday shopping patterns
The transformation of Cyber Week from a discount-driven event to a more strategic shopping period requires sophisticated partnership strategies. Successful brands will be those that enable partners to support the entire customer decision journey—from initial research through final purchase.
This data-driven shift in consumer behavior may fundamentally change how holiday shopping decisions are made. Brands that adapt their partnership strategies accordingly will be best positioned to capture value from increasingly discerning customers.
Discover more insights to shape your partnership marketing strategy:


