

Extended shopping seasons promise more sales. The reality? They just redistribute when people buy.
After analyzing both Amazon’s four-day Prime Day 2025 and this year’s Cyber Week, a clear pattern emerged. Longer promotional windows don’t create additional demand—they shift existing demand across more days. And when it comes to Cyber Week 2025, that shift heavily favored Black Friday.
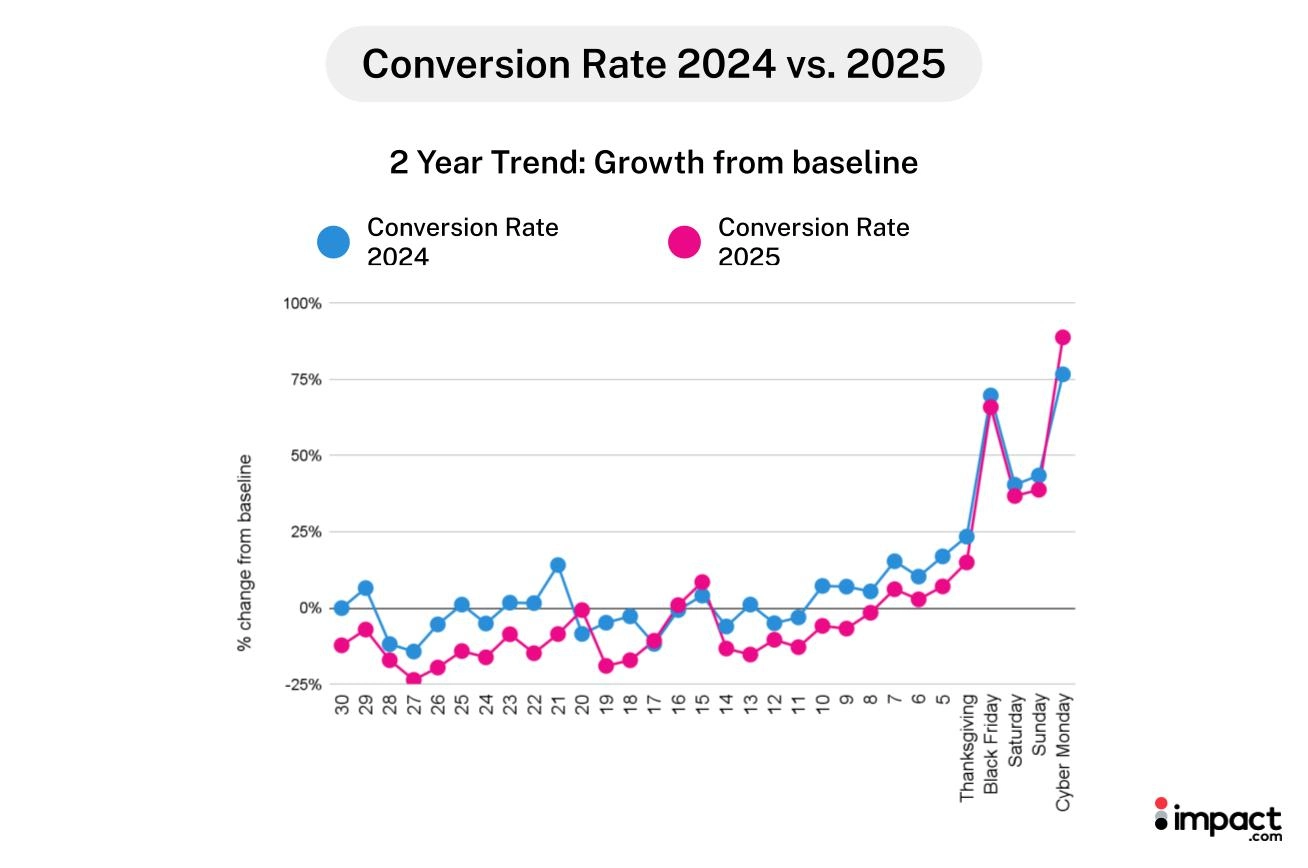
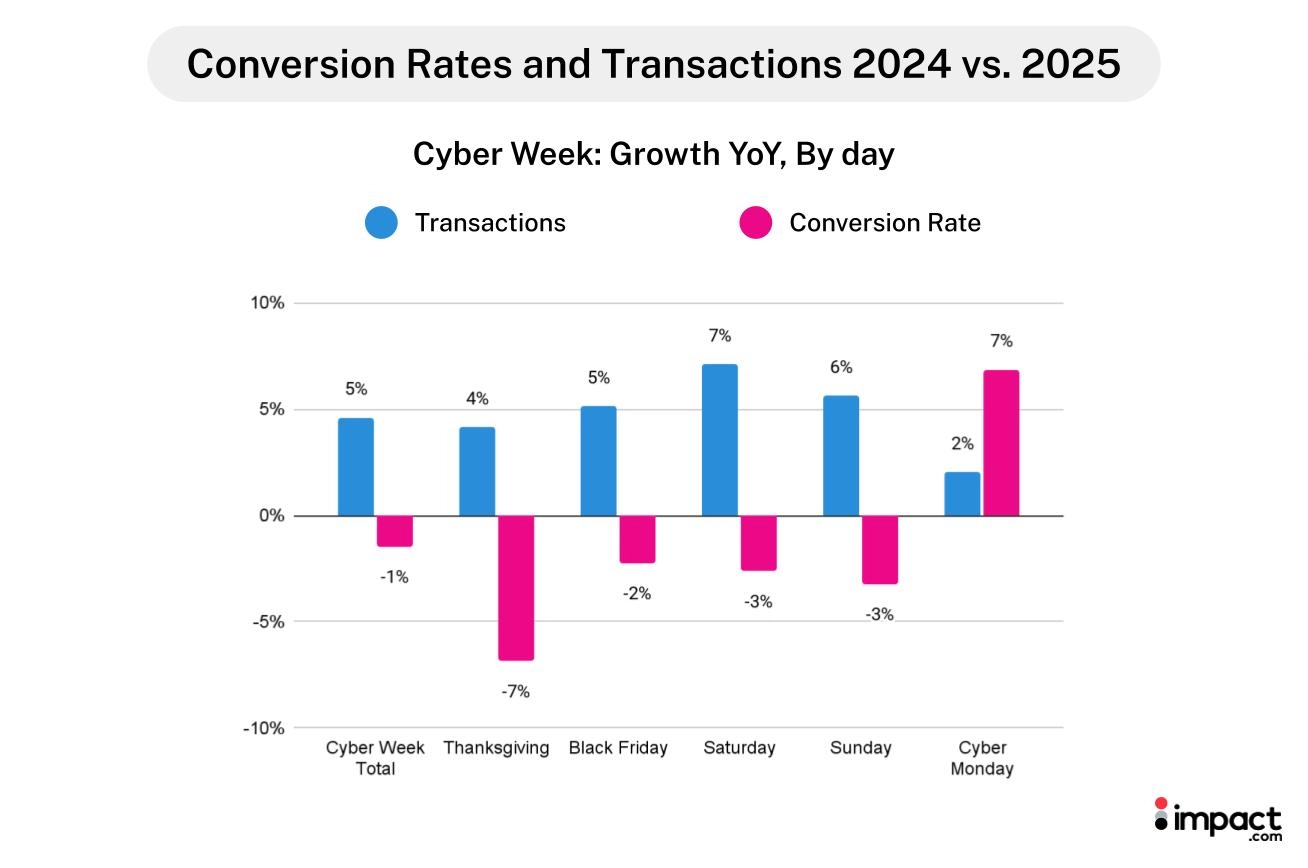
Black Friday captured 31% of total Cyber Week revenue in a single day, with transaction volumes exceeding Cyber Monday by 12%. Meanwhile, Cyber Monday clicks declined 5% year-over-year (YoY), but conversion rates jumped 7% YoY—the highest of any day during Cyber Week. Cyber Monday has transformed from a discovery day into a final-execution day for highly qualified, price-comparison shoppers.
This isn’t just a Cyber Week phenomenon. During Prime Day 2025, when Amazon extended the event from two to four days, we observed the same pattern: total volume increased, but daily performance metrics barely budged. Extended periods spread demand across more days without generating significantly more of it.
Why did this concentration occur? The answer lies in how economic pressure reshaped the purchase journey.
With inflation holding at 3% through September (per the U.S. Bureau of Labor Statistics), consumers entered the 2025 holiday season more disciplined than ever. They didn’t impulse-buy during the early weeks of November—they researched. Our data shows clicks rose 11% YoY during the full analysis period, but conversion rates fell 7% YoY as shoppers spent weeks price-comparing and building wish lists.
By the time Black Friday arrived, shoppers had already decided what to buy. They were ready to execute. Although Black Friday had higher order volumes, Cyber Monday achieved the highest conversion rates. This suggests that shoppers tracked weekend price changes on wishlisted items and held off until Monday, hoping for a stronger discount before committing.
The impact.com team analyzed data from thousands of same-store North American retail brands during the four weeks leading up to and including Cyber Week (November 1 – December 1, 2025) compared to the same period last year. The data reveals how consumers actively adapted to economic pressure—extending their research window, becoming more discerning, then concentrating their purchases when the best deals hit.
- Methodology
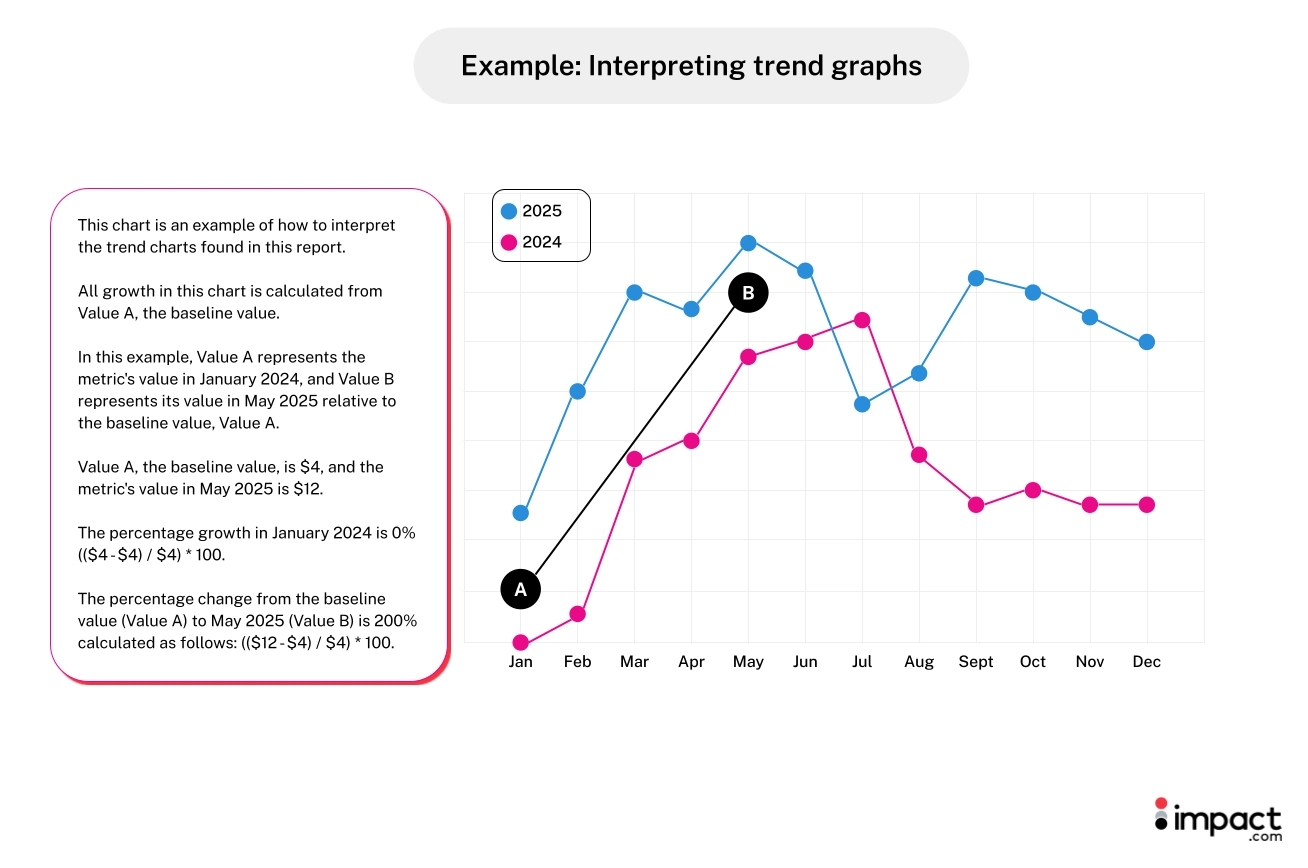
- Interpreting the graphs
- 6 Black Friday and Cyber Monday shopping trends to guide your 2026 sales strategy
- 1. Shoppers stretched their dollars with cheaper items but fuller carts
- 2. Economic pressure extended the buyer’s journey and delayed conversions
- 3. More people relied on creators to validate their decisions
- 4. Tech partners provided buyers clarity and confidence before purchasing
- 5. Brands paid higher commissions to win selective shoppers, but spent less overall
- 6. Consumers prioritized practical purchases over traditional gifts
- Start building a value story that meets rising shopper expectations in 2026
Methodology
The impact.com Cyber Week Research tracked key metrics across 1,078 same-store North American brands in the Retail and Shopping vertical. The study compared brand performance during Cyber Week 2024 and Cyber Week 2025 in a YoY analysis. The analysis was conducted on December 2nd, 2025.
The analysis period covers the four weeks leading up to Thanksgiving and including Cyber Week (November 1 – December 1, 2025). Cyber Week refers to the period from Thanksgiving to Cyber Monday.
While the full Retail and Shopping vertical spans a wide range of sub-categories, this report focuses on the following segments:
- Apparel, Shoes, and Accessories
- Computers and Electronics
- Health and Beauty
- Home and Garden
- Sport, Outdoor, and Fitness
- Flowers, Food, Gifts and Drinks
- Mattresses and Bedding
- Arts and Entertainment
Our analysis tracks key performance metrics, such as average order value (AOV), clicks, transactions, conversion rates, brand, and consumer spending. Researchers tracked these KPIs by comparing same-store data, from brands that actively used the impact.com platform during the analysis periods.
| Glossary | |
| Total brand spending | The sum of action-based (commission payouts) and non-action-based payments (bonuses, paid placement fees, etc). |
| Non-action based payment | Brand expenditure that occurs when brands pay their partners, bonuses, paid placement fees, etc. |
| Action-based [commission] payment | Brand expenditure that occurs when brands pay their partners a commission for a specific, predefined action. |
| Network partners | Publisher platforms that broker access to brand campaigns and provide tracking, reporting, and payment services. This includes publishers categorized as networks, syndication blog networks, or CPA networks. |
| Content review partners | Publishers that produce editorial content to promote, compare, and list products and services. This includes premium publishers, shopping comparisons, financial comparisons, content, bloggers, etc. |
| Loyalty and rewards partners | Publisher platforms that incentivize transactions from consumers, employees, or businesses through a membership or benefits reward program. |
| Voucher and coupon partners | Publishers who aggregate and classify coupons, vouchers and/or discounts for consumer savings. |
| Technology solutions (Commerce Solutions) | Innovative technological solutions that enhance the customer experience and drive conversions through various touchpoints, such as banking integrations, post-checkout offers, retargeting tools, or embedded software solutions |
| Media arbitrage | Search engine, social, or programmatic marketers that manage keyword campaigns for brands, often on a performance basis. |
| Cross-audience monetization | Businesses that publish offers, content, and complementary (non-competing) products to current customers or audiences (e.g., exit traffic, improved UX) to drive incremental revenue. |
| Analysis period | The 30-day period leading up to and including Cyber Monday:2024: November 2 – December 22025: November 1 – December 1 |
| Cyber Week | Cyber Week refers to the period from Thanksgiving to Cyber Monday. |
Interpreting the trend graphs
6 Black Friday and Cyber Monday shopping trends to guide your 2026 sales strategy
Cyber Week 2025 made one thing clear: today’s shoppers are disciplined, deliberate, and laser-focused on value. These trends show how consumers shopped this year and how brands can adapt their strategies for a successful 2026 Cyber Week.
1. Shoppers stretched their dollars with cheaper items but fuller carts
Many consumers went into Cyber Week determined to make every dollar count. Instead of cutting back on their overall spending, they opted for lower-priced items while adding more to their carts.
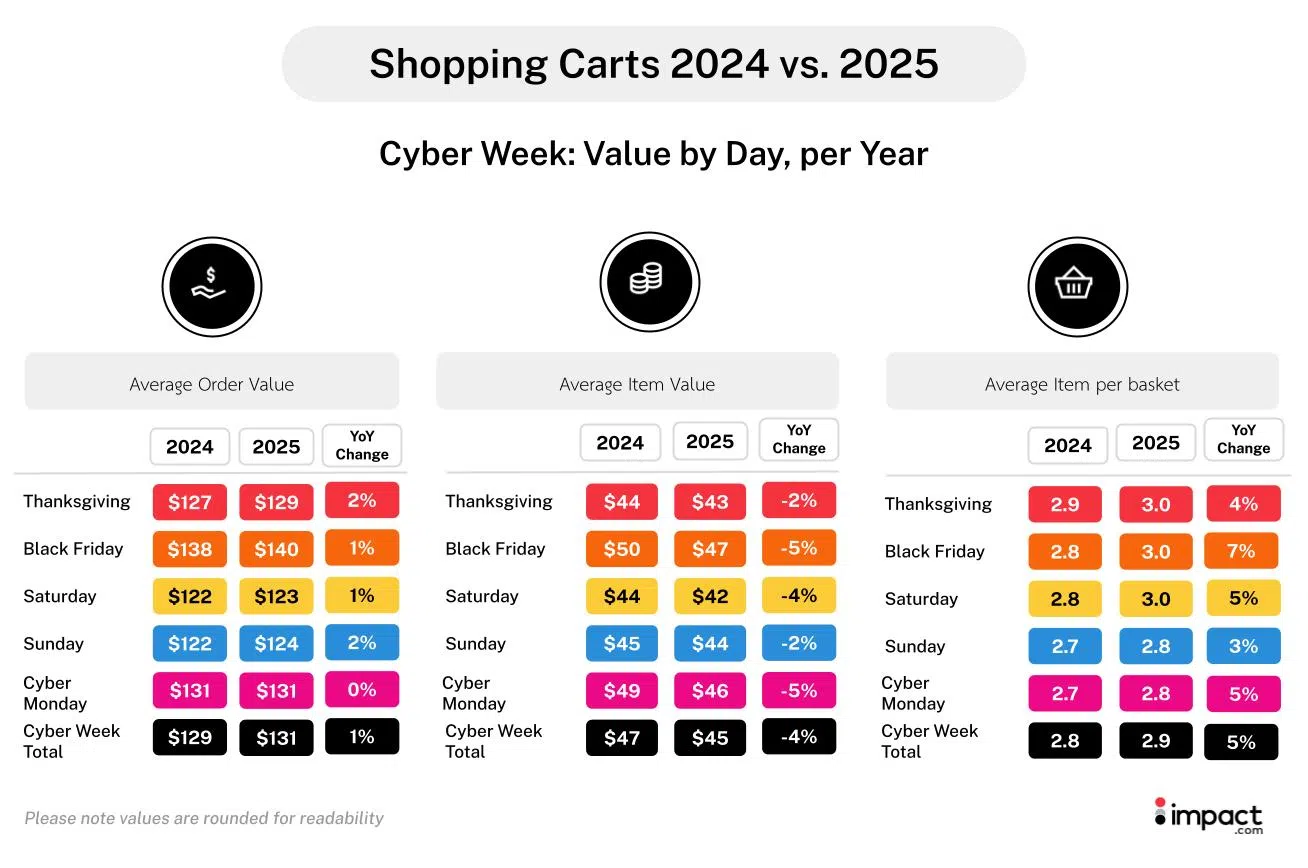
Shoppers traded down to lower-priced items during Cyber Week, with Average Item Value (AIV) dropping 4% YoY from $47 to $45.
Surprisingly, shoppers didn’t scale back on their orders. Basket sizes grew 5%, likely boosted by affordable add-ons that helped them hit free shipping thresholds or qualify for volume-based discounts. As a result, Average Order Value (AOV) rose 1%.
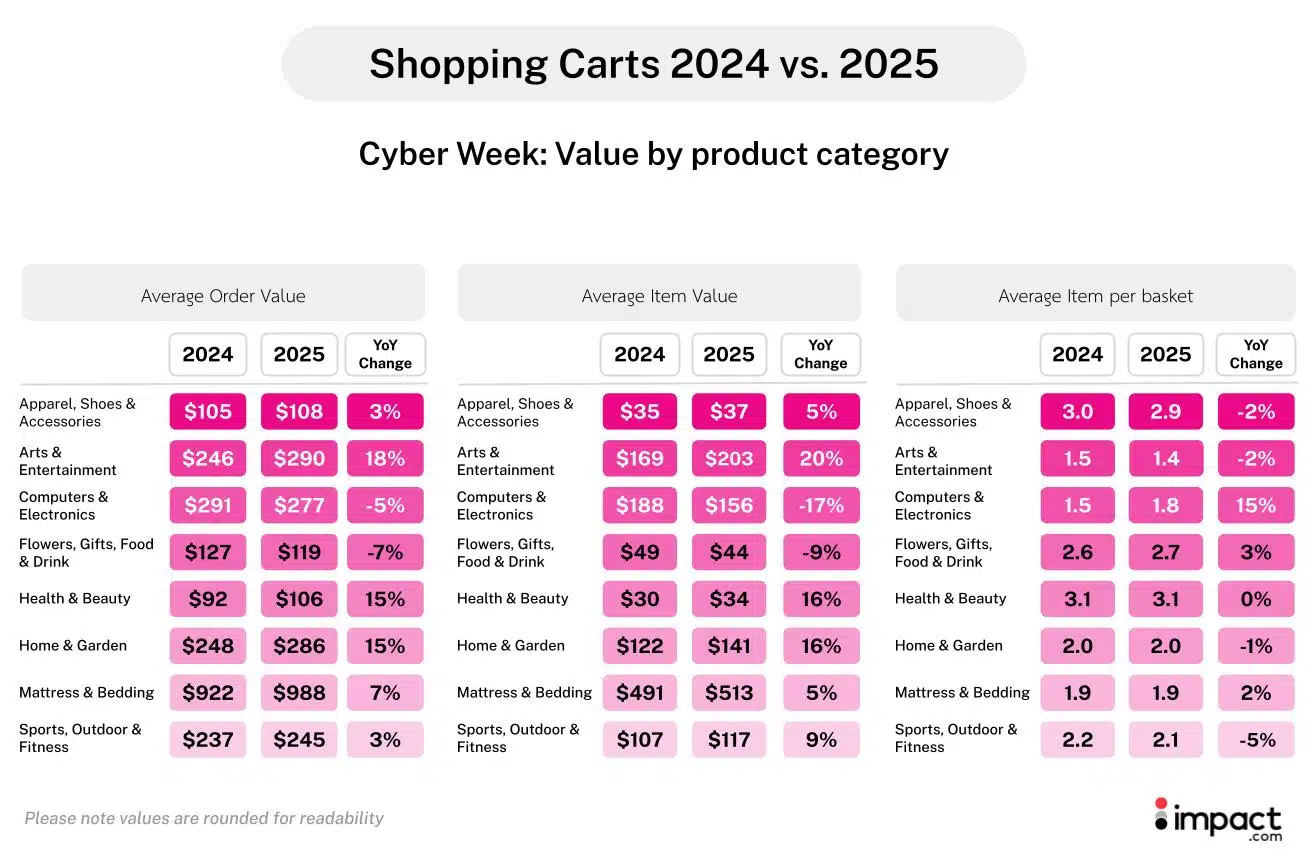
This trend was most apparent in Computers & Electronics. The average AIV fell 17% and shoppers purchased significantly more units—a 15% increase per order YoY. However, because consumers gravitated toward lower-cost products, the increase in items per order didn’t offset the decrease in average item price. This resulted in the category’s 5% decline in AOV from last year.
This shift suggests shoppers were motivated by strong deals on tech essentials and budget-friendly models, favoring lower-priced items over high-ticket upgrades.
What brands can do: Create offers that help shoppers stretch value
Brands can help this budget-minded shopper by making it easy to build a smarter cart:
- Design smart offers: Bundles, mix-and-match discounts, and free-shipping thresholds encourage shoppers to add lower-priced items without feeling like they’re overspending.
- Use partnerships to amplify this strategy: creators and content partners can show how products fit together, spotlight savings, and recommend practical add-ons.
- Clearly display how much is left to unlock free shipping: According to our 2025 Black Friday consumer insights research, free shipping is the top deal people look for, making it one of the strongest motivators for adding items to a cart.
2. Economic pressure extended the buyer’s journey and delayed conversions
McKinsey & Company data found that concerns about the cost of living and job security grew this quarter, with nearly half citing inflation among their top three concerns.
This measured approach to spending didn’t reduce overall demand, but it did reshape the path to purchase. Many shoppers spent more time comparing prices, checking deal timing, and validating value before buying.
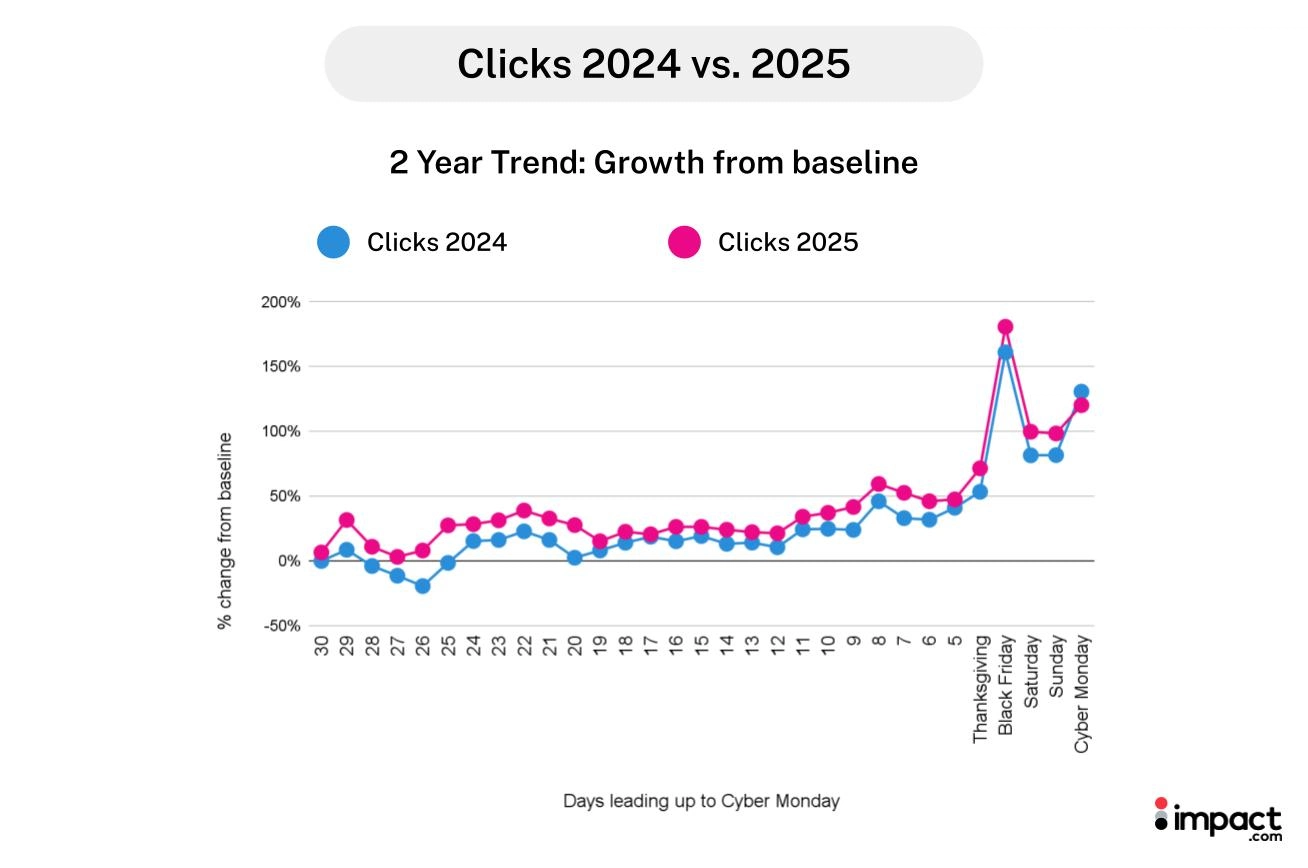
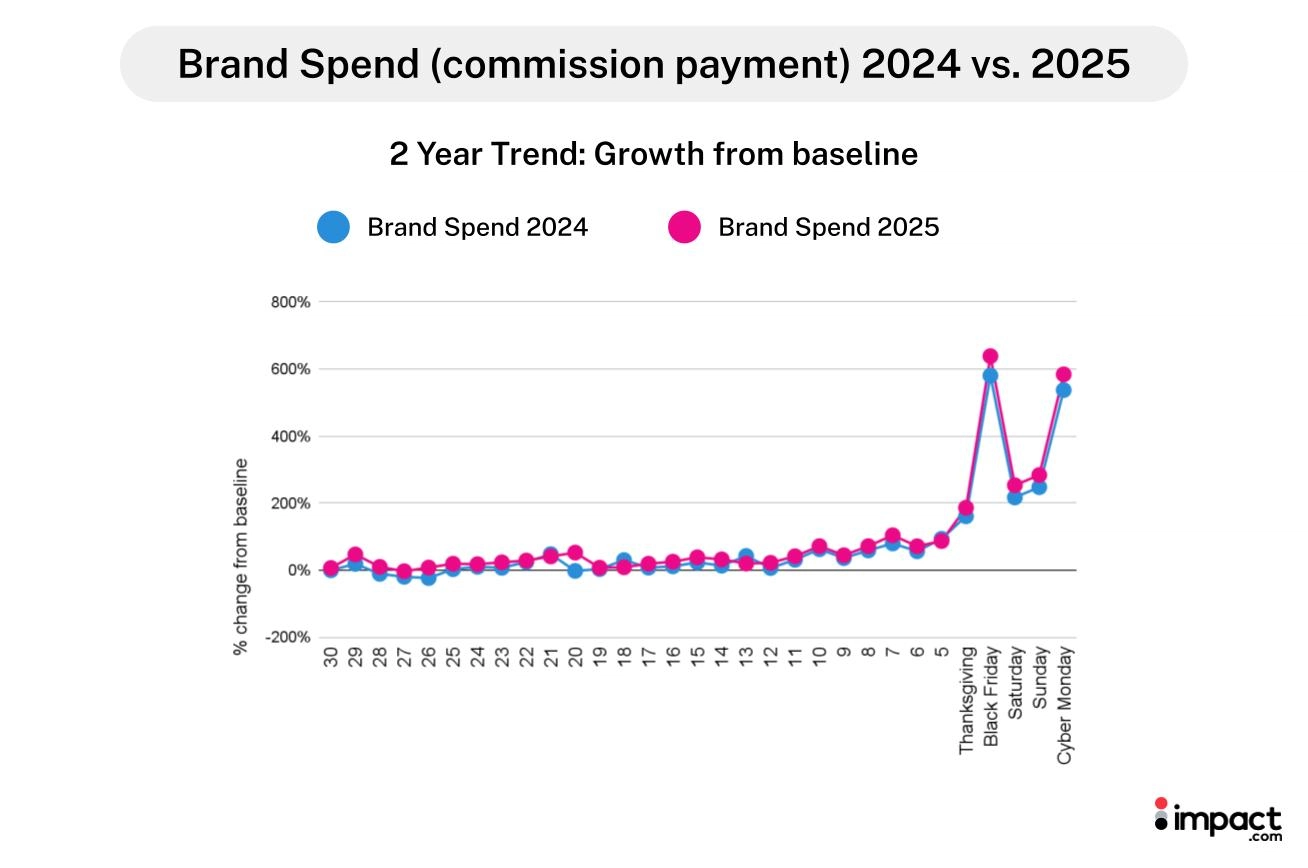
Click activity reflected this extended decision cycle. Clicks rose 11% YoY across the full analysis period, outpacing the 6% YoY click growth observed during Cyber Week. Thanksgiving saw an additional 12% increase in clicks, and the weekend (Saturday +10%, Sunday +9%) saw strong YoY growth too.
Despite the shift to earlier browsing, Black Friday still had the highest click volume, growing 8% YoY as consumers executed on their planned purchases. This was the culmination of weeks of research compressed into a single buying moment.

However, this surge in browsing didn’t translate into immediate purchases. While click volumes grew 11% YoY during the analysis period, conversion rates decreased 7% over this same period. As a result, the transaction growth was modest, increasing 3% YoY, as the initial interest (clicks) did not immediately translate into sales.
This research-heavy behavior explains the Black Friday revenue concentration we observed. Shoppers weren’t discovering products on Black Friday—they were executing on decisions made weeks earlier. By the time deals launched, they knew exactly what to buy.
The pattern continued through Cyber Monday. Although Cyber Monday conversion rates jumped 7% YoY—suggesting highly purchase-ready shoppers—total clicks fell 5%, resulting in the day capturing just 26% of Cyber Week revenue compared to Black Friday’s 31%. This behavior could signal that shoppers were watching prices over the weekend, waiting until Monday in hopes that a better discount might appear.
What brands can do: Win the research phase, then dominate Black Friday
Extended shopping windows have fundamentally changed the path to purchase—but not in the way most brands think. Rather than creating more demand, they redistribute it.
The brands that succeed are those who win the November research battle, then capitalize when shoppers execute on Black Friday.
Phase 1: Win the research window (Weeks 1-3)
- Activate educational partners early: Deploy creators, content publishers, and review platforms in early November when consumers start doing research but conversion intent is low
- Build product consideration, not conversion: Focus on comparison content, use cases, and validation rather than aggressive promotional messaging
- Track consideration signals: Monitor click patterns and engagement to identify which products are entering consumer research lists
Phase 2: Concentrate firepower on Black Friday
- Reserve your strongest deals for Black Friday: Our data shows this single day captured 31% of total Cyber Week revenue—don’t dilute this with early discounting
- Front-load promotional visibility, not costs: Invest in prominent partner placements and early-access programs to capture Black Friday traffic, but recognize that higher commission rates won’t drive incremental volume when buyers have already decided to purchase.
- Focus on operational excellence: With the highest transaction volumes of the week, Black Friday success depends on flawless execution—site performance, inventory availability, and checkout experience—more than elevated partner incentives.
Phase 3: Reconsider Cyber Monday strategy
- Target highly-qualified buyers: Cyber Monday saw 7% higher conversion rates YoY but 5% lower clicks YoY—these are shoppers who missed Black Friday or need final validation
- Leverage FOMO urgency: “Last chance for Cyber Week pricing” messaging capitalizes on the deadline effect. Higher partner incentives paired with urgency messaging maximize purchases among shoppers who’ve been monitoring deals all weekend.
- Increase commission rates to win comparison shoppers: Cyber Monday conversion rates were higher than those on Black Friday, indicating highly qualified buyers deciding between retailers. Strategic commission increases (2025 data shows brands raised commission rates by 11% on Cyber Monday vs Black Friday) can be the differentiator that captures these high-intent, price-sensitive shoppers.
3. More people relied on creators to validate their decisions
As shoppers became more selective and value-conscious this year, they increasingly relied on trusted partners to help them decide what was truly worth buying. Creators stepped into that role in a meaningful way, becoming a key part of how consumers evaluated products and navigated their options.
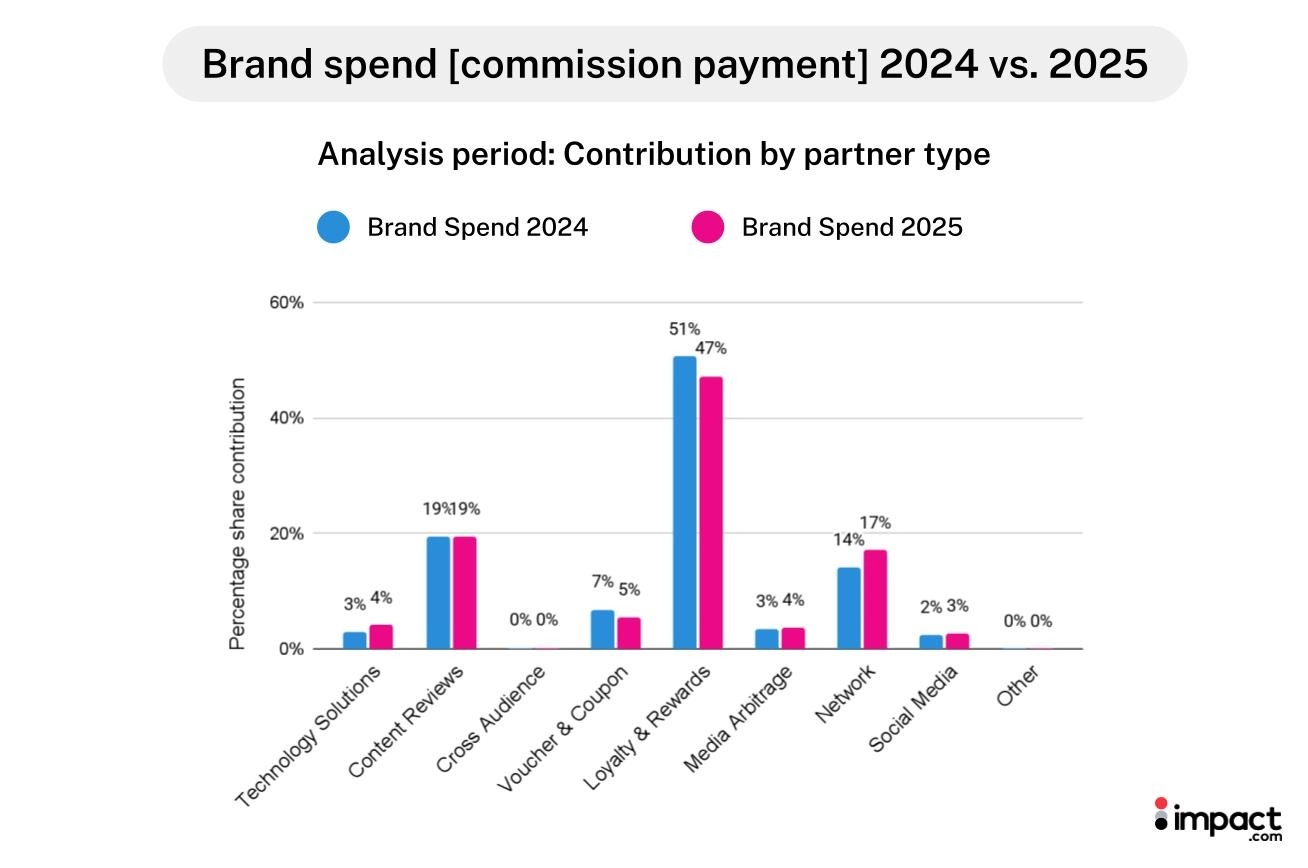
Influencers drove significantly more engagement during the analysis period, increasing their share of total clicks from 5% to 8% YoY.
This lift reflects a shift in how consumers approached pre-purchase research—seeking authentic recommendations, product walkthroughs, and practical guidance rather than relying solely on traditional search or promotional placements.
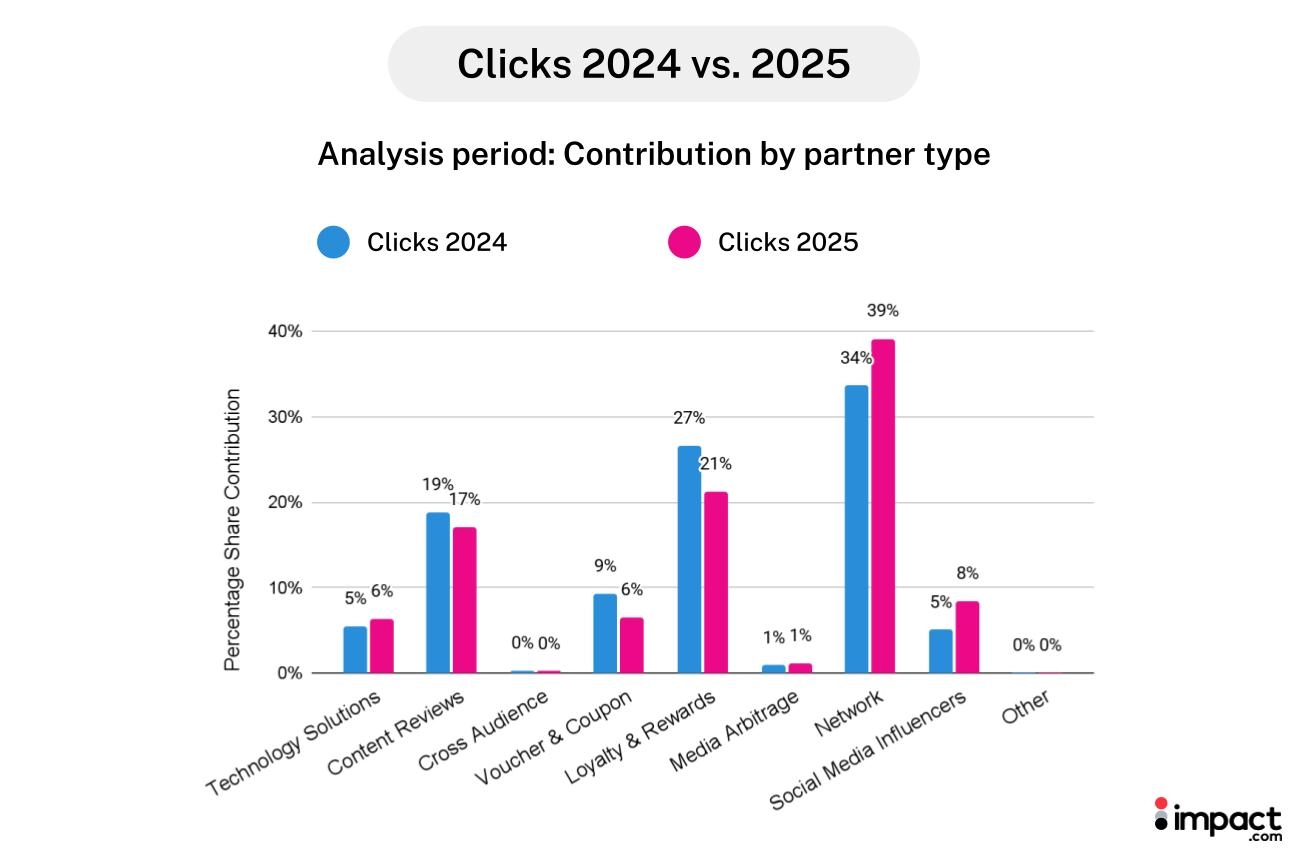
And when shoppers were finally ready to buy, creators helped tip the scales. Creators’ contributions to total transactions during the analysis period nearly doubled from 5% to 9% YoY.
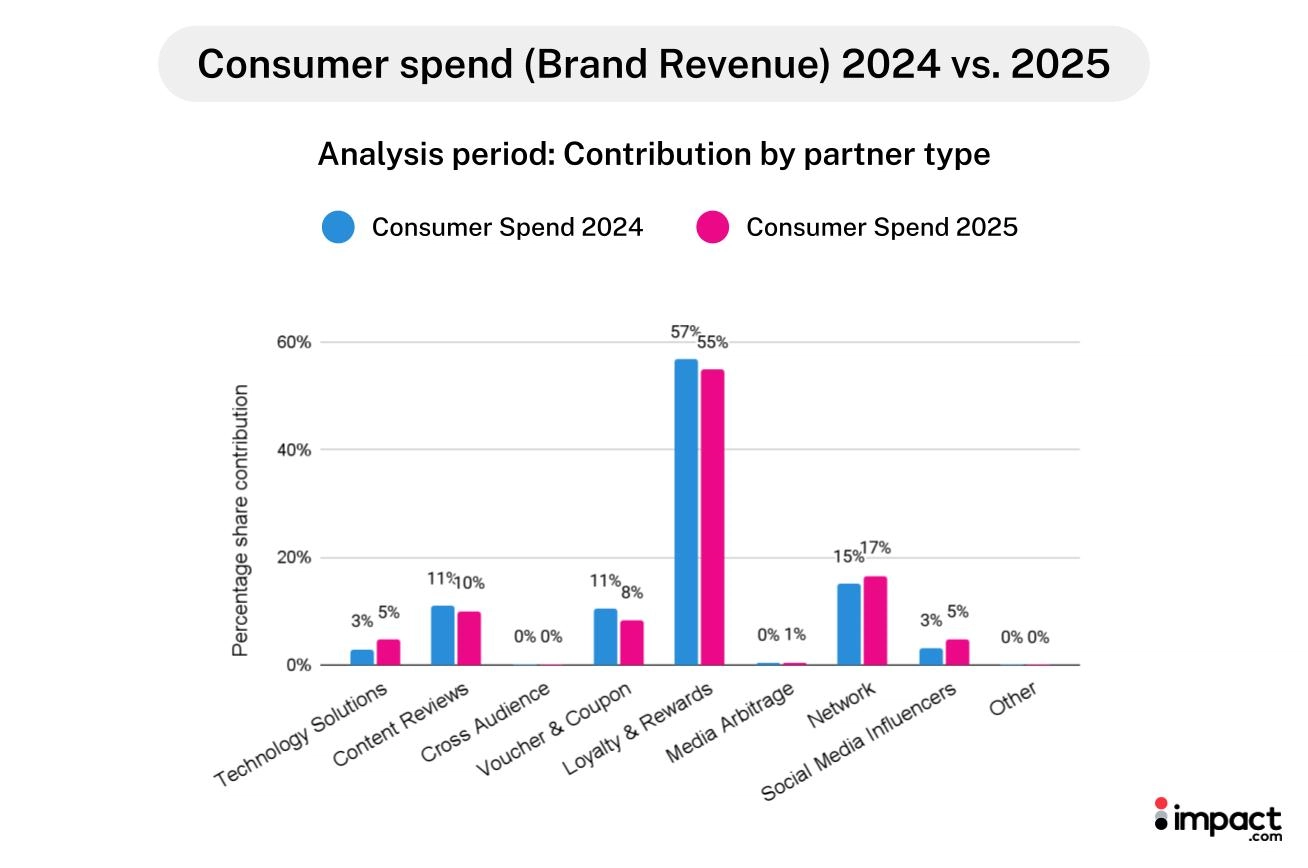
This pattern was reinforced by the efficiency of creator-led sales throughout Cyber Week. While influencer-driven consumer spending grew 51% YoY, commission payouts increased only 1% YoY, making creators one of the most cost-effective partnerships for brands during Cyber Week, the most competitive season for many brands.
It’s possible that creators’ ability to explain why a product’s value, how to use it, and which accessories to pair with it resonated strongly with 2025’s discerning shoppers.
What brands can do: Invest in creator partnerships to make value clearer
In 2025, the influence of creators extended beyond discovery, becoming an essential part of how shoppers determined if a product was truly worth buying. Brands can meet this need by:
- Using creators for educational content: Recruit creators who can demonstrate how products work, compare options, or explain who each item is best for.
- Equipping creators with bundles and kits: Incentivize creators to highlight ready-made bundles, starter sets, or add-on kits in their content.
- Building a full-funnel creator mix: Create an influencer portfolio that features large creators for discovery, mid-tier creators for product evaluation, and niche or deal-focused creators to validate pricing during peak moments.
4. Tech partners provided buyers clarity and confidence before purchasing
This year, the path from browsing to buying became more complex. Yet even after researching products, comparing prices, and weighing alternatives, many consumers still needed more confidence that they were making the right choice.
Technology Solutions—which includes tools like review aggregators, comparison engines, financing options, and dynamic recommendation modules—increasingly gave shoppers that assurance. These partners saw a 79% YoY increase in transaction volume and a 40% YoY improvement in conversion rates during the analysis period, ultimately doubling their share of total orders to 4%.
This indicates that when shoppers hesitated, these tools surfaced price histories, highlighted savings, and delivered side-by-side comparisons that made purchase decisions feel clearer and lower-risk.
What brands can do: Give shoppers the clarity they need to feel confident buying
Shoppers needed more reassurance this year, especially when evaluating whether a deal or product was truly worth it. Brands can reduce hesitation by:
- Make comparison shopping effortless: Use in-house or partner tools that let people easily compare options, features, and prices so they can identify the right fit.
- Surface trust signals early: Feature reviews, ratings, expert commentary, or creator-driven testimonials prominently at key decision points to help shoppers validate quality without extra research.
- Show savings clearly: Use transparent pricing cues—like price history, savings callouts, or deal timing—to make the value unmistakable.
5. Brands paid higher commissions to win selective shoppers, but spent less overall
Even with overall consumer spending rising during Cyber Week, shoppers’ deliberate decision-making created more friction in the path to purchase—requiring brands to offer stronger incentives to secure sales.
The data reflected this dynamic, with commission payout growth outpacing revenue growth for the Retail and Shopping vertical.
During Cyber Week, consumer spending increased 6% YoY, but commission payouts grew 9%, raising effective commission rates by 3% YoY. Similar patterns appeared across the full analysis period, where commission payouts again grew 9% YoY despite consumer spending increasing only 2% YoY.
On a commission-only basis, brands were paying more for each conversion—not only because shoppers required more validation before purchasing, but also because commission payouts rose in response to both higher transaction volume.

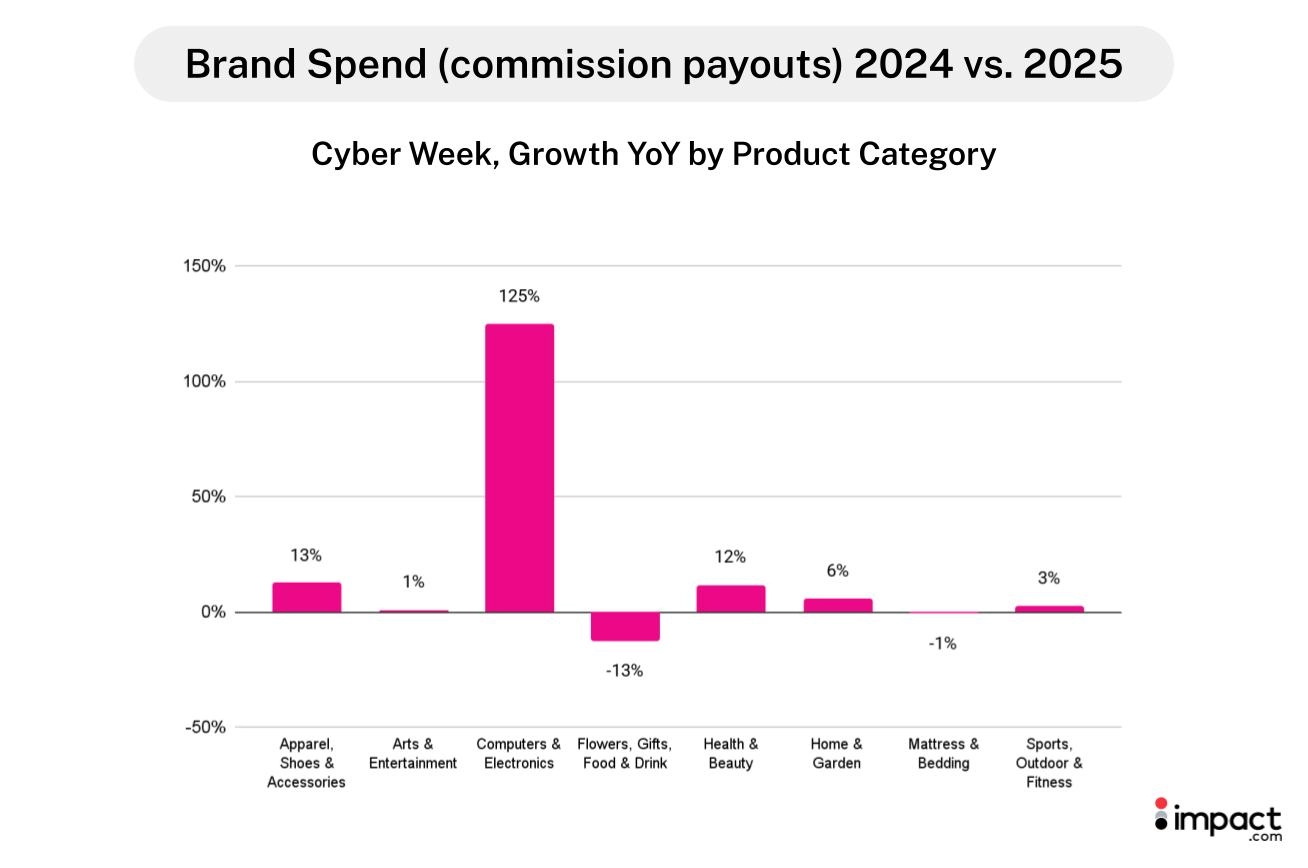
The Computers and Electronics category illustrates how this shift played out. Commission payouts rose 125% YoY during Cyber Week, driven by a 41% YoY increase in orders and higher commission rates to partners—likely due to competitive bidding among brands.
Despite consumer spending in this subvertical rising 35% YoY, the cost of securing that growth increased much faster. This suggests that brands strategically raised commission rates to capture volume in a crowded category.
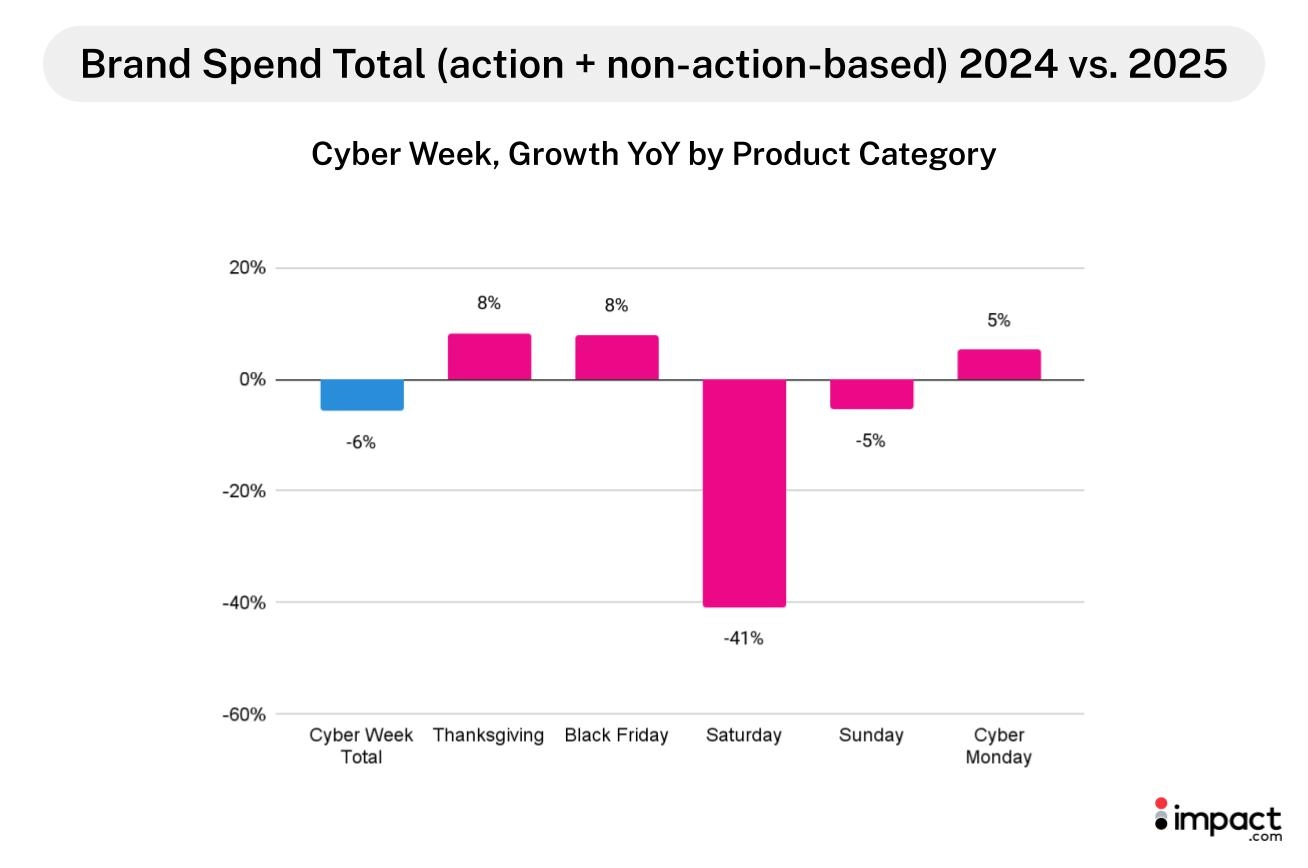
But commission payouts don’t tell the whole story. Total brand spend—which is commissions plus non-performance-based payments such as bonuses and placement fees—actually decreased 3% YoY across the full analysis period and 6% YoY during Cyber Week. This decline was driven by a reduction in non-action payments, which outweighed the rise in commission payouts.
In other words, brands weren’t operating at a loss—they were structuring their spending more efficiently, paying primarily for results and performance-driven outcomes.
What brands can do: Adapt commission strategies to today’s selective shopper
As shoppers make more deliberate decisions, brands need commission structures that reflect true partner impact—not just last-click outcomes. Brands can do this by:
- Use tiered commission models for upper-funnel partners: Offer lower base rates for awareness-driving partners and increase commission rates when they generate qualified traffic or assist in conversions.
- Introduce bonus structures for high-impact actions: Reward partners for behaviors that reduce hesitation—such as driving product-page views, high-engagement clicks, or multi-touch assisted conversions.
- Apply dynamic commission rates during peak periods: Temporarily raise rates for strategic partners—content, review, loyalty, or deal sites—when competition spikes or when you need to capture share in priority categories.
6. Consumers prioritized practical purchases over traditional gifting categories
Many consumers approached Cyber Week with a sharper focus on practicality this year. Instead of spending broadly on perishable traditional gifts, shoppers prioritized items that were essential and utility-driven.
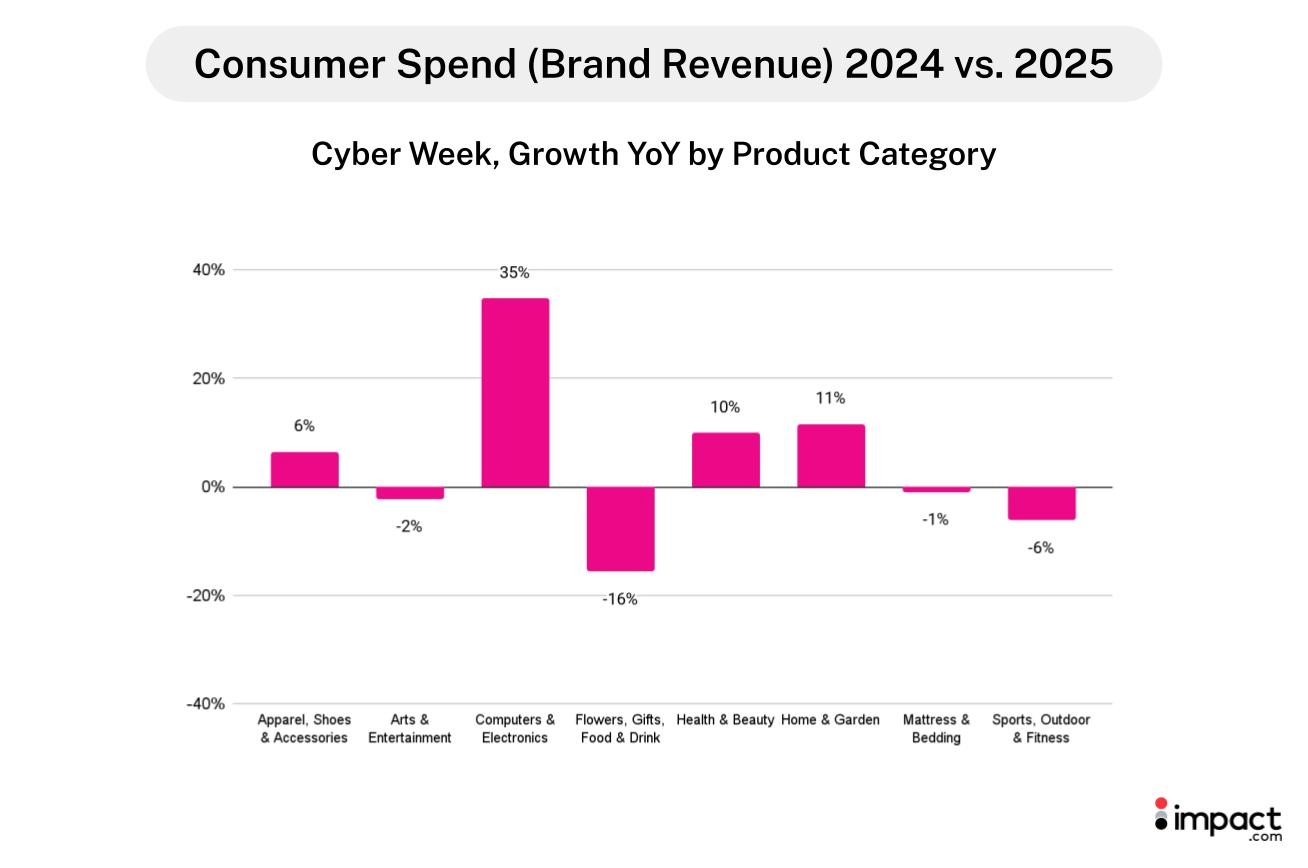
The categories that saw some of the strongest gains included:
- Computers and Electronics: Spending during Cyber Week rose 35% YoY, fueled by a 41% YoY increase in orders as shoppers took advantage of lower prices and likely traded down to more affordable tech.
- Health and Beauty (+10% YoY) and Home and Garden (+11% YoY): These categories exceeded overall Retail and Shopping vertical consumer spending performance (+6% YoY) during Cyber Week, reflecting continued investment in practical, durable items—from everyday self-care essentials to home improvement products.
Traditional gifting categories moved in the opposite direction. For example, consumer spend on Flowers, Gifts, Food, and Drink declined 16% YoY, with drops in transactions (-10% YoY), conversion rates (-16% YoY), and AOV (-7% YoY).
These products—often purchased as perishable or short-lived gifts—were among the areas where shoppers scaled back, reinforcing a shift toward longer-lasting purchases during Cyber Week.
What brands can do: Position products around personal value and everyday utility
As shoppers shift toward more useful, long-lasting purchases, brands can respond by:
- Reframing holiday merchandising around everyday value: Highlight “durable upgrades” or “essentials that last,” rather than relying solely on traditional gifting themes.
- Using shopper behavior to recommend what’s most useful: Let browsing patterns and price sensitivity guide which practical, long-lasting products you spotlight in place of short-lived gift items.
- Giving partners clear ways to talk about real value: Share simple messaging—like durability, cost-per-use, or why it’s a smart alternative—to help partners connect with value-focused shoppers.
Start building a value story that meets rising shopper expectations in 2026
Consumers proved this year that value goes beyond price. They want clarity, confidence, and a clear reason to choose one product over another before spending. Now is the time for brands to step back and assess whether their current experiences, partnerships, and messaging actually help shoppers make informed choices in an increasingly selective environment.
Looking ahead to 2026, brands should focus on strengthening the signals that matter most:
transparent pricing, decision-support tools, and partner content that validates why a purchase is worth it. Those who invest early in building a cohesive, value-led experience across the entire journey will be in the strongest position to convert cautious shoppers when next year’s peak season arrives.
Start thinking about how to build your narrative for 2026 with these resources:
- Moving beyond awareness: How creators drive conversions through social commerce and affiliate programs (blog)
- Social commerce and influencer marketing: 5 proven strategies to drive sales across platforms (blog)
- How modern marketers can boost campaign effectiveness with performance marketing attribution (blog)