Business boomed over the last holiday season, with many industries recovering or improving after two years of unpredictability. Heading toward the summer, companies face fewer COVID-19-related restrictions than ever. As more in-person events open up and travel trends return, it might feel like a “new normal.”
However, the path ahead for many brands remains uncertain. Rising inflation rates just reached a 41-year high. Consumer habits shifted over the past few years — more than 40 percent of U.S. consumers plan to spend more carefully going forward.
For affiliate marketing, tracking recent benchmarks offer insights into ongoing trends. Affiliate metrics play a key role in future decisions to help optimize your business and better inform your partners. The data scientists at impact.com have tracked consumer purchasing behavior from the start of 2020 until now, zeroing in on key metrics: clicks, conversions, conversion rates, average order value (AOV), revenues, and commissions.
Use these January to April 2022 benchmark reports to gain a vital overview of partnership performance and help spot trends and calibrate your upcoming plans accordingly.
Where partnerships currently stand
Conversions dropped, and clicks stayed steady
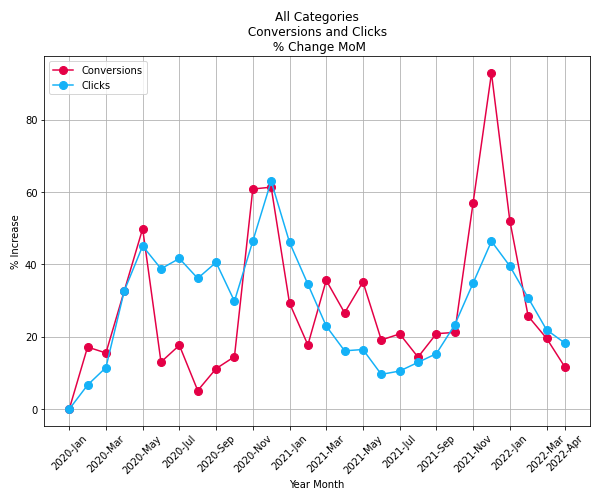
Both conversions and clicks dipped after the end of 2021 — struggling as shopping frequency declined. In fact, conversions reached higher over the holiday season than in 2020 or 2021 before dropping quickly. Compared to Q1 2021, conversions dropped almost 20 percentage points below last year (and 25 points lower than 2020).
Over the last three months, clicks also went down. Fitting with previous year’s trends clicks mirror Q1 of 2021 exactly. Click rates in 2020 still stand at a high point in the last three years.
Average order value climbed while conversion rates struggled
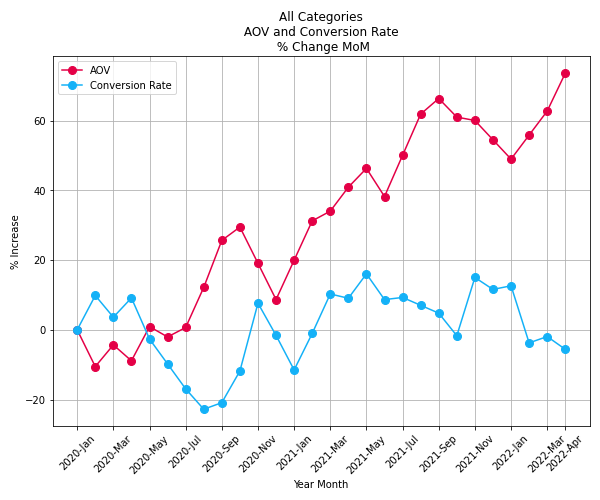
AOV remained high, increasing by more than 70 percent from the baseline in spring 2020. During Q1 of this year, AOV improved by approximately 20 percentage points.
Price increases and a shift in shopping patterns forced consumer basket values to rise. Consumers kept buying more in one shopping trip but less frequently. While AOV stayed higher than Q1 2020 or 2021, conversion rates remained below the original baseline.
Revenues and commissions both showed slight improvement
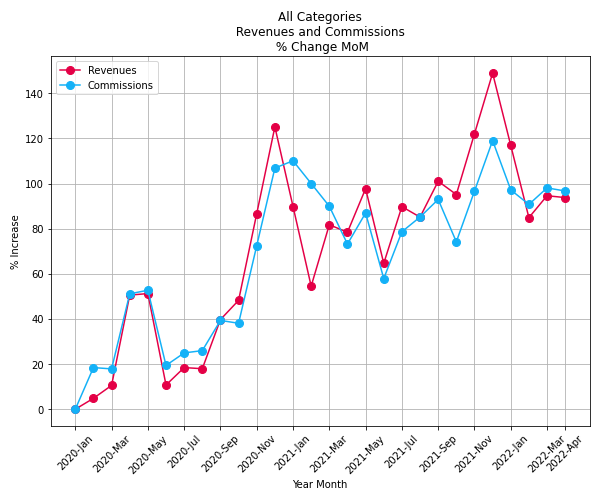
Revenues and commissions peaked in December 2021, increasing 150 percent from the start of 2020. After a two-month decline, revenues and commissions stabilized in March and April 2022. These metrics currently stand approximately 100 percentage points higher than baseline.
Compared to last year, revenues and commissions sit 10 percent higher. As you might expect, these metrics dropped since the holiday season. However, revenues and commissions currently blow 2020’s first quarter out of the water. Thankfully, they both seem to trend upwards over the last three years.
Partnerships keep bouncing back
Even with changing spending habits and increasing inflation, partnerships show
flexibility and resilience. While conversions and conversion rates faltered, other metrics matched or exceeded previous tracked data points.
The methodology behind the report
This benchmark report features month-over-month (MoM) tracking on seven different verticals. Changes in online shopping, impacts from COVID-19, and other events all influenced these partnership results.
Overall report timeline
The data analysis extends from the start of 2020 through to April 2022 and offers a key snapshot of U.S. consumer behavior. Due to COVID-19’s impact on how shopping and spending occurred during this period, a general timeline provides useful context:
- On March 11, 2020, the World Health Organization (WHO) announced COVID-19 as a global pandemic.
- In March 2020, U.S. states declared stay-at-home orders.
- In summer 2020, the United States surpassed 6 million COVID-19 cases. Some states saw less than 1 percent infection rates and reopened indoor dining.
- In October 2020, infection rates rapidly increased, confirmed cases hit new daily records, and a much-feared “second wave” began.
- In November 2020, during a crucial U.S. presidential election, Black Friday kicked off the holiday shopping season.
- In December 2020, cases and deaths continued to set new records. During this time, the administration of the first doses of newly approved COVID-19 vaccines took place.
- In spring 2021, vaccines became readily available to all Americans over the age of 16.
- In May 2021, infections hit their lowest level since June 2020, 57 percent of U.S. adults received at least one vaccine shot, and the vaccine became available to children ages 12–15.
- In June 2021, many consumers resumed vacation plans, and states lifted travel restrictions.
- In July 2021, the highly contagious Delta variant contributed to surging cases.
- In August 2021, hospitalizations reached their highest point in eight months.
- In September 2021, schools welcomed students back to the classroom.
- In October 2021, many industries grappled with supply chain disruptions and labor shortages.
- In November 2021, on Black Friday, the WHO officially described Omicron as a variant of concern.
- In December 2021, the first case of the Omicron variant was found in the United States. The total number of cases of COVID-19 reported throughout the country reached 48 million.
- Throughout February and March of 2022, several states eliminated mask mandates.
- In April 2022, the U.S. Centers for Disease Control dropped all countries from its highest risk COVID-19 category.
During this time, data scientists at impact.com gathered information from the same cohort of brands to remain consistent each week. A collection of pre-pandemic campaigns established a baseline for each vertical. Changes register as metrics increase or decrease against a baseline of zero. Running a statistical analysis to determine which companies to include in each category allows impact.com to identify and remove unhelpful outliers.
Apparel, shoes, and accessories
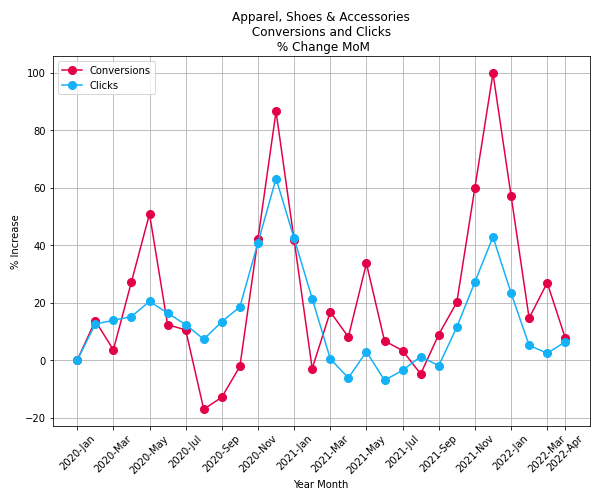
For brands in the apparel, shoes, and accessories vertical, conversions saw a steep drop from the holiday season until February 2022. Conversions hit their three-year peak in December 2021, resulting in this expected decline. By April 2022, conversions fell further to match 2021’s numbers — both falling short of a 40 percent spike in April 2020.
By the end of Q1 2022, clicks stabilized around five percent above the original baseline. In comparison, April 2021 sank below baseline while April 2020 showed 20 percentage points of growth.
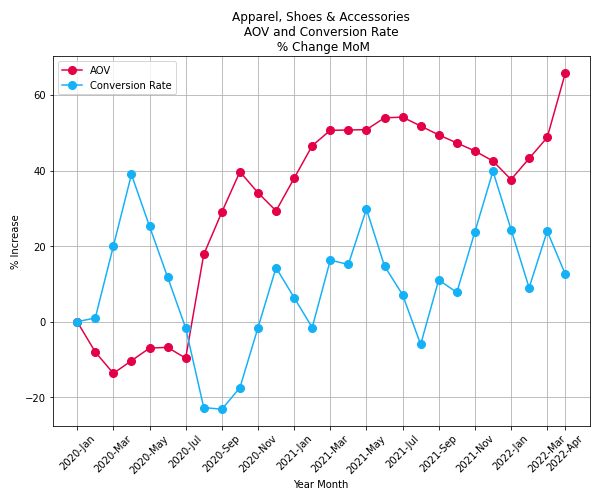
The average order value for apparel, shoes, and accessories increased by more than 25 percentage points from January to April 2022, reaching 65 percent above baseline at its peak.
After an unpredictable up-and-down path, conversion rates dropped from 40 percent above baseline in December 2021 to approximately 15 percent by the end of Q1.
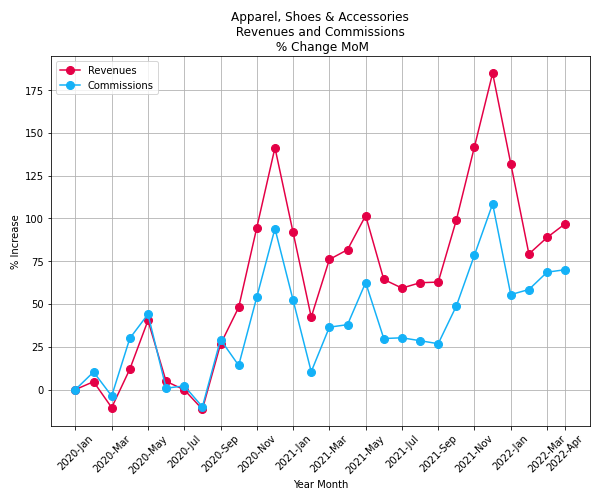
After an impressive performance over the holidays, revenues declined in January 2022. However, the low point in February still sat 30 points higher than February 2021. Revenues increased from February to April 2022, eventually hitting close to 100 percent above baseline.
Throughout 2022, commissions steadily grew to almost 75 percent above baseline — the highest point this year. The numbers are trending upward — the first quarters of 2021 and 2022 leave 2020’s metrics in the dust.
Arts and entertainment
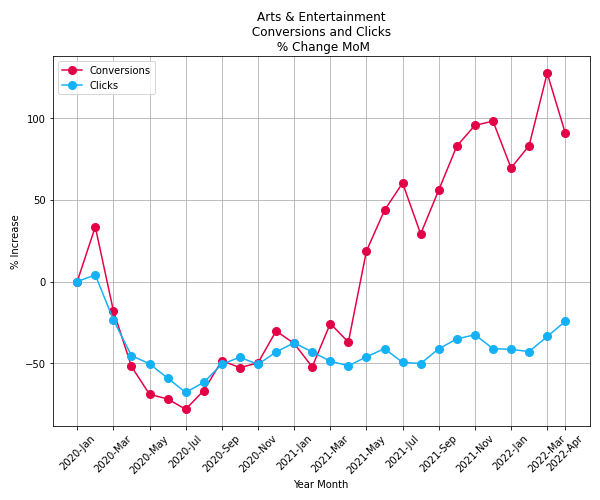
Conversions skyrocketed in Q1 2022, reaching 125 percent above the original baseline at the start of 2020. After a spike in March 2022, April brought a return to the same benchmark as September of last year. However, compared to both previous first quarters, 2022 shows significant improvement over the last three years.
Clicks brought less excitement to the table. While remaining below baseline, clicks reached their highest point since March 2020, hitting minus 25 percent in April 2022.
As COVID-19 restrictions lightened and mask mandates lifted earlier this year, the arts and entertainment vertical saw improved growth overall. The slight decline in conversions from March 2022 could be due to increasing COVID-19 infection rates in mid-April.
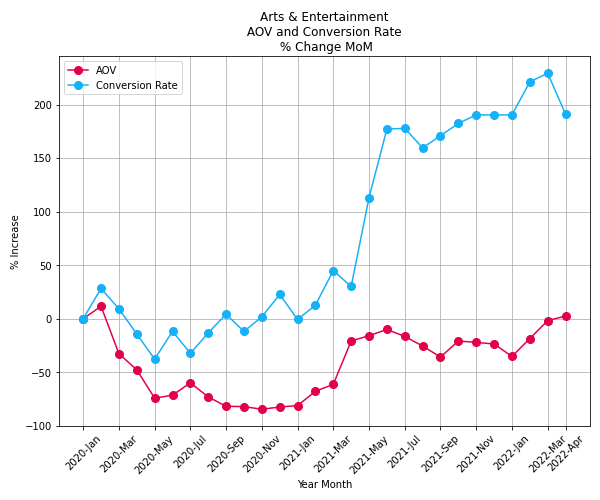
Average order value experienced a difficult journey over the past three years. This metric increased steadily throughout the first few months of this year and exceeded the baseline for the first time since February 2020.
Conversion rates increased during Q1 of 2022, peaking in March with 200 percentage points above baseline. As more people attended events and spent money on entertainment, this metric saw noticeable growth over the past two Q1s. Like conversions, conversion rates also lowered from March 2022 to April — ending at 190 percent above baseline.
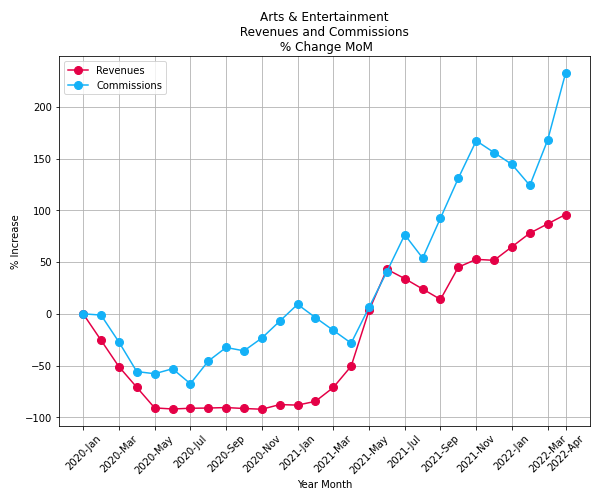
In April 2022, revenues reached their highest point since this analysis started. After a slight drop from November of last year, revenues began a steady upward climb in February. Currently, this metric sits at almost 250 percent above pre-pandemic levels.
Compared to the last few years, commissions also saw impressive growth, increasing approximately 200 points above their lowest dip in May 2020. With movie theaters and live events going back to full capacity in many places, revenues and commissions found much-needed relief.
Computers and electronics
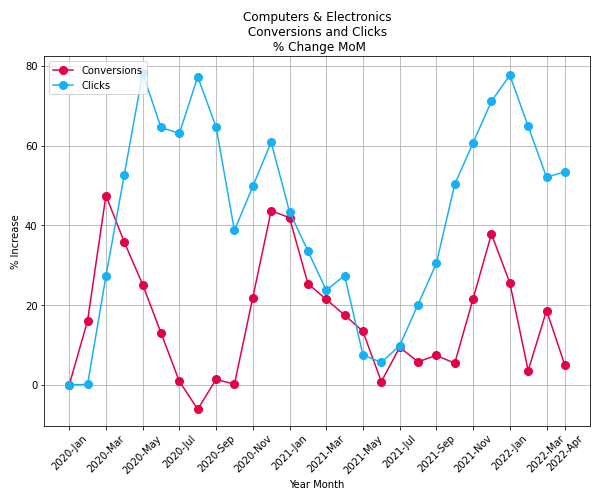
For the computers and electronics vertical, conversions followed a volatile path over the first quarter of 2022. Conversions started at 25 percent above baseline and almost dropped to zero before spiking up to 20 percentage points in March. By April 2022, conversions landed back down at 5 percent above baseline.
Clicks followed a smoother decline, dropping from January to March 2022 before rising slightly by April. Clicks showed significant improvement over 2021’s first quarter but failed to match the rising growth seen in April 2020. In comparison, conversions failed to keep up with clicks overall.
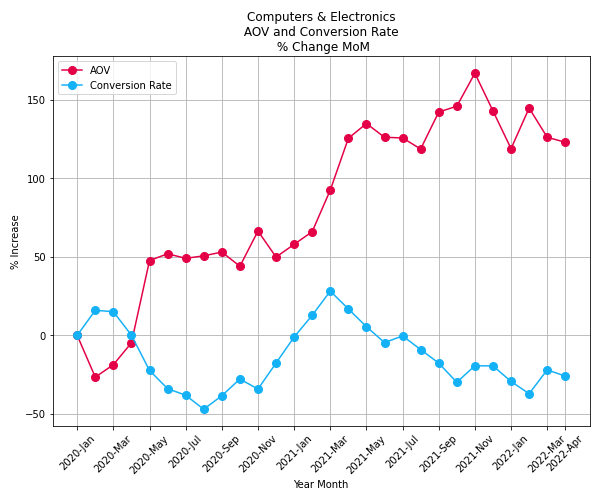
The average order value remained relatively steady in Q1 of this year. AOV jumped from below zero in April 2020 to 125 percent by the end of Q1 in 2021. By April 2022, AOV arrived back at the same point (125 percent above baseline) after a spike at the end of last year.
The conversion rate began a downward slope in April 2021, only to stabilize for short intervals. By April 2022, conversion rates slumped to 25 percent below baseline, matching May 2020’s numbers. For this vertical, March 2021 still stands as the recent high point.
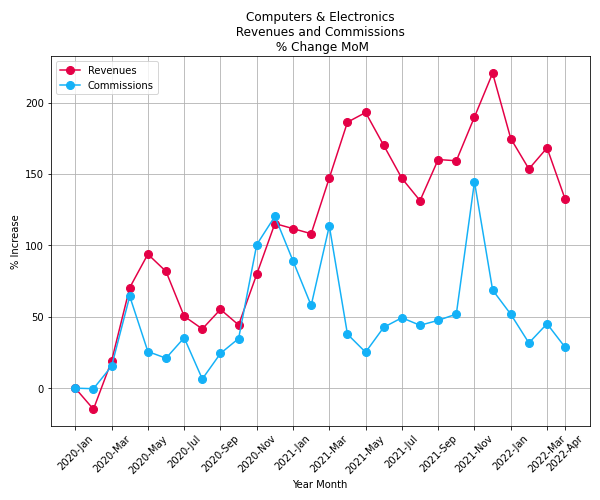
In April 2022, revenues fell by nearly 30 percentage points. Despite the noticeable drop, revenues remained substantial at 130 percent above baseline. The year 2021 showed a similar decline before climbing back up by the end of the year.
Commissions decreased to 30 percent above baseline in April, coming down from a peak of 150 percentage points last fall.
Flowers, gifts, food, and drinks
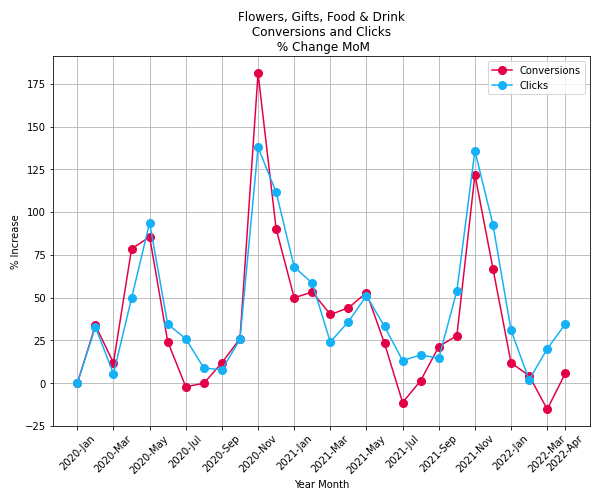
Conversions decreased for four consecutive months in the flowers, gifts, food, and drinks vertical. By March 2022, the numbers landed at 25 percent below baseline — their lowest rate since the pandemic. Conversions rebounded in April 2022 to slightly above baseline levels.
Clicks stayed on a downward trajectory from November 2021 to February 2022. Since then, clicks have increased and hit 30 percent above baseline.
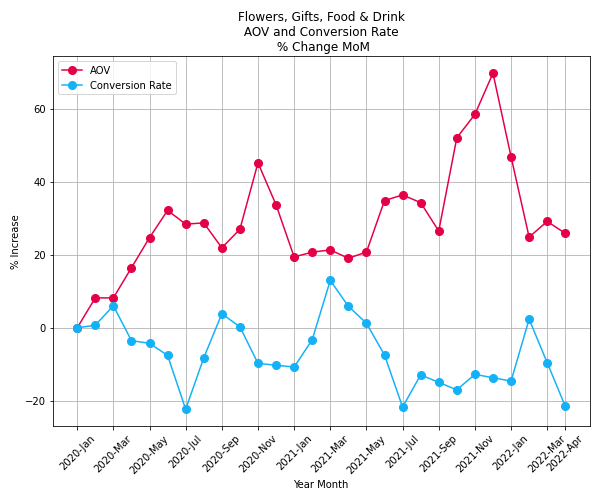
Average order value rose throughout the fall, with Halloween and Thanksgiving leading into the holiday season. In December 2021, AOV peaked at nearly 70 percent above baseline before declining to almost 40 percentage points in the following two months. The vertical’s AOV hovered around 20 percent above baseline during March and April.
The conversion rate fell from February 2022 to 20 percent below baseline by the end of Q1. Unfortunately, conversion rates could further decrease in the months ahead as inflation rates increase and affect consumer spending habits. Nonessential purchases and restaurant dining often go first when times get tougher.
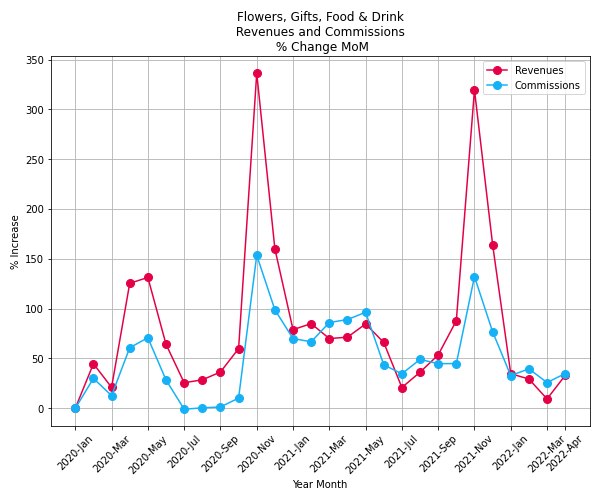
After revenues reached the lowest point in March 2022 since the pandemic’s start, they recovered to 30 percent above baseline by the end of Q1. In comparison, commissions stayed relatively level throughout the last three months, ranging from 25 to 40 percent above baseline.
Health and beauty
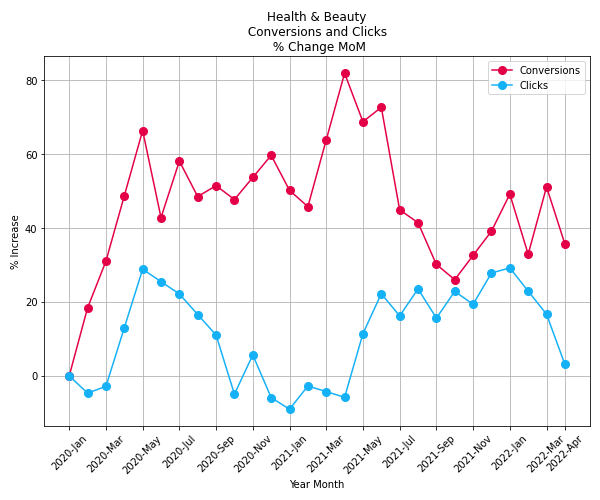
Conversions moved up and down throughout the first part of 2022, increasing and decreasing monthly by nearly 20 percent. Even as consumers cut back on spending, sales of these products keep up, and conversions should remain relatively healthy.
Clicks fell from a two-year peak in January 2022, sadly approaching baseline levels in April. Click rates in 2022 mirror the same trajectory as the same period in 2020.
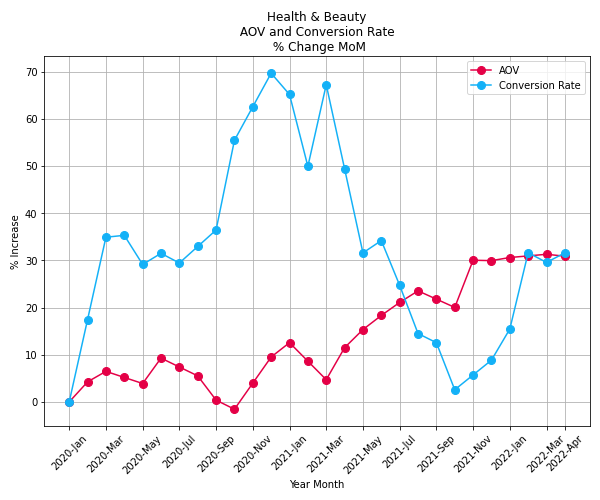
Average order value kept remarkably stable since November 2021, staying around 30 percent above baseline for all of Q1 2022.
Conversion rates in the vertical dramatically collapsed a year ago, almost reaching baseline levels. The conversion rate lowered by 70 percent between April and October last year. Thankfully, conversion rates rebounded in November 2021, continually increasing until February 2022.
During the first two months of this year, conversion rates spiked, jumping by 20 percentage points. After that, this metric leveled off at 30 percent above baseline for March and April.
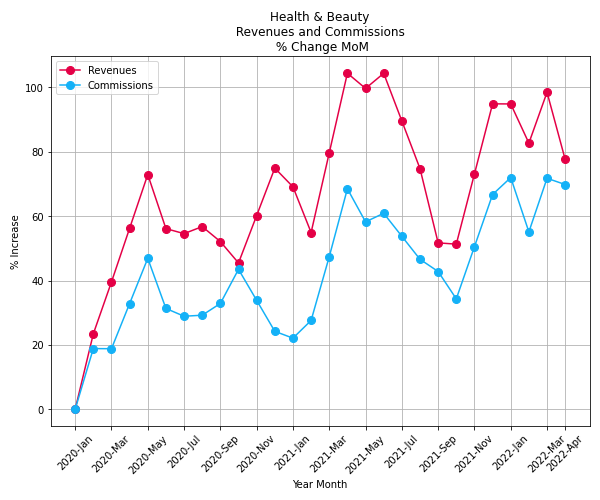
Revenues declined by 20 percentage points from March to April, landing at 80 percent above baseline levels — the lowest rate in 2022.
Commissions increased by nearly 20 percentage points from February to March, remaining stable during April at around 70 percent above baseline. Considering many people think of these products as essential, this vertical should be less affected by inflation and price increases.
Home and garden
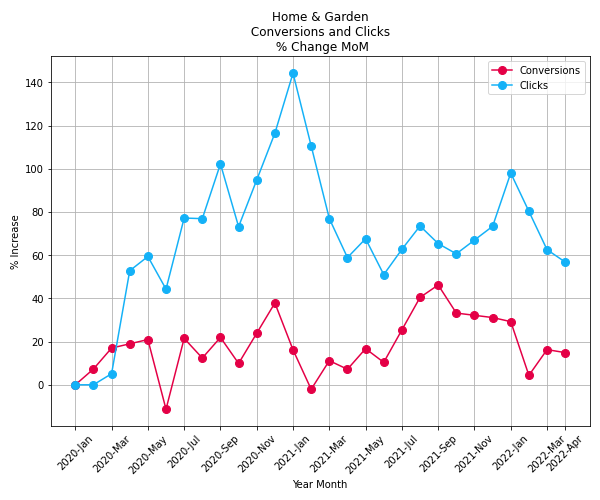
In the home and garden vertical, conversions decreased steadily since September last year and recovered slightly in March 2022 to 20 percent above baseline.
After noticeable spikes during both of the last holiday seasons, clicks decreased by more than 40 percent during this quarter. Compared to conversions, clicks experienced a much greater variance since the pandemic started.
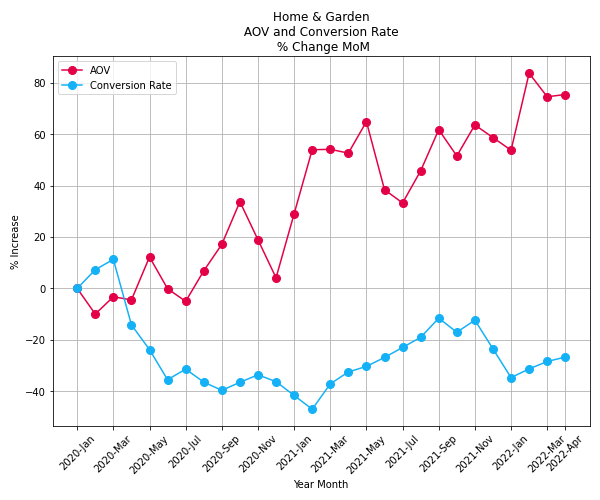
The average order value topped out at more than 80 percent growth in February 2022. AOV remained relatively stable for the rest of Q1.
Conversion rates slowly recovered throughout 2022 so far and increased by 20 percentage points. Over the last three years, this metric has struggled — staying below baseline since March 2020. Last fall saw a slight recovery, and conversion rates sat at about 25 percent under the baseline by April 2022.
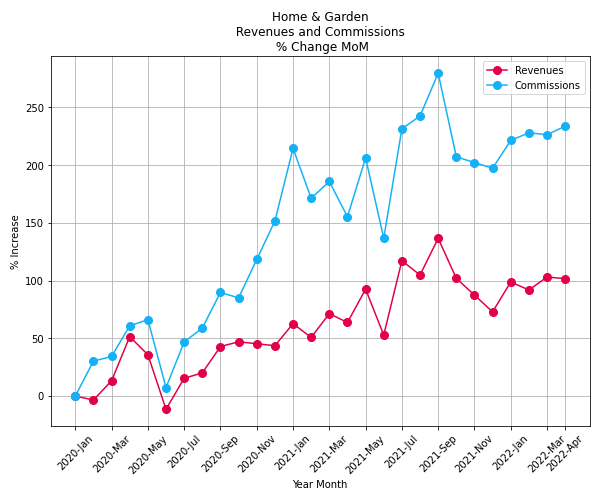
During the first part of 2022, revenues remained stable at 100 percent above baseline. Revenues rose consistently since dropping below zero in June 2020. Rates stopped increasing and stayed remarkably level during Q1 2022.
Commissions steadily increased throughout 2022, landing at 230 percent above baseline by April. Commissions stayed on an upward arc from mid-2020 until now — with a few short dips and peaks.
Travel
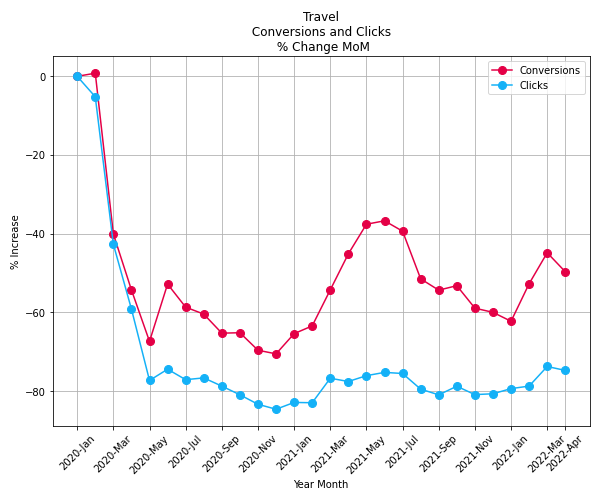
Conversions in travel trended downward from the first quarter of last year, declining to 60 percent below baseline levels by January 2022. However, conversions rose by more than 15 percentage points from February to March as COVID-19 cases decreased, vaccination rates improved, and holiday travel kicked into gear. By April, conversions fell back to 50 percent under the baseline.
Clicks climbed for most of 2022, standing around 75 percent under baseline in March and April.
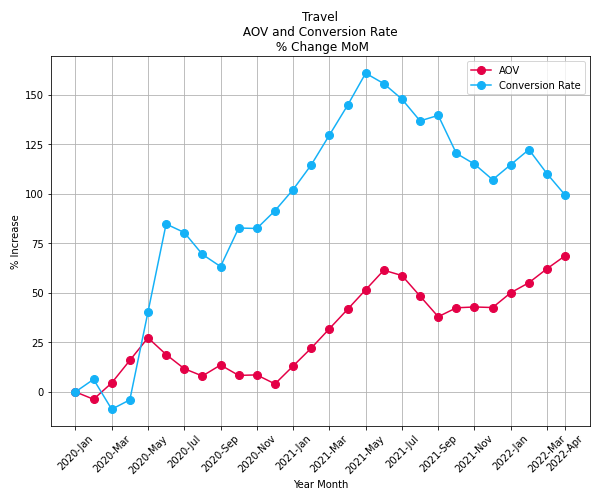
Since December last year, the average order value has improved, approaching 75 percent above the baseline of April 2022. AOV rose alongside higher demand for business travel and planned spring/summer vacations.
AOV reached 30 percent higher this year than in Q1 of 2021. In stark contrast, conversion rates declined to 100 percent above baseline in April 2022 — nearly 50 percentage points lower than a year ago.
The travel vertical could be vulnerable to rising oil prices due to the Russian invasion of Ukraine and spiking interest rates. For this vertical, uncertainty seems to be sticking around as the summer approaches.
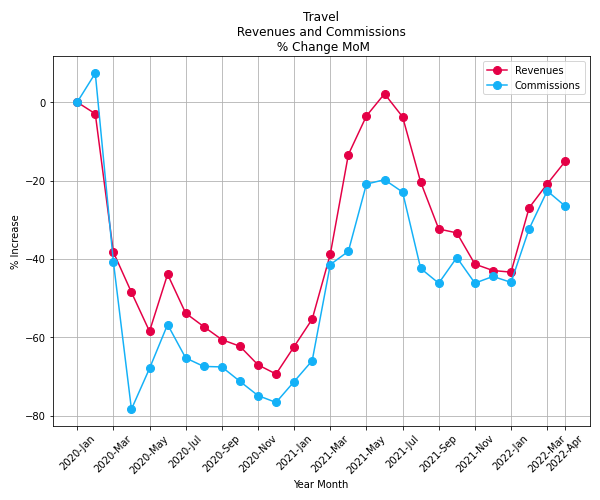
Both revenues and commissions increased during the first quarter of 2022. While revenues continued to rise through March and April, commissions declined by five percent during the same timeframe.
Revenues only reached baseline levels since 2020, while commissions stayed below minus 20 percent. However, both metrics improved by 20 more percentage points since the holiday season. Compared to Q1 of 2021, revenues fell short, but commissions followed a nearly identical path.
Boldly facing new challenges as COVID-19 lingers
Heading into the summer, many people hoped 2022 would feel completely normal again — leveling off after a two-year stint of unpredictability. While many industries found success and achieved growth during this quarter, other metrics showed the ripple effect of world events.
Travel remains uncertain, while shortages and delays could still affect technology supply lines. Rising inflation reaches wide and adds possible complications for many brands.
However, partnerships have demonstrated real resilience and adaptability over the past few years. Instead of cracking under pressure (like traditional advertising might), partnerships kept opening up new avenues for growth. Especially when comparing the first quarter of 2022 with previous years, many metrics trended upwards. As partners, both parties involved have the best chance for success — no matter what the future holds.
To learn about authentically connecting with audiences through partnerships, reach out to our impact.com growth technologists at grow@impact.com. We’ll help guide you through.
To see other benchmark reports from impact.com, check out this list:
- Partnership benchmarks 2020-2021: One year later, COVID still calling the shots [blog]
- Partnership benchmarks 2020—A 6-month performance review of 8 key verticals in the time of COVID-19 [ebook]
- Holiday partnerships benchmarks 2021 [report]
- Partnership benchmarks 2020 vs. 2021: Cyber Week AOV growth drives higher revenues across nearly all verticals [blog]
- Partnership benchmarks 2020 vs. 2021: Revenues up but a surprising Black Friday [blog]


