Last year’s holiday season was filled with uncertainty as brands and partners waited to see how customers would respond to shopping during the pandemic. While 2020 was a solid Cyber Week for retailers, there was still not a lot of clarity on what would happen in the market as Black Friday and Cyber Monday approached this year.
A total of 179.8 million unique shoppers made in-store and online purchases during the holiday weekend, according to the National Retail Federation (NRF) reports. That was down from 186.4 million last year but still beat the NRF’s prediction by 21 million shoppers and was in line with the four-year average.
Conversion rates and average order value (AOV) were higher due to lower clicks. This data is consistent with previous holiday sale analysis impact.com has performed throughout the year. Retail metrics are generally trending down on these big shopping weekends, possibly because consumer fatigue is kicking in.
The data revealed that partners benefited, which was especially true on Cyber Monday, as commissions shot through the roof compared to last year. With higher conversion rates and larger basket size, brands were willing to share their success with their partners.
Key findings from the research include:
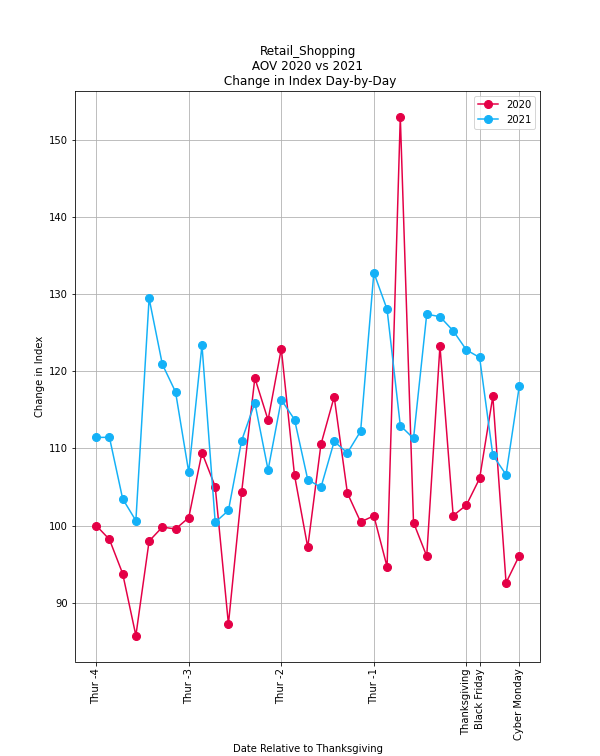
- AOV was higher this year on both Black Friday and Cyber Monday, contributing to an increase for the entire week, year over year.
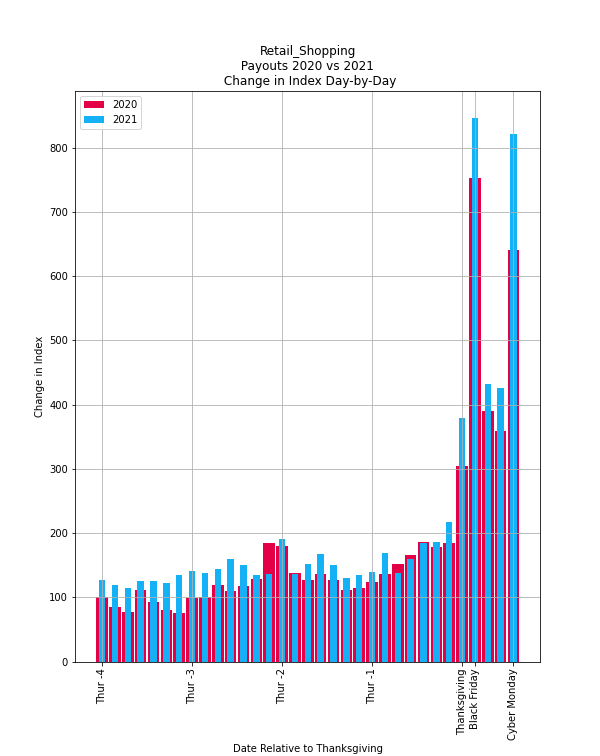
- Payouts soared for partners on Cyber Monday. With revenue lower than expected on Black Friday, it’s possible that brands went all out for Cyber Monday, and their partners benefited as a result.
- Conversion rates were generally higher this year, indicating that shoppers were more selective with their clicks than last year.
The methodology behind the benchmarks
The impact.com data scientist team tracked year-over-year (YoY) by day benchmarking across retail and shopping verticals to compare 2020 and 2021 Cyber Week year-over-year growth. The data was pulled using a cohort of hundreds of brands within the retail and shopping verticals that contained the same-store data year over year.
All numbers quoted in this research are relative to the value for the four weeks before Thanksgiving 2020. Increases and decreases represent the change relative to that single value. For example, $1 million in payouts four weeks before Thanksgiving is equivalent to an index value of 100, so $2 million in payouts the next day equals an index value of 200.
The impact.com’s data analysis began four weeks before Cyber Week on October 28, 2021, and ended on Cyber Monday, November 29. The 2020 period ran from October 29, 2020, to November 30, 2020. This time frame offers a whole window into consumer behavior leading up to and including Cyber Week.
Six trends to note from Cyber Week data
1. Customers who made purchases spent more than they did a year ago.
- AOV was 11 percent higher this year across the entire week. This increase was primarily buoyed by the major shopping days (but not the weekend) though some of it could have been because of inflation.
- AOV was up 15 percent on Black Friday, up 20 percent on Thanksgiving, and up 23 percent on Cyber Monday compared to last year.
Key takeaway
Unlike many of the retail metrics tracked this year, the average daily AOV was higher than last year for nearly every day in November leading up to Thanksgiving, Black Friday, and Cyber Monday. While the other metrics falling is not good, higher AOV means that shoppers committed to buying online are buying more than they did a year ago — possibly even because they had such a satisfactory ecommerce experience in 2020.
2. Low clicks may indicate that 2020 was an ecommerce outlier.
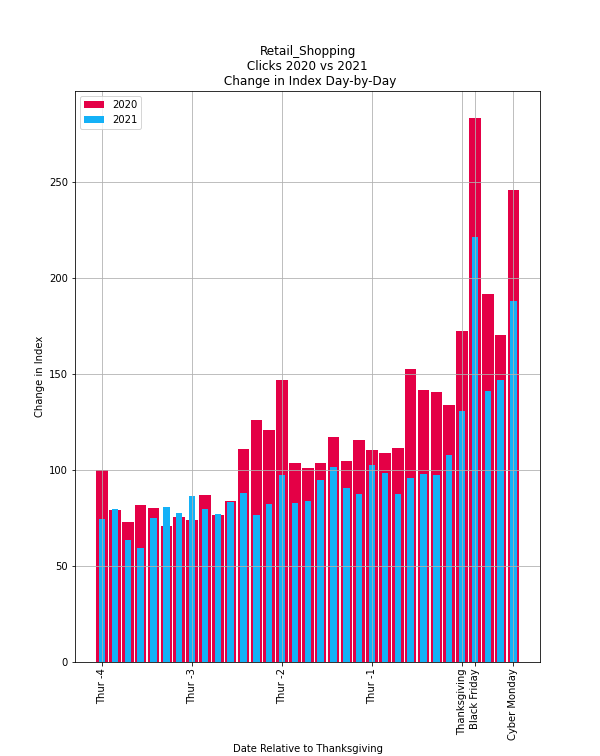
- Daily clicks decreased an average of 16 percent across the analyzed period, and clicks were down nearly every day, compared to the equivalent dates last year.
- Clicks were down 22 percent on Black Friday compared to last year.
- Clicks were down 24 percent on Cyber Monday compared to last year.
Key takeaway
Our 2020 analysis showed that clicks were up an average of 118 percent per day last year, as consumers shifted to ecommerce amid the pandemic. With click activity receding so much from last year, it’s still unclear which year is the better representative of the “new normal.”
3. Partners benefited as payouts rocketed.
- Payouts typically soar on Black Friday and Cyber Monday, but they exceeded expectations this year, with an average increase of 21 percent from last year.
- Cyber Monday was especially good for partners, as payouts were up by 28 percent compared to 2020.
- Payouts were up on Black Friday (up 12 percent) and Thanksgiving (up 24 percent) compared to last year.
Key takeaway
Payouts were generally higher throughout November compared to last year, indicating that brands were rewarding their partners for the conversions and traffic that they drove. Higher payments are a sign that brands understand the power of partnerships and devote more budget to the channel.
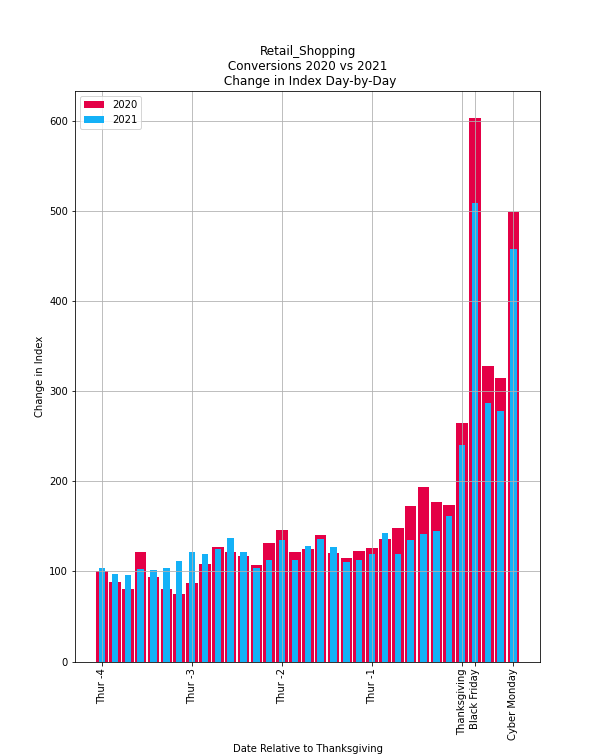
4. Lower conversions indicate fewer purchases.
- Purchases were down by an average of 0.6 percent from last year.
- While Black Friday saw the most conversion activity, total conversions were down by 16 percent compared to last year.
- Conversions were down 8 percent on Cyber Monday compared to 2020.
Key takeaway
Falling conversions could be the result of several factors. Supply chain issues remain a factor, and consumers can’t buy items if they’re not in stock. At the same time, this could be a sign of potential consumer fatigue, as sales and discount offers bombard buyers more than ever before. According to Adobe, online Black Friday sales were $8.9 billion, down from $9 billion, showing that the day doesn’t hold quite the same sway it once did.
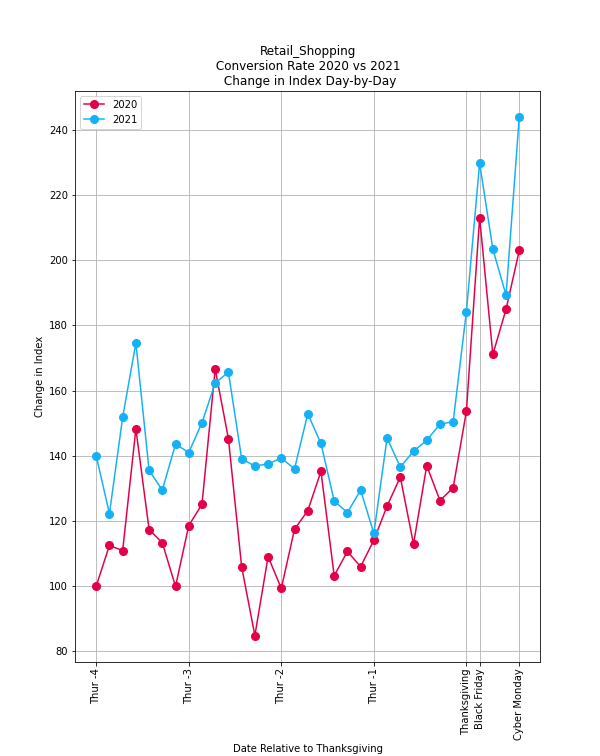
5. More selective shoppers led to higher conversion rates.
- Conversion rate was a 19 percent increase from last year, on average.
- Conversion rate was 8 percent greater on Black Friday and 20 percent greater on Cyber Monday.
- Conversion rates were 20 percent greater on Thanksgiving compared to 2020.
Key takeaway
Even though both conversions and clicks were down from 2020, conversions did not experience as steep of a decline. This relatively steady conversion rate signifies that shoppers with greater purchase intent were more selective on the kinds of offers they did click on.
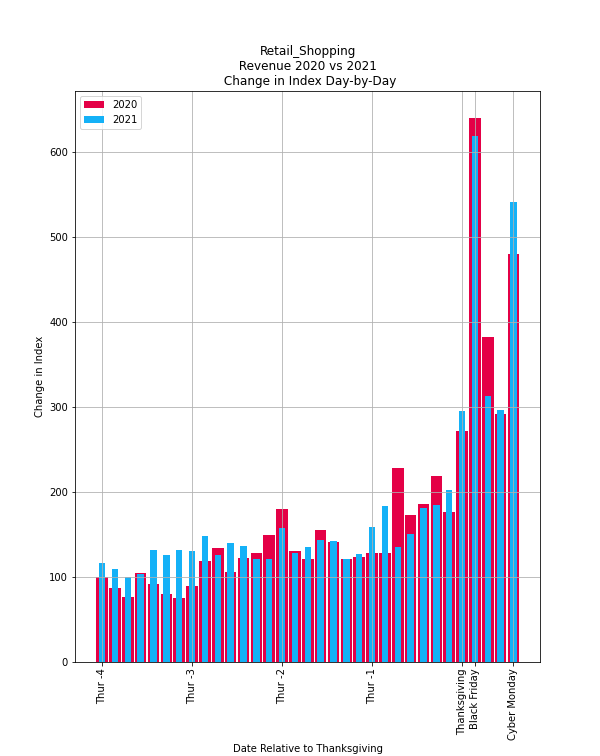
6. Revenue is up despite a poor performing Black Friday.
- Revenues were 10 percent higher during this period, despite a Black Friday that saw 3 percent less revenue than 2020.
- Cyber Monday was a significant contributor to the overall revenue growth, as revenues were up by 12 percent from last year.
- Thanksgiving saw a 9 percent growth in revenues, indicating that shoppers may have begun their online buying early rather than wait for Black Friday.
Key takeaway
A poorly performing Black Friday is not a good thing, but strong revenue numbers for Cyber Monday indicate that consumer behaviors may be shifting, saving their online buying for Monday.
Looking ahead
While many metrics sagged on Black Friday and Cyber Monday, the positives associated with the extended shopping season show that partnerships provide clear benefits to the brands that utilize them. Higher AOV means that the buyers who come through partnerships are spending more than they were a year ago, and that’s something that any retailer would love to see this holiday season. It only makes sense that payouts continue to grow as partnerships continue to drive value in an uncertain retail environment.
Want to find out more about honing your partnerships to ensure you get the best results no matter what day of the year? Reach out to an impact.com growth technologist at grow@impact.com
