

Cyber Week 2022 findings reveal that consumer behavior has adapted and recovered to the new normal. As such, brands and publishers evolved strategies to accommodate changes seen in the market. When you analyze actionable data and clear comparisons, you’re able to determine how industries have bounced back.
Succeed in Cyber Week 2023 by taking a deeper look at key performance metrics of the 2022 Black Friday and Cyber Monday (coined Cyber Week) to uncover:
- How has consumer behavior changed?
- What has worked for brands?
- How can marketing teams prepare for the future?
With the help of impact.com’s Data Science team, it’s easier to see evolving consumer behavior and line up 2022’s Cyber Week against the same period in 2021. Use these key insights to strengthen partnerships, finely tune marketing strategies, and plan for the upcoming shopping seasons.
Discover the key takeaways in the Retail and Shopping vertical—and download the research report for a detailed look into partnership performance during Cyber Week 2022.

Cyber Week 2022 Benchmark Report
Trends to note from Cyber Week 2022
- Bargain hunting was at an all-time high. In 2022, consumers proactively searched for the best and dedicated more time to researching products, finding deals, and signing up for email alerts.
- Best-performing days vary per vertical. Based on transactions, the top sales day for the Retail and Shopping vertical was Black Friday.
- More revenue for brands and publishers.
- Brands in each vertical enjoyed revenue growth from Cyber Week 2021 to 2022: Retail and Shopping (8%).
- Commission earnings for publishers increased from Cyber Week 2021 to 2021 by 13% in the Retail and Shopping vertical.
Methodology
The data science team at impact.com tracked key metrics in a year-over-year (YoY) analysis of Cyber Week 2021 vs. Cyber Week 2022.
The analysis (conducted on December 2, 2022) offers a coherent and actionable picture of partnership metrics by tracking vital benchmarks and recording and comparing data during the 2022 analysis period. Cyber Week refers to the shopping season from Thanksgiving to Cyber Monday.
The analysis period relates to the data pulled four weeks leading up to Thanksgiving and including Cyber Week:
2021: 10/28 – 11/29
2022: 10/27 – 11/28
Data scientists at impact.com tracked key performance metrics—average order value, clicks, sales, conversions, commission, and revenue—in a year-over-year (YoY) analysis.
Researchers pulled the data using a cohort of hundreds of brands containing the same-store data year over year—Retail and Shopping. The data pulled reflects the brands in North America that actively used the impact.com platform in 2021 and 2022.
The data offers unique and valuable insights into consumer behavior and more significant trends leading up to (and including) Black Friday and Cyber Monday.
Understanding the metrics
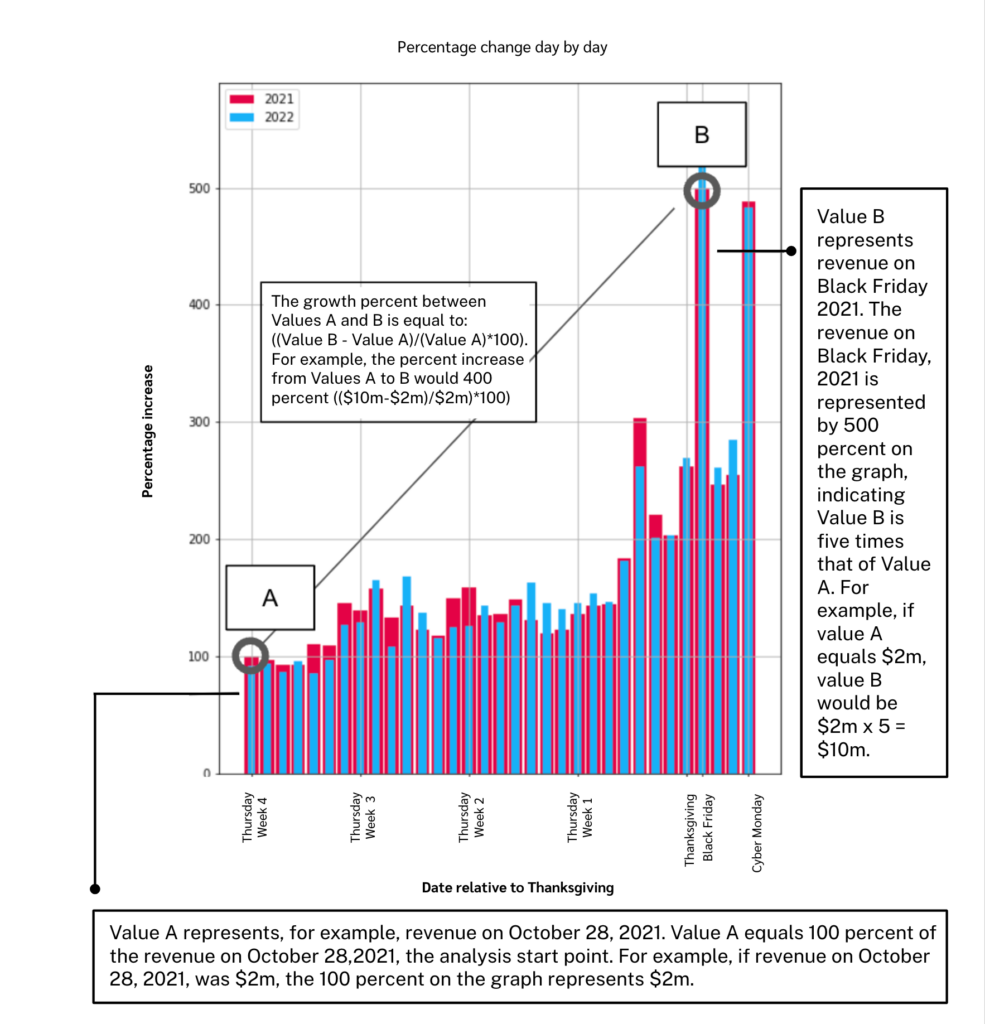
All numbers quoted are relative to the value on October 28, 2021—four weeks before Thanksgiving 2021.
The percentage increase seen in the graphs represents the change relative to that value on October 28, 2021.
For example, $2 million in revenue on October 28, 2021, equals 100% on the graph. Therefore, $10 million in revenue on Black Friday 2021 would read as 500% on the graph—indicating revenue is five times more than on October 28, 2021.
The revenue growth from the first day (October 28) to Black Friday, 2021, is 400% (($10 million – $2 million)/$2 million) *100). The report references this change as percentage point changes which refer to the difference between two percentages.
5 key findings in the Retail and Shopping vertical
Retail and Shopping covers various brands and sub-verticals. The comprehensive analysis shows how consumers discover, research, click on, and purchase new products. This research also spotlights new habits and trends that built momentum over the last year. Uncover five key metrics to help pinpoint current trends:
- Consumers made more purchases while focusing on lower-ticket items
- Bargain hunting gave clicks a significant boost
- Consumer purchase intent increased near Cyber Week(leading to a sales spike)
- Publishers cashed in on Cyber Week benefits
- Black Friday was Cyber Week’s best-performing day
1. Consumers made more purchases while focusing on lower-ticket items
- Consumers were more price sensitive during Cyber Week 2022: 82% mentioned discounts and savings as motivating factors in spending decisions.
- Despite the Average Order Value (AOV) decreasing by 3% ($131 to $127), sales (transactions) increased by 7% during the 2022 analysis period compared to the 2021 analysis period, indicating consumers made more purchases.
- During Cyber Week 2022, the AOV was 4% less than in 2021.
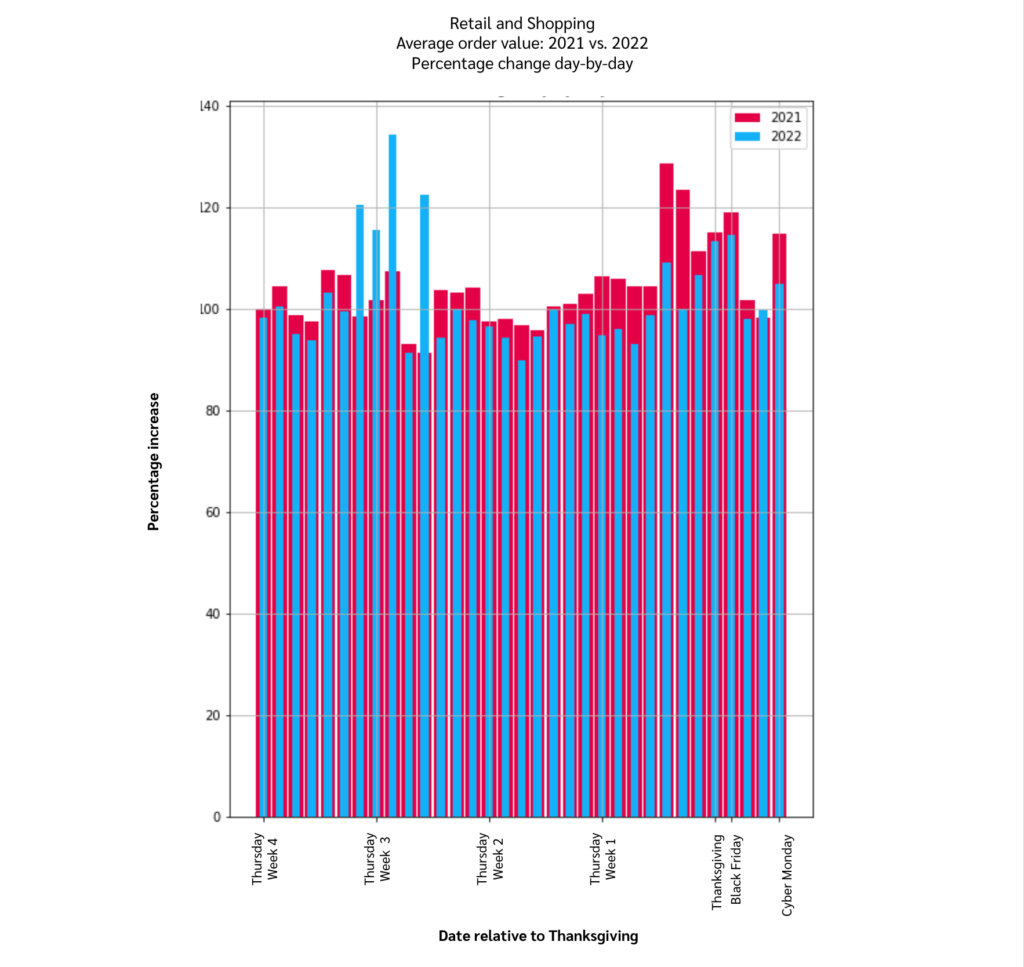
Key takeaway
Comparing the same periods in 2021 and 2022, the rise in transactions balanced out the slight drop in AOV—leading to a 3% revenue boost for the overall analysis period and 8% during Cyber Week.
2. Bargain hunting gave clicks a significant boost
- Up to 45% of shoppers looked up or requested email alerts for discounts and promotions.
- Seeking out the best possible deals was a definite trend in 2022: 41% of consumers searched coupon sites, and 38% checked out a brand’s social media page.
- Clicks increased by 6% in the 2022 analysis period compared to the 2021 analysis period. Additionally, clicks rose by 9% during Cyber Week 2022—20 percentage points higher on Black Friday 2022 than last year.
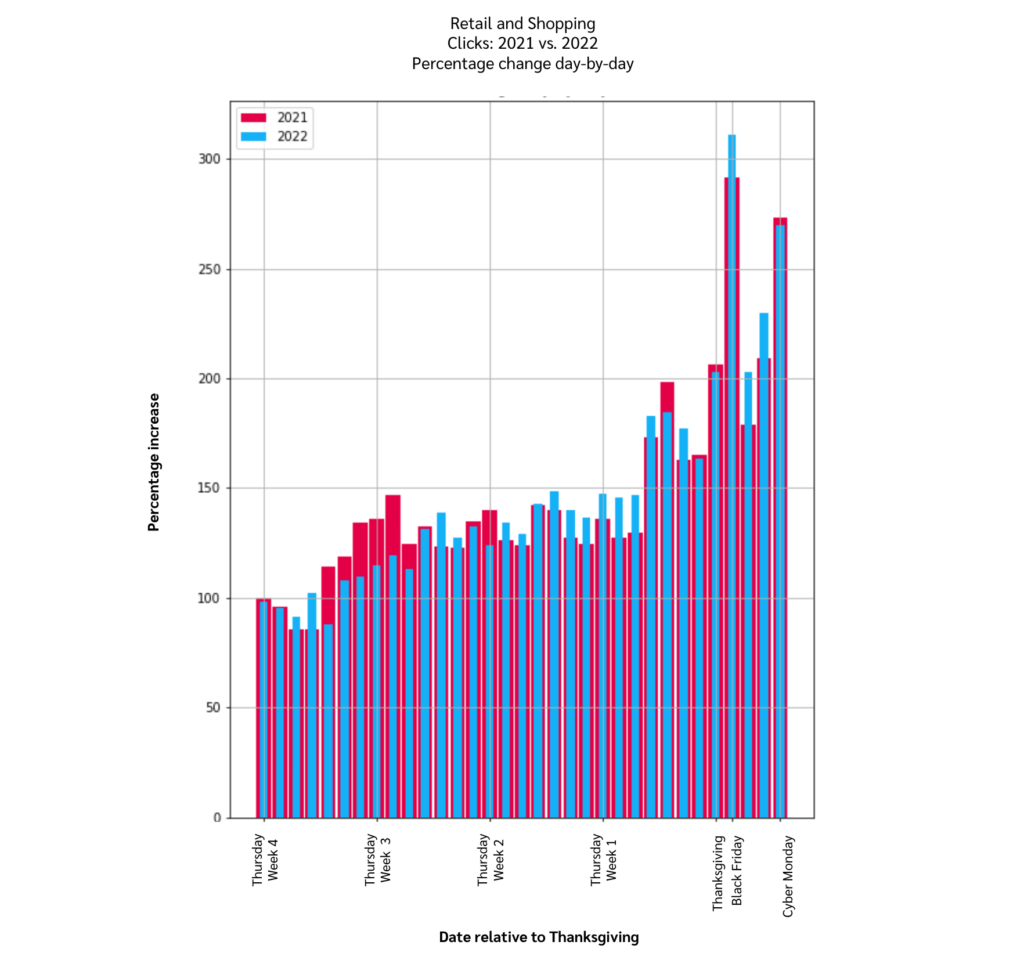
Key takeaway
The click increase shows consumers were more engaged than ever: researching products, tracking discounts, and comparing prices.
3. Consumer purchase intent increased near Cyber Week (leading to a sales spike)
- As many as 80% of consumers intended to shop during Cyber Week.
- The number of transactions rose by 7% in the 2022 analysis period compared to 2021.
- Sales increased by 13% during Cyber Week 2022 compared to 2021.
- The most sales occurred on Black Friday: increasing nearly five times from the start of the analysis period in 2021.
Key takeaway
On Black Friday 2022, transactions rose approximately 65 percentage points higher than on the same day last year.
4. Publishers cashed in on Cyber Week benefits
- As sales increased, commissions for publishers rose 14% in the 2022 analysis period. During Cyber Week 2022, commission rose by 13% from 2021.
- In 2022, Black Friday commissions skyrocketed, increasing eight times from the start of the analysis period. Growth on Black Friday 2022 was 150 percentage points higher than Black Friday 2021.
- Advertisers paid publishers higher commission rates in the 2022 analysis period (compared to 2021).
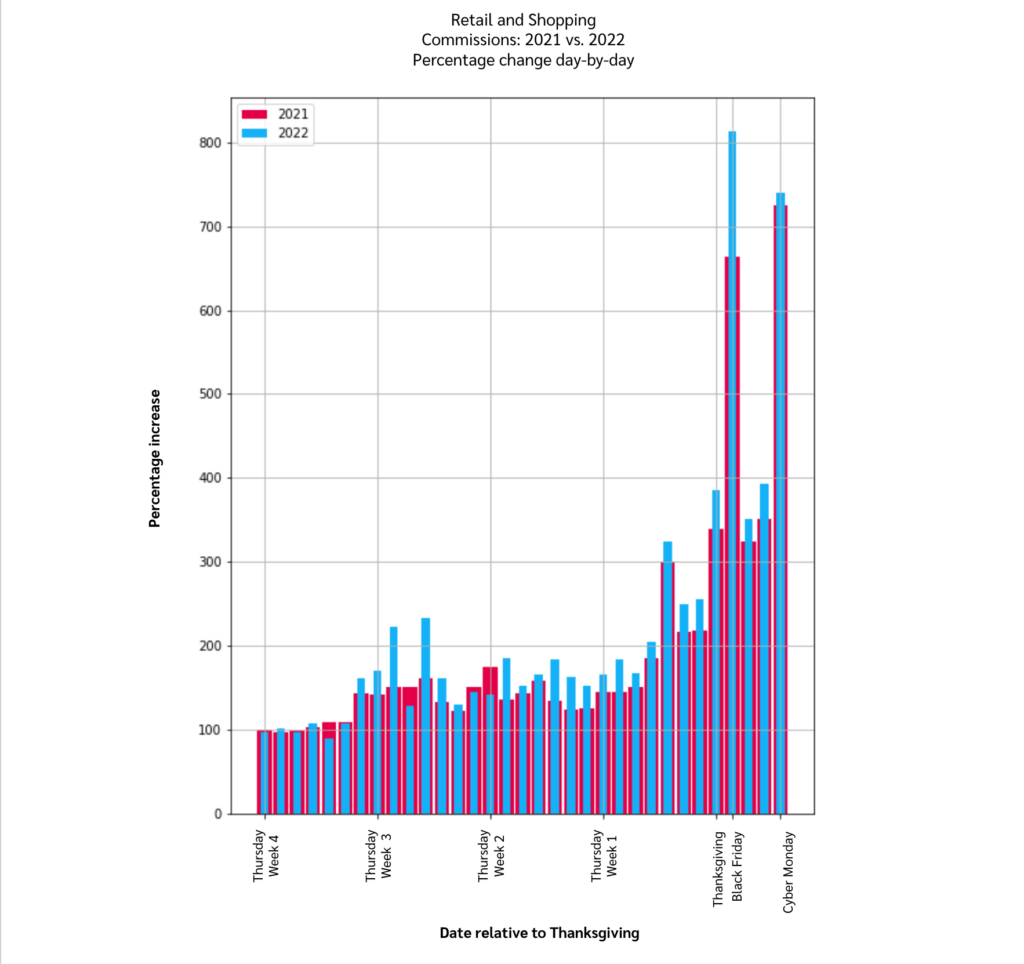
Key takeaway
Overall, Black Friday commissions improved by 150 percentage points compared to the same day in 2021.
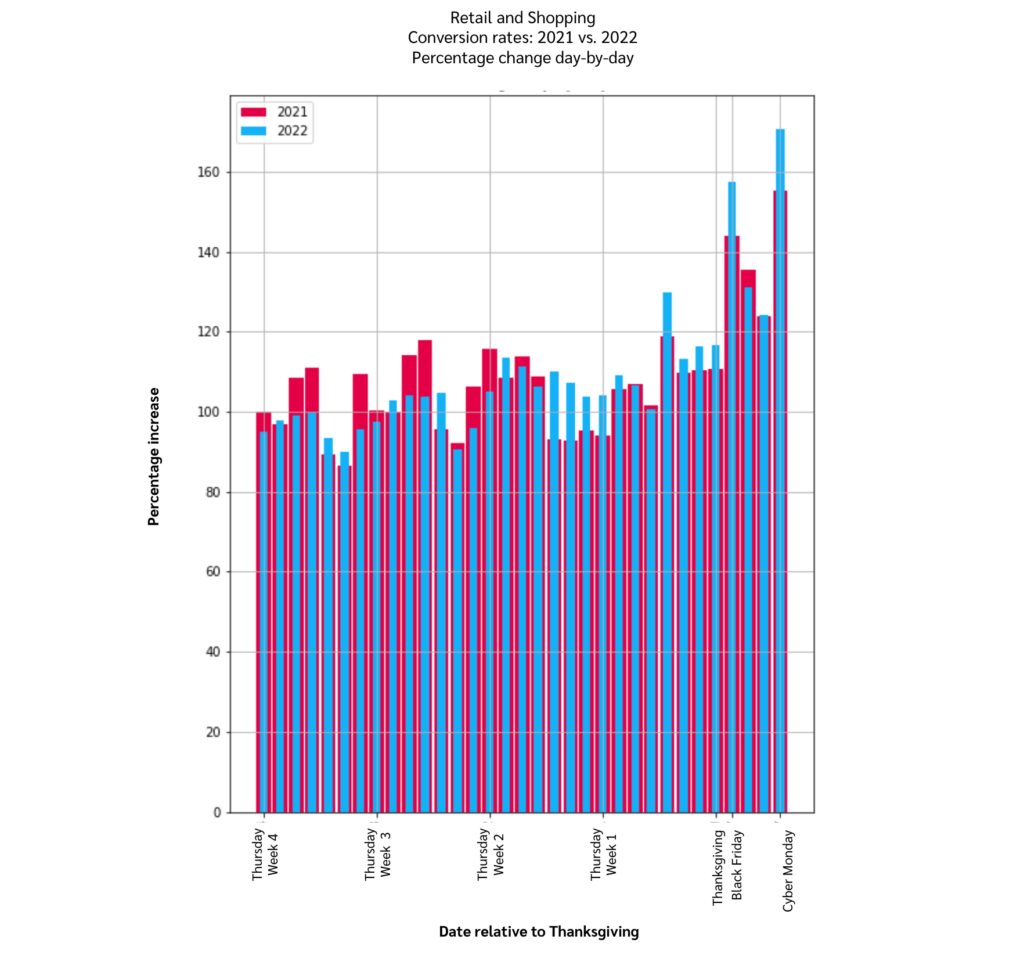
5. Black Friday was Cyber Week’s best-performing day
- Clicks tripled on Black Friday 2022 from the start of the analysis period—20 percentage points more than the previous year.
- After rising almost five times from the start of the analysis period, Black Friday 2022 saw the most individual sales: 65 percentage points more than Black Friday 2021.
- On Black Friday, conversion rates are 13 percentage points higher than in 2021.
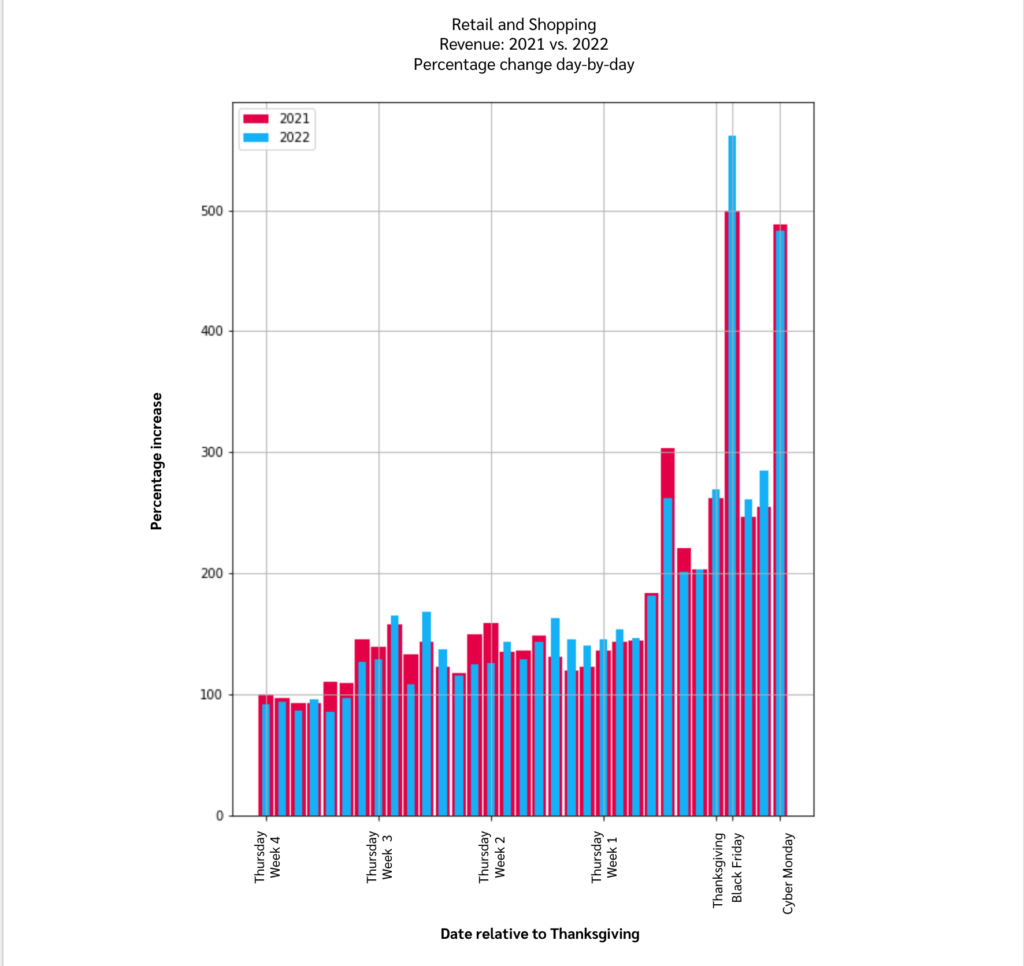
Key takeaway
Cyber Week 2022 saw an 8% increase in revenue compared to 2021. Black Friday 2022 revenue was 60 percentage points more than the same day in 2021.
Cyber Week 2022 Benchmark Report
Cyber Week 2022: positive shifts in the right direction
The reported metrics of the recent Black Friday shopping season show resilience as shoppers were more engaged with brands and publishers than in 2021. Slight changes in consumer behavior indicate a gravitation toward shoppers making more informed decisions based on research and bargain hunting.
While economic instability is still a huge topic, Cyber Week 2022 proved that online retail are bouncing back.
Download the full impact.com report and deep dive into Cyber Week 2022: breaking down how specific industries fared and using the data as the blueprint to strategize for success in the 2023 shopping season!