Our 2024 Industry Trends Benchmark Report shows that U.S. consumers were more intentional about shopping last year compared to 2023.
Shoppers demonstrated growing confidence in their purchasing decisions and favored long-term financial stability over immediate gratification. A McKinsey study supported this finding, highlighting a surge in consumer optimism that reached its highest point since the pandemic. These insights reveal a more thoughtful consumer base, giving brands the chance to align their strategies with shifting expectations and habits.
Key consumer trends 2024:
- Consumer spending rose 8% YoY
- 15% more orders YoY, with 15% more items per cart
- Average order value dropped 6% as consumers favored lower-cost items
- Q4 accounted for 33% of annual consumer spend, with orders increasing 37% from H1 to H2
Partnership impact:
- Loyalty and Rewards programs drove 49% of orders and 53% of consumer spend
- Network partners generated 38% of traffic during the research phase
- Content review sites contributed 23% of discovery traffic
- Commission payments increased 11% YoY, with action-based compensation reaching 88% of total brand spend
Business implications for 2025:
Research-driven consumers typically review products three times before purchase. Brands should:
- Optimize partner mix across customer journey stages
- Leverage content partners for early research engagement
- Maintain momentum beyond peak shopping periods
Methodology
The impact.com 2024 Industry Trend Benchmark Report, racked key performance metrics across 1,339 North American brands in the Retail and Shopping industry. The year-over-year (YoY) analysis compared performance during January 1-December 31, 2024 to the same period in 2023.
While the complete analysis of the Retail and Shopping vertical includes various sub-categories, the following were included for this report:
- Apparel, Shoes, and Accessories
- Computers and Electronics
- Health and Beauty
- Home and Garden
- Sport, Outdoor, and Fitness
- Arts and Entertainment
- Flowers, Food, Gift, and Drink
This report aims to offer unique and valuable insights into consumer behavior and significant trends throughout 2024
| GLOSSARY 2024 Industry Trend Benchmark | |
| Total brand spend | The sum of action-based and non-action-based payments to partners, affiliates, and creators. |
| Non-action based payment | Brand expenditure that occurs when brands pay their partners, bonuses, paid placement fees, etc. |
| Action-based (commission) payment | Brand expenditure that occurs when brands pay their partners a commission for a specific, predefined action. |
| Network partners | Publisher platforms that broker access to brand campaigns and provide tracking, reporting, and payment services. That includes publishers categorized as network, syndication blog networks, or CPA networks. |
| Content review partners | Publishers that produce editorial content to promote, compare, and list products and services. This includes premium publishers, shopping comparisons, financial comparisons, content, bloggers, etc. |
| Loyalty and rewards partners | Publisher platforms that incentivize transactions from consumers, employees, or businesses through a membership or benefits reward program. |
| Deal and coupon partners | Publishers who aggregate and classify deals and promotions for consumer savings. |
| Commerce solutions | Site-side shopping tools and services that drive conversion optimization for brands. |
| Media arbitrage | Search engine, social, or programmatic marketers that manage keyword campaigns for brands, often on a performance basis. |
| Cross-audience monetization | Businesses that publish offers, content, and complementary products to current customers or audiences (e.g., exit traffic, improved UX) to drive incremental revenue. |
| Analysis period | January 1, 2023 – December 31, 2023 vs January 1, 2024 – December 31, 2024. |
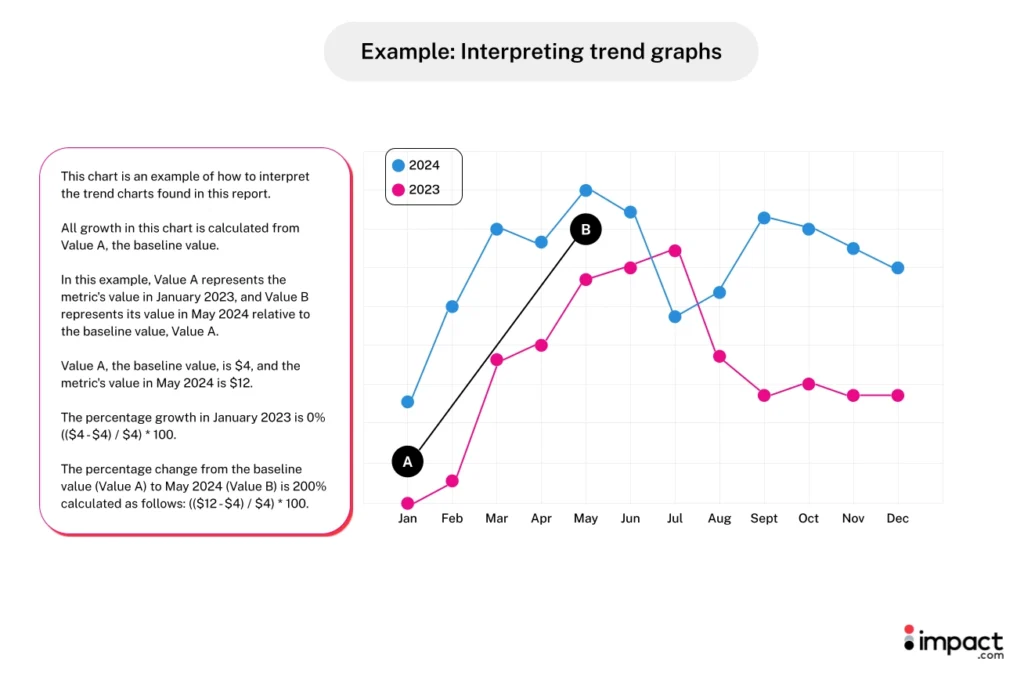
Interpreting the graphs
Strategic insights for brands
- Engage consumers year-round: Click volume is traditionally concentrated in the second half of the year, coinciding with major shopping events.
- What brands can do: Leverage partners to generate buzz and encourage site visits throughout the year, not only during major shopping holidays.
- Drive interest post-Cyber Week: Unlike in 2023, 2024 click volumes continued to lift after Cyber Week into December. This presents an opportunity for brands to sustain interest into the New Year.
- What can brands do: Work with partners to share upcoming New Year’s deals, positioning your brand for orders in January and beyond.
- Optimize your partner mix: Our data shows how different partner types play different roles in the customer journey—while certain partners are great at creating awareness, others are the last touchpoint before consumers are ready to convert.
- What can brands do: Assess partner ecosystem to identify which partner types work best at each stage of the customer’s journey, then scale them for growth.
- Celebrate with deals all year: Our research indicates consumers postponed non-urgent or large purchases until Q3 and Q4 shopping events to take advantage of promotional pricing.
- What can brands do: Give consumers time-bound incentives to purchase earlier in the year. Work with partners to get the word out, so shoppers feel as confident about Q1 and Q2 deals as later incentives.
- Use industry events and activities to push more sales: Events like the Computer and Electronics industry’s annual CES trade show in January likely helped deliver this sector’s high clicks volume (32%) and orders in Q1.
- What can brands do: Design special deals and work with partners to capture consumers’ attention during your industry’s major events and holidays.
6 key insights to measure partnership success in 2025
In 2024, our analysis discovered that consumers remained thoughtful about their purchases, conducting more research than ever before to guide buying decisions.
Partners continue to play an important role throughout this complex customer journey, generating awareness during the research process and driving conversions when shoppers are ready to purchase.
The following findings examine how consumer behavior affected key performance metrics and how they might drive your future partnership strategies.
- Click volume rose 9% and ended strong in December
- Consumer confidence is on the rise as conversions increased by 6%
- Orders increased by 37% from H1 to H2 in 2024
- Shoppers packed their carts, but spent less per item
- Consumers spend 8% more in 2024
- Partnerships continue strong as brands increase commission payments by 11%
1. Click volume rose 9% and ended strong in December
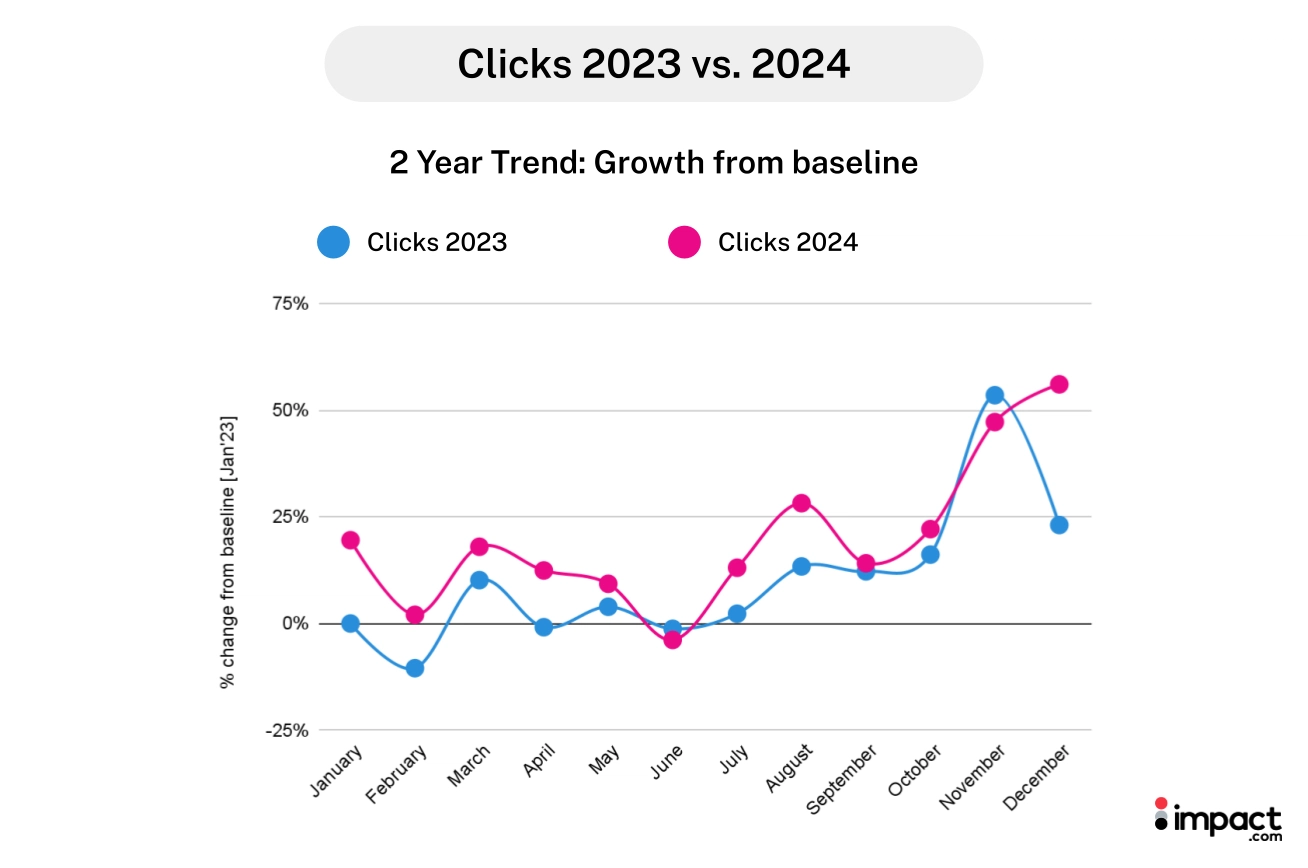
Clicks in 2024 followed a similar trend as 2023, with 46% of clicks occurring during the year’s first half (45% in 2023) and 54% during the second half (55% in 2023). Overall, clicks increased 9% YoY.
In 2024, clicks didn’t dip after Cyber Week like they did in 2023. Instead, they continued to rise into December.
Two factors may have contributed to the sustained activity:
- Strong strategic partnerships for end-of-year holiday shopping: Our 2024 Cyber Week research found brands that used strategic partnerships during Cyber Week saw a 23% increase in conversion rates. Buoyed by attractive Cyber Week deals, shoppers likely continued to visit brands for more deals through December.
- Consumer shopping behavior shifts: In 2024, consumers were more sophisticated in their deal-hunting, as 92% of shoppers began research before the holiday season. This resulted in a 19% increase in conversion rates before Cyber Week, which may have led to heightened engagement into December.
Aside from the December upswing, clicks in 2024 followed the same trend as last year, with a seasonal dip in June and a rebound in July and August. This lift coincided with annual shopping events, such as Amazon Prime Day and Back-to-School.
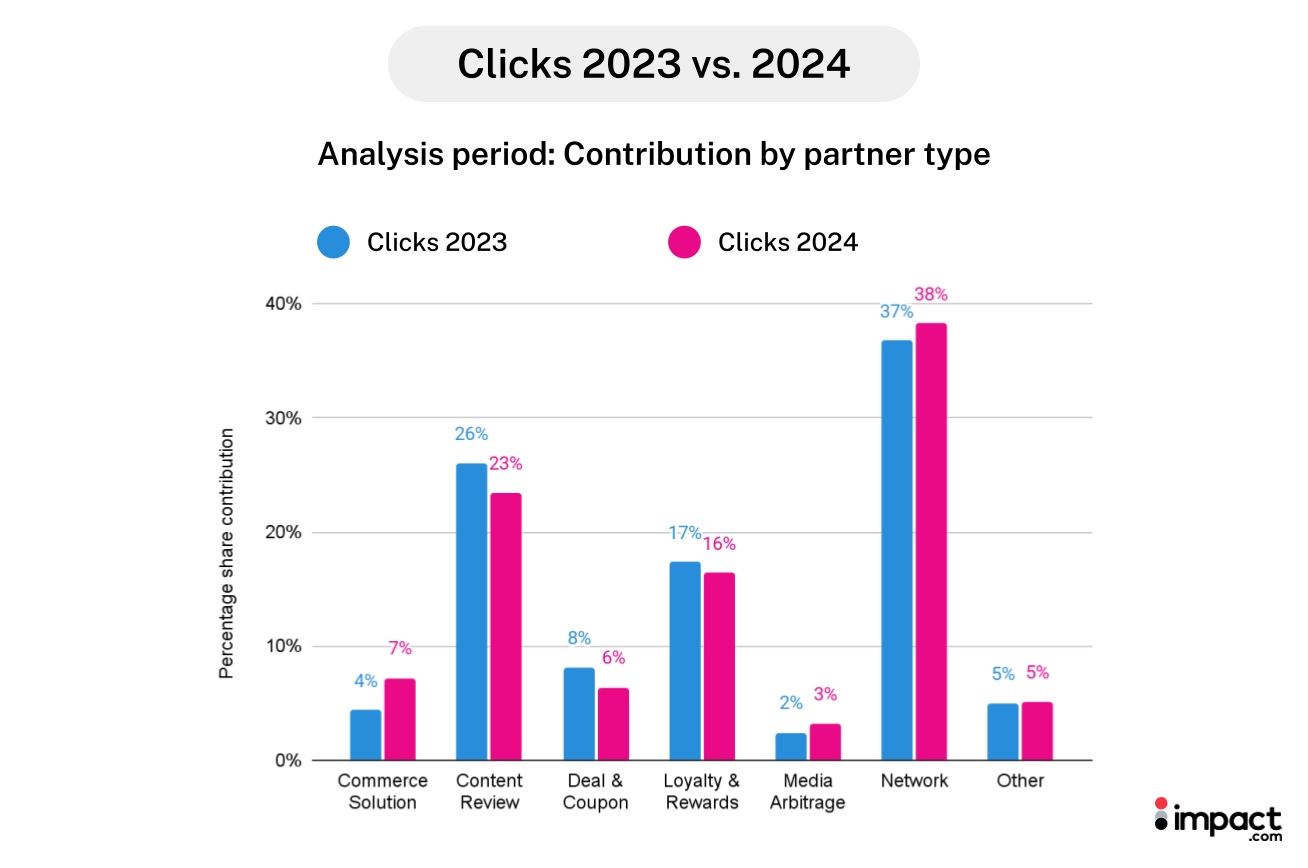
Partners continued to be rich sources of traffic for brands in 2024. Key drivers were Network Partners (contributing to 38% of clicks), Content Review Sites (23%), Loyalty and Rewards Partners (16%), and Commerce Solutions (7%).
2. Consumer confidence is on the rise as conversion rates increased by 6%
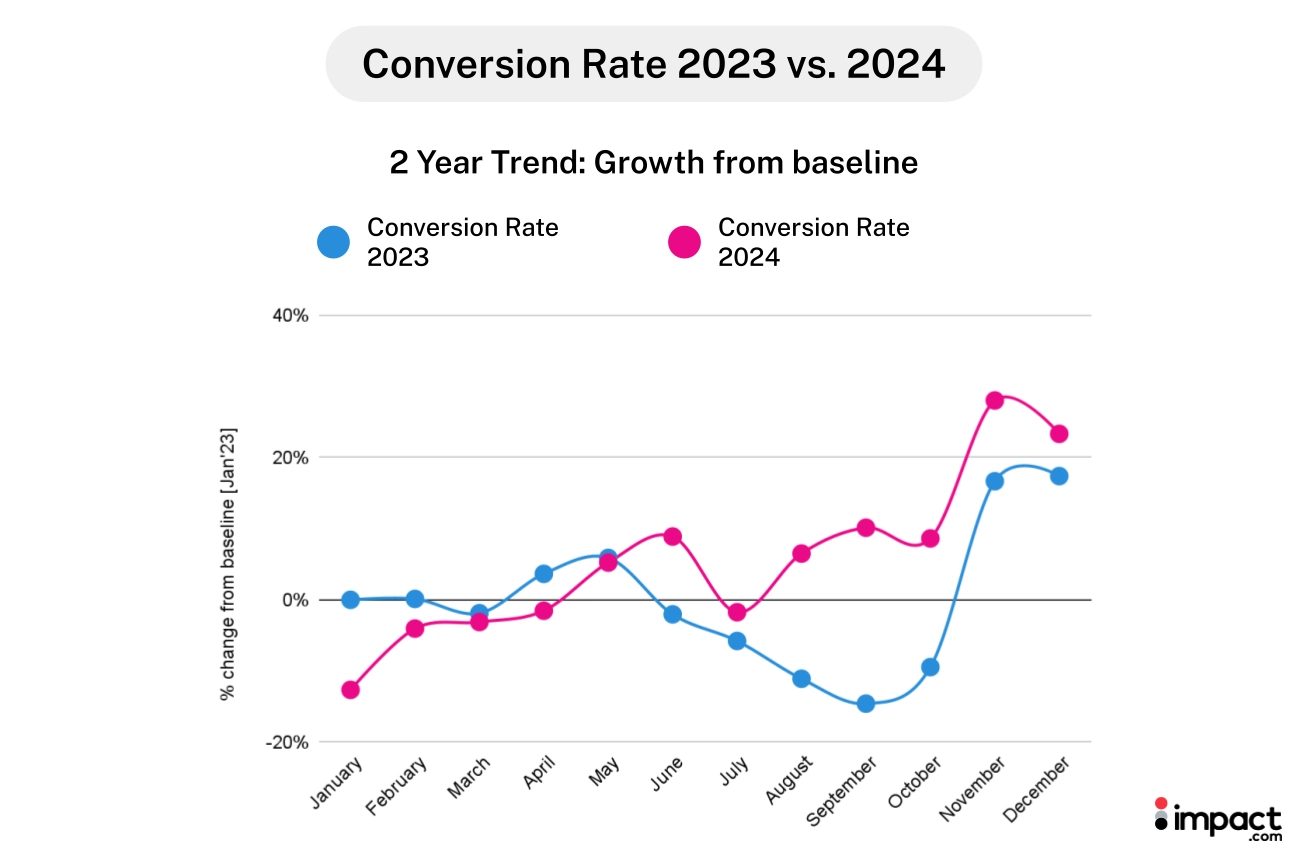
Conversion rates were 6% higher in 2024 than in 2023, signaling higher purchase intent among consumers.
Conversion rates have increased YoY, despite a slower start in Q1 2024 compared to Q1 2023. December 2024 saw 41% higher conversions than January 2024, showing growing consumer confidence.
While conversion rates peaked in November as expected, the June spike is interesting considering the drop in clicks. This may suggest that shoppers who did their research in March and May—as indicated by the higher click rates—were ready to buy in June.
This growing trend of thorough research is echoed in our joint study with eMarketer, which found that consumers typically research a product three times before purchasing. For 60.2% of customers earning over $250,000 annually, this rises to five or more research sessions before buying.
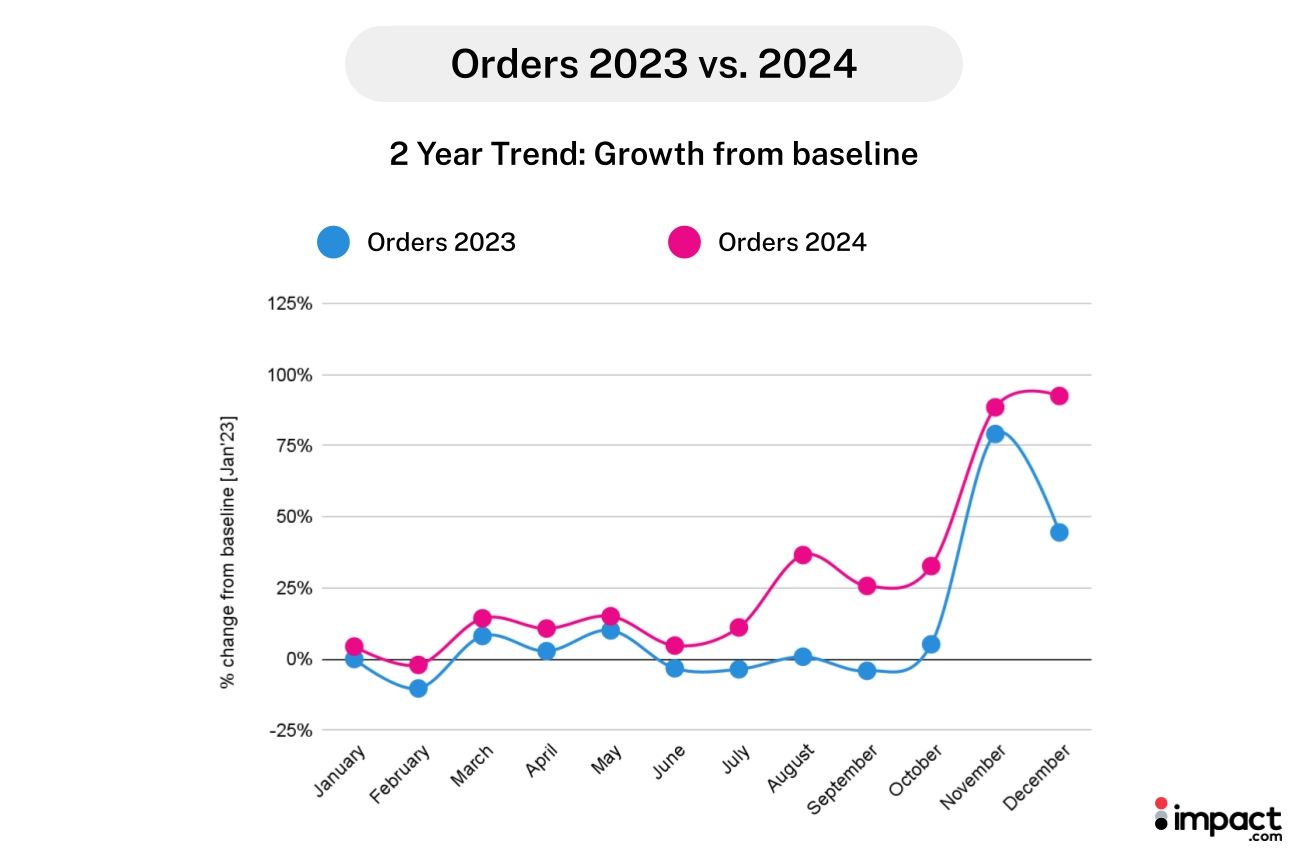
3. Orders increased by 37% from H1 to H2 in 2024
2024’s perfect duo of a 6% increase in traffic (clicks) and higher purchase intent resulted in 15% more orders compared to a year ago. Orders between August and October increased by 31% in 2024 compared to 2023. This is likely the result of Prime Day, Back-to-School, and Canadian Thanksgiving shopping events.
Consumers were more inclined to complete purchases later in the year. Orders jumped 37% in the second half of the year—much larger than the 19% increase during the same period in 2023. This significant growth in orders from H1 to H2 and higher conversion rates during this period indicate more intentional purchasing behavior, as mentioned earlier in this report.
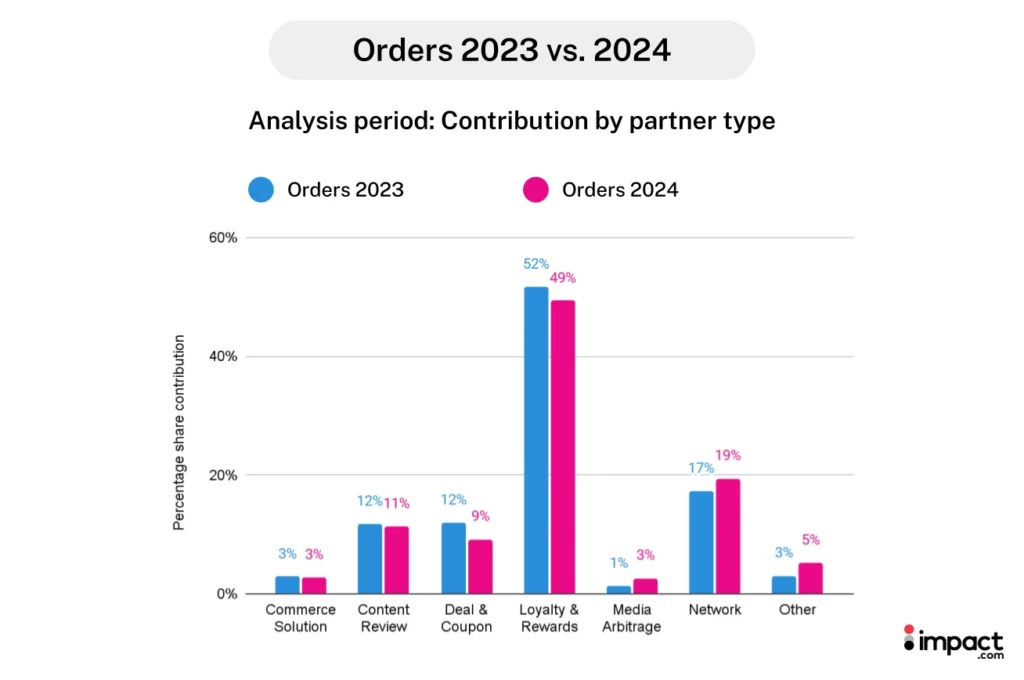
Partners continued to be strong contributors to orders. Nearly half (49%) of orders were attributed to Loyalty and Rewards partners, followed by Network Partners (19%) and Content Review sites (11%).
With 59.9% of consumers relying on online reviews and listicles in the research and decision-making phases, partners are an increasingly important part of the buyer’s journey.
4. Shoppers packed their carts but spent less per item
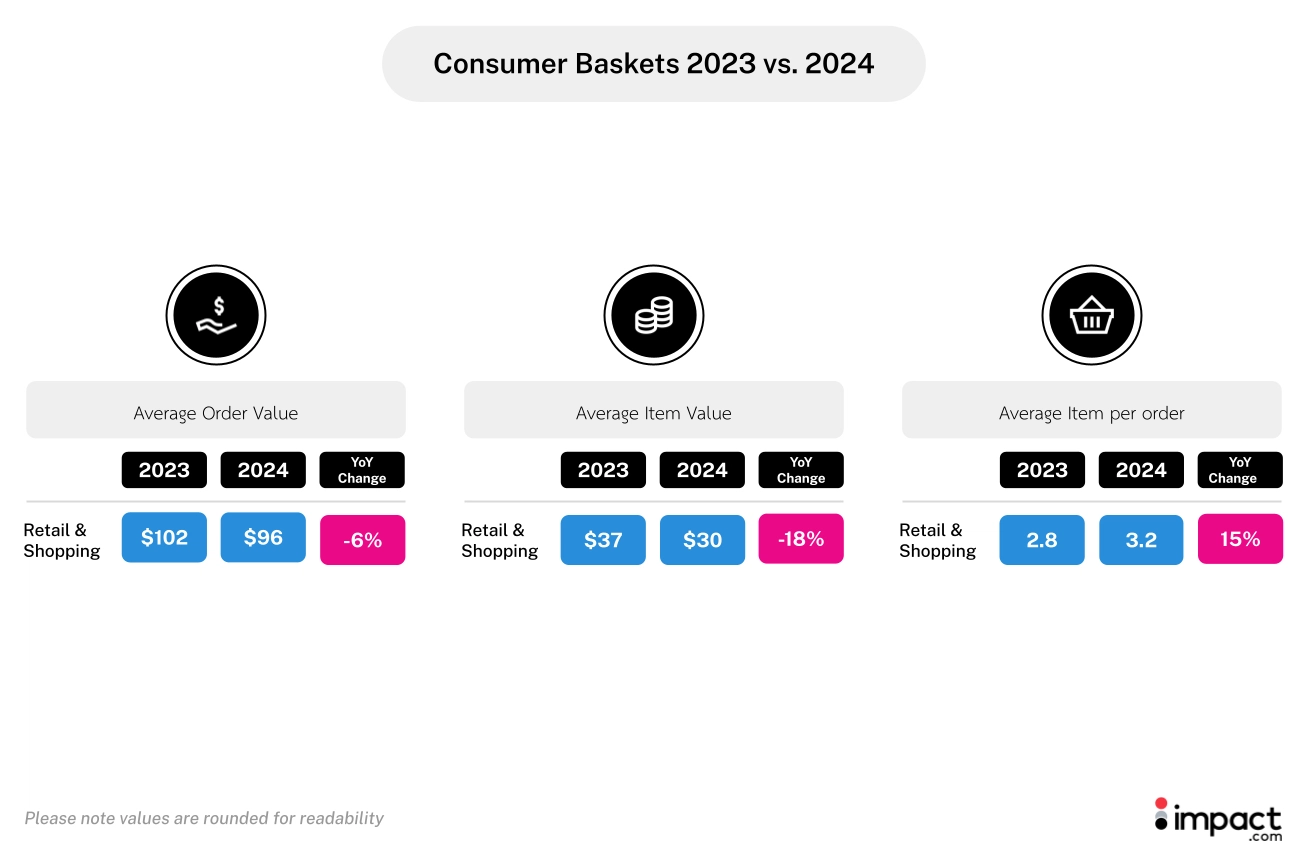
Consumers purchased 15% more items per order in 2024, but the average item value fell 18%, suggesting these orders consisted of lower-value goods. This resulted in a 6% decrease in average order value (AOV) for the year compared to 2023.
The 15% increase in items per order could be due to consumers postponing non-urgent or large purchases until better pricing is available. According to our research with eMarketer, 62.3% of consumers cited discounts as the primary purchase driver.
People likely shopped around for the best deals and promotions, delaying big-ticket buys until Prime Day, Cyber Week, and end-of-year sales.
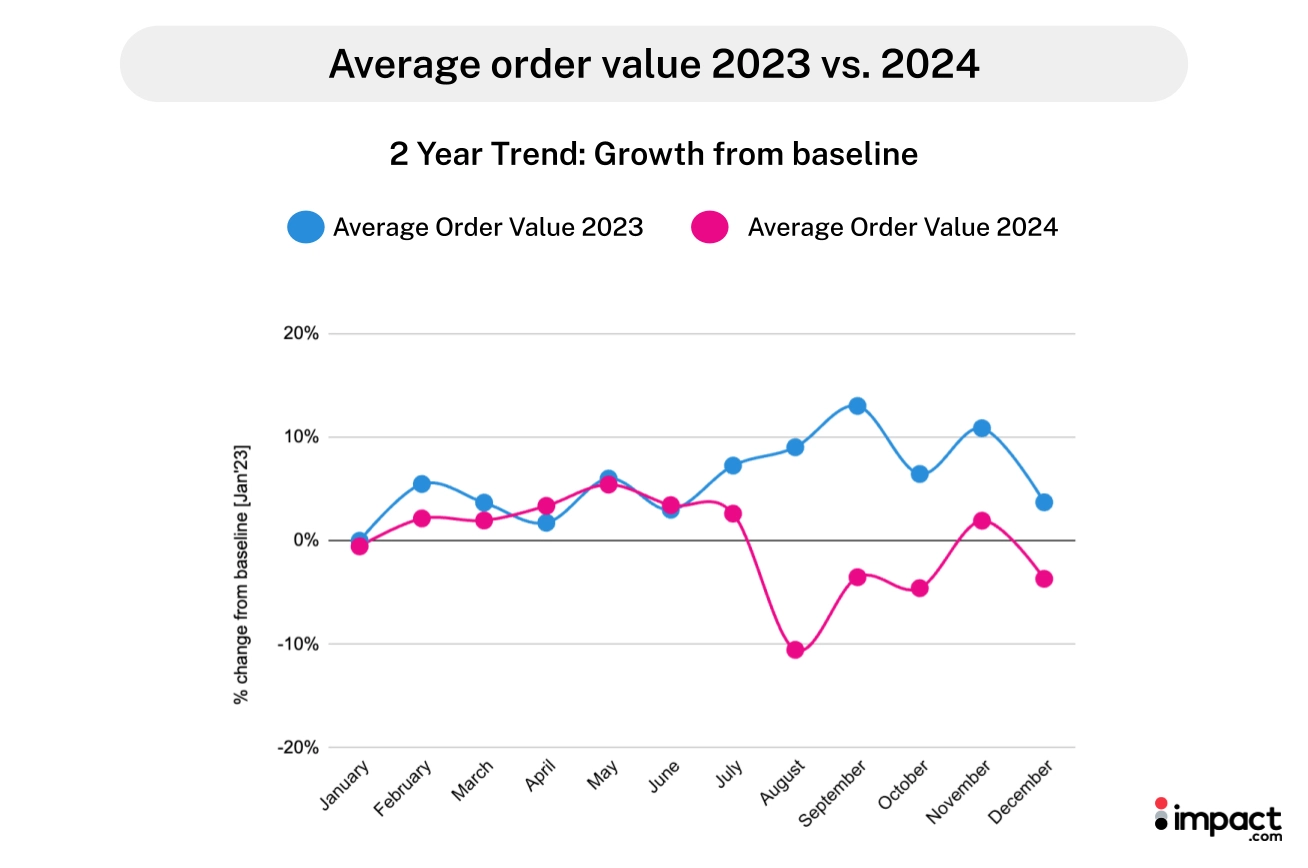
AOV fell significantly in the second half of 2024, particularly in August. This is likely due to heavy deals and promotions during back-to-school and end-of-summer events.
Product categories that saw a YoY jump in AOV:
- Health and Beauty (+19%)
- Arts and Entertainment (+17%)
- Flowers, Goods, Gifts, and Drinks (+12%).
Computer and Electronics experienced a 7% drop in AOV, likely due to consumers buying lower-value items (-6%) and slightly fewer items than in 2023 (-1%).
5. Consumers spend 8% more in 2024
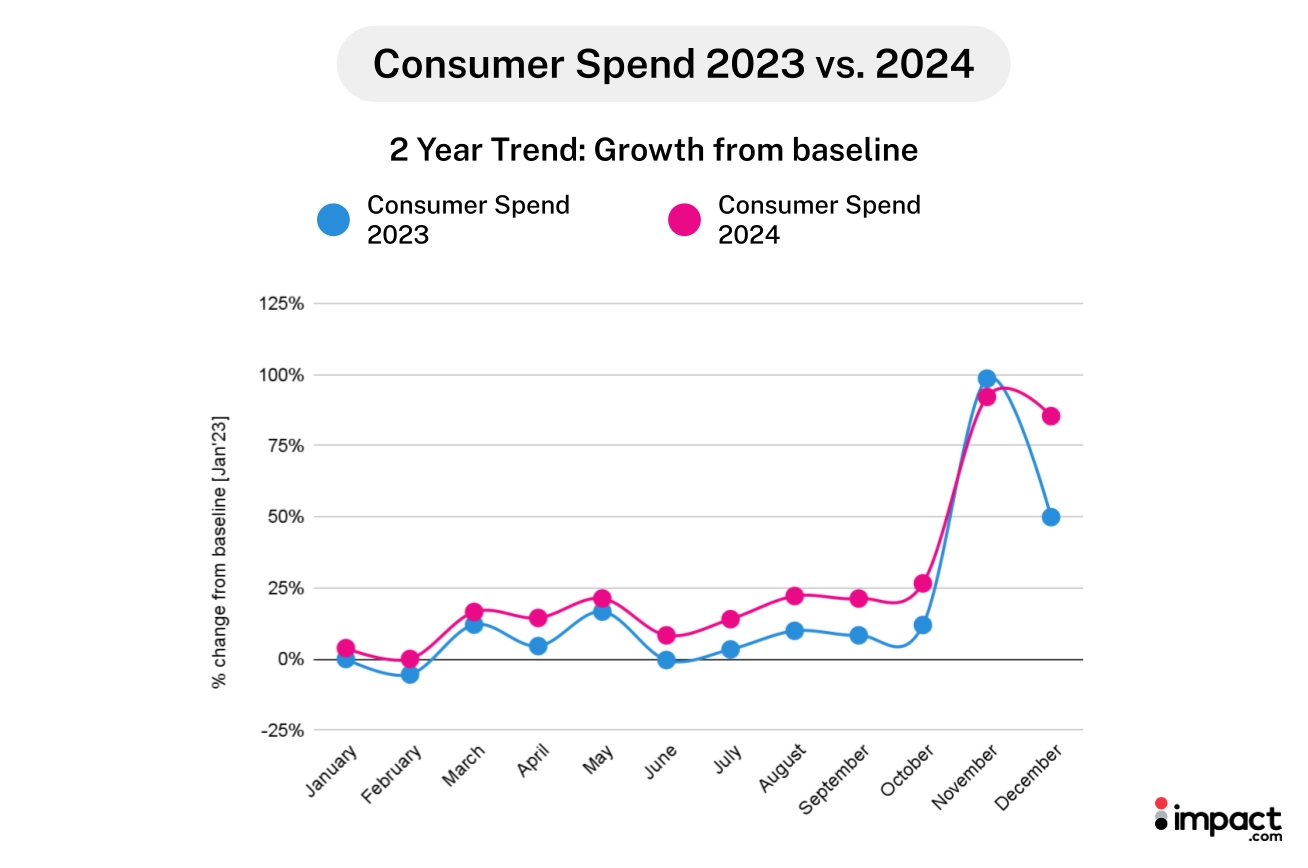
While consumer spend in 2024 mirrored 2023, consumers spent 8% more last year. A 15% YoY increase in total orders drove this growth, despite a 6% decline in average spend per order.
Q4 accounted for 33% of total annual consumer spending, emphasizing the dominance of holiday shopping. In contrast, Q1 spending was the lowest of the year, representing approximately 21% of the total.
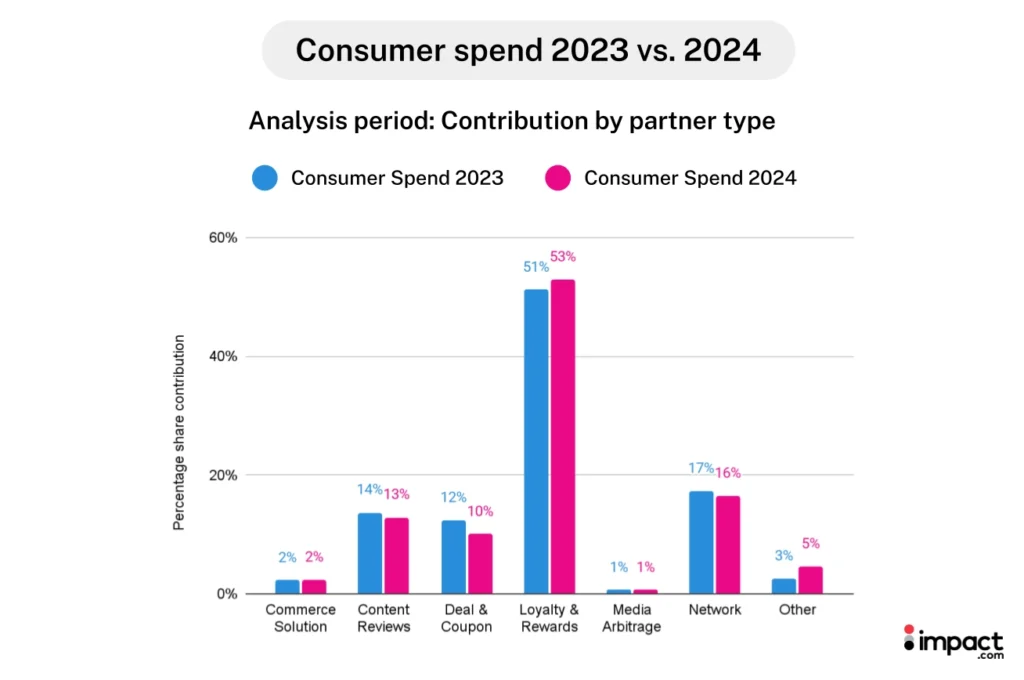
Loyalty and Rewards partners were the biggest contributors (53%) to consumer spend in 2024, showing themselves as an important touchpoint in the buyer’s journey. This was followed by 16% for Network Partners, 13% for Content Review partners, and 10% for Deal and Coupon partners.
6. Partnerships continue strong as brands increase commission payments by 11%
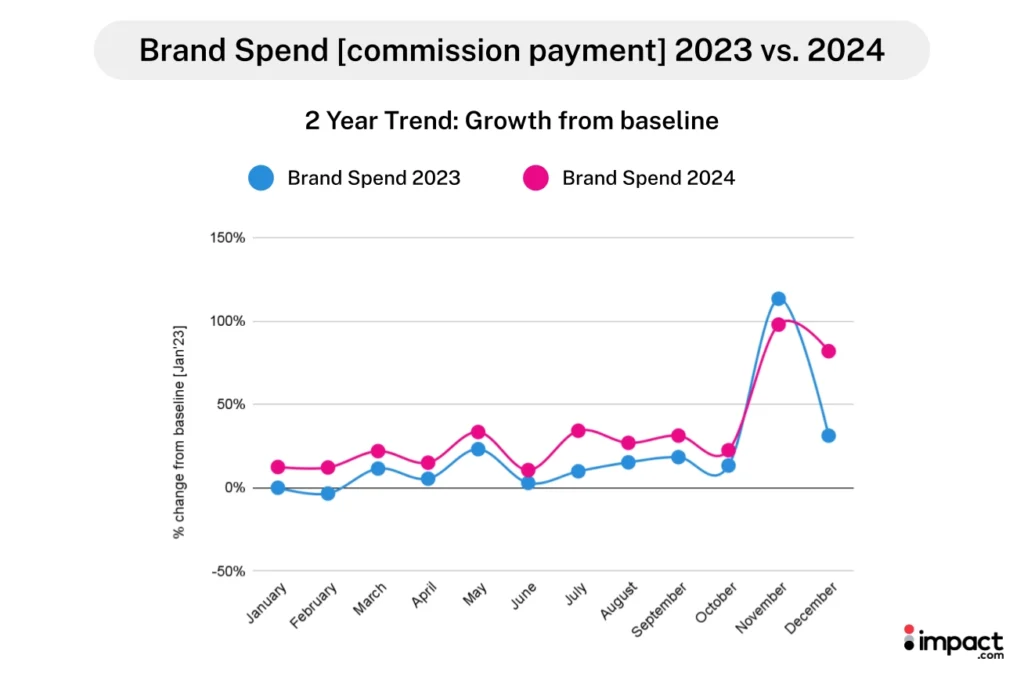
Commission payouts increased 11% YoY, as partners drove 15% more orders in 2024 and paid a 3% higher commission rate.
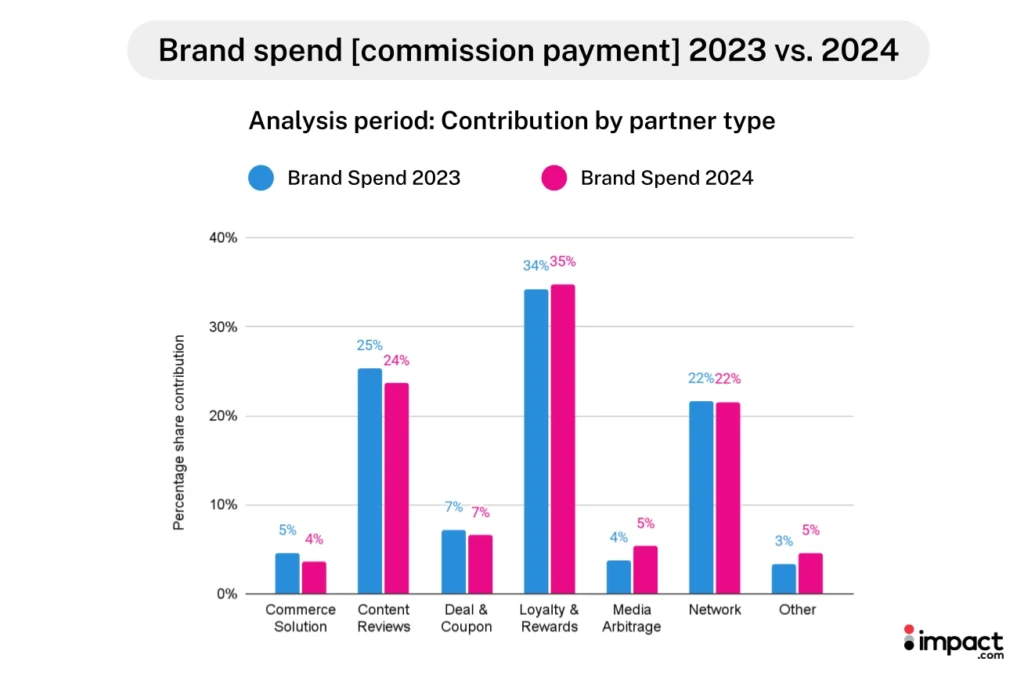
The largest percentage of commission payments were attributed to Loyalty and Reward partners, who earned 35% of brand commission spend. The next biggest recipients were Content Review Partners (24%) and Network Partners (22%).
Brands focused more on action-based compensation models in 2024. This type of payment represented 88% of total brand spending, up from 86% in 2023. The share of non-action compensation declined and represented 12% of total spend.
As partners continue to engage consumers at critical touchpoints in their purchase journey, it’s important to review and optimize the value they bring in 2025.
The research reveals significant opportunities to engage shoppers early and often. Now is the time to ensure the right partner mix to drive consumer interest and conversions.
Navigating a consumer culture fueled by research in 2025
The 2024 Industry Trends Benchmark Report revealed that despite increased consumer confidence, shoppers continue to shift towards more intentional shopping. Many people delay purchases for better pricing and rely heavily on partners to guide their decisions.
As shoppers increasingly research products and wait for the best deals, brands need to adjust their partnership strategies. Choosing the right partner mix can accelerate awareness and conversions, all while keeping consumers engaged until they’re ready to purchase.
Here are three ways to optimize your partner activities:
- Sustain interest throughout the year: Leverage Network Partners and Content Review sites—the partners proven to general clicks—early and often throughout the year.
- Generate excitement into the New Year: Enlist your partner ecosystem to continue holiday shopping momentum into the New Year, driving awareness and conversions for not-to-miss offers.
- Activate your customer journey across multiple touchpoints: Learn which channels buyers use across their journey and activate the appropriate partner types at each stage.
With renewed consumer confidence and openness to research deals throughout the year, 2025 looks set to be a banner year for brands.
Use this 2024 data as a guide to set your brand up for success. As a bonus, read our research with eMarketer for exclusive insights about 2025 consumer habits.
Discover more insights to shape your partnership marketing strategy:
- Multi-channel demand generation strategy: Your complete guide for 2025
- Top 10 referral marketing statistics for 2025 [+ actionable insights for your program]
- Mobile SEO in 2025: 5 critical steps to boost rankings and conversions
- Cyber Week 2024: how top brands achieved 23% higher conversion rates through strategic partnerships


