

The October 2024 Prime Big Deal Days event suggests renewed buying power and changing consumer behavior ahead of the holiday season.
Nearly a fourth (24%) of shoppers reported purchasing holiday gifts during the event, but irresistible deals also seem to have encouraged shoppers to make purchases outside of Amazon this October.
Brands that adapt their strategies to these trends, particularly in partnership marketing and multichannel approaches, will likely see stronger performance in the upcoming holiday shopping season.
Methodology
The impact.com October Prime Day research tracked and analyzed key metrics across thousands of North American brands in the Retail and Shopping industry on October 8 – 9, 2024 and compared them to last year’s sales on October 10-11, 2023.
The year-over-year (YoY) analysis compares how retailers and brands performed in response to Amazon’s Prime Day sale.
While the complete analysis of the Retail and Shopping vertical includes various product sub-categories, the following were highlighted for this report:
- Apparel, Shoes, and Accessories
- Arts and Entertainment
- Computers and Electronics
- Flowers, Gifts, Food and Drinks
- Health and Beauty
- Home and Garden
- Sport, Outdoor, and Fitness
Our analysis tracks key performance metrics: clicks, transactions, average order value (AOV), and consumer and brand spending. Researchers tracked these KPIs by comparing same-store, YoY data from brands that actively used the impact.com platform during the month leading up to these sales.
Implications for holiday season
- Consumer readiness: 24% of shoppers reported purchasing holiday gifts during the event, suggesting strong potential for upcoming Cyber Week sales.
- Spending patterns: Consumers are more willing to make purchases when they see good deals, rather than waiting for better prices.
- Partnership strategies: Brands should focus on diverse partnerships covering multiple channels to capitalize on impulse buying and showcase product benefits beyond price.
- Advertising approach: There’s an opportunity to spotlight products through advertising rather than solely promoting deals or sales.
4 must-know retail trends driving this year’s holiday sales
With so many economic changes, consumer buying behavior is changing by the minute. These October Prime Day trends offer brands more insight into what to expect this holiday season based on:
- How consumer behavior and spending changed in 2024 compared to 2023
- What to expect from shoppers leading up to the holidays based on their engagement with October Prime Day sales
- How brands can maximize partnerships to capture more attention moving forward
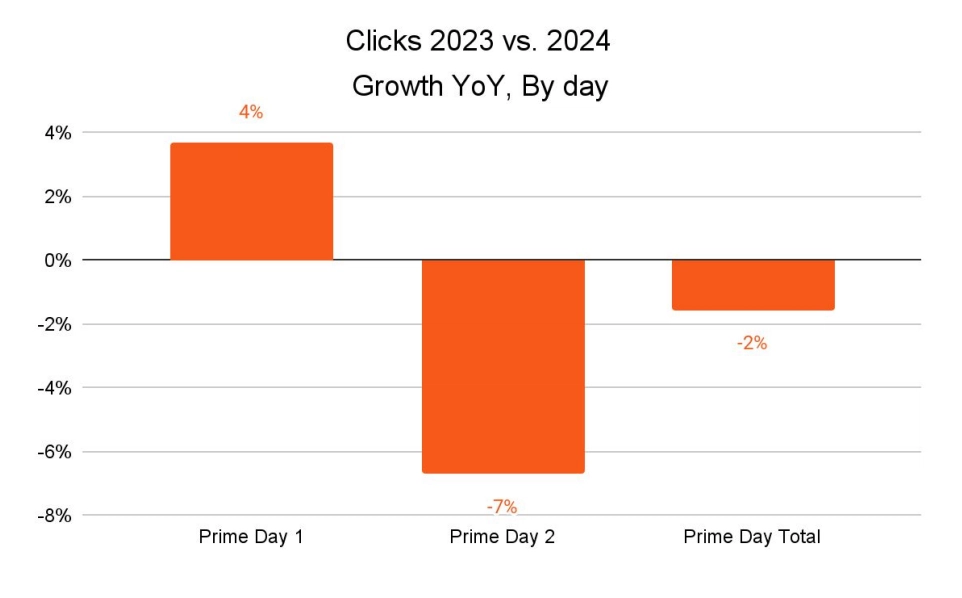
1. Fewer clicks suggest less price comparison
This year’s 2% drop in clicks during the October Prime Day event aligns with the 6% YoY drop seen during this year’s July event.
As inflation concerns wane, customers spend less time comparing prices and are more likely to jump on deals quickly. This may explain why clicks and transactions were up on Day 1 compared to Day 2.
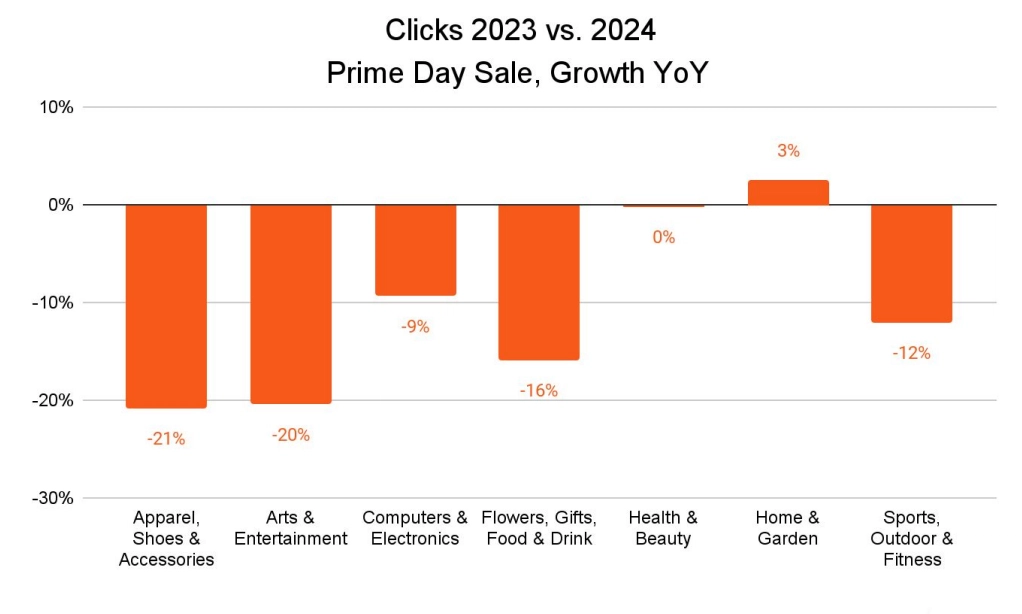
With the exception of Home and Garden brands, most brand categories saw 10-20% decreases in clicks. This may be because 46% of shoppers reported that they bought items they were waiting to go on sale, while 27% grabbed everyday items at lower prices.
Both patterns show that consumers are more willing to buy when they see something they want at a good price, rather than waiting for a better price like in previous years.
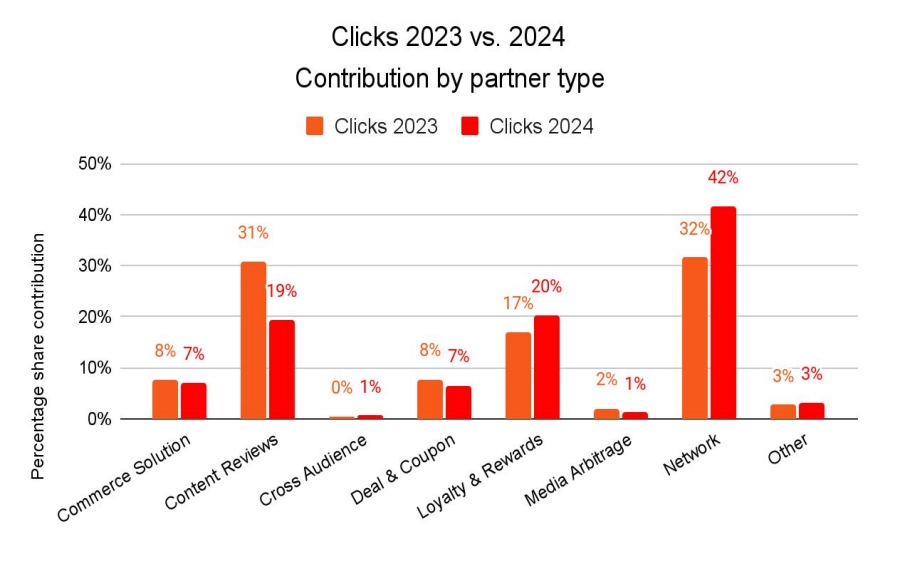
Clicks from content review partners dropped during the October sale, despite being the leading source for clicks during the July Prime Day event.
Content reviews took a back seat to network partners, which drove 42% of clicks this year—an increase from 2023. The increased clicks from network partners suggest a few possibilities:
- Consumers did less research and more impulsive purchasing this October compared to last year, or
- Shoppers did their research further ahead of time and knew how to spot a good deal on items this year
Loyalty and rewards partners—such as Klarna, BeFrugal, or TopCashbacks—saw a slight uptick during the October Prime Day event, indicating consumers are still looking for ways to save on pre-holiday spending.
Network partnerships are paying off for brands as consumers adopt more impulsive shopping habits. It’s not enough to create informative and trustworthy content anymore—brands need to focus on distribution to reach new customers.
Adjust your strategy this holiday season by:
- Work with partners to create diverse content types—such as high-quality images, videos, and interactive elements—to reuse in multiple advertising campaigns to create a multi-touch, omnichannel strategy.
- Reward brand advocates for creating authentic user-generated content (UGC) that shows strong social proof for your brand.

Arhaus uses UGC from influencer partners, such as Christal Hedgepeth, to broaden their reach and deepen trust in their brand.
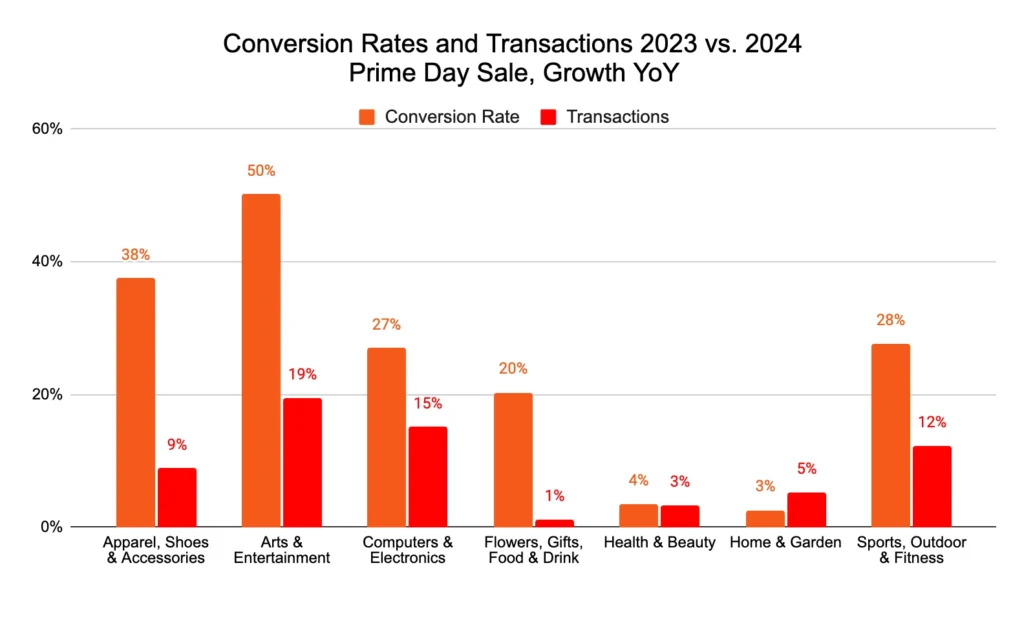
2. More transactions and conversions show shoppers were ready to spend
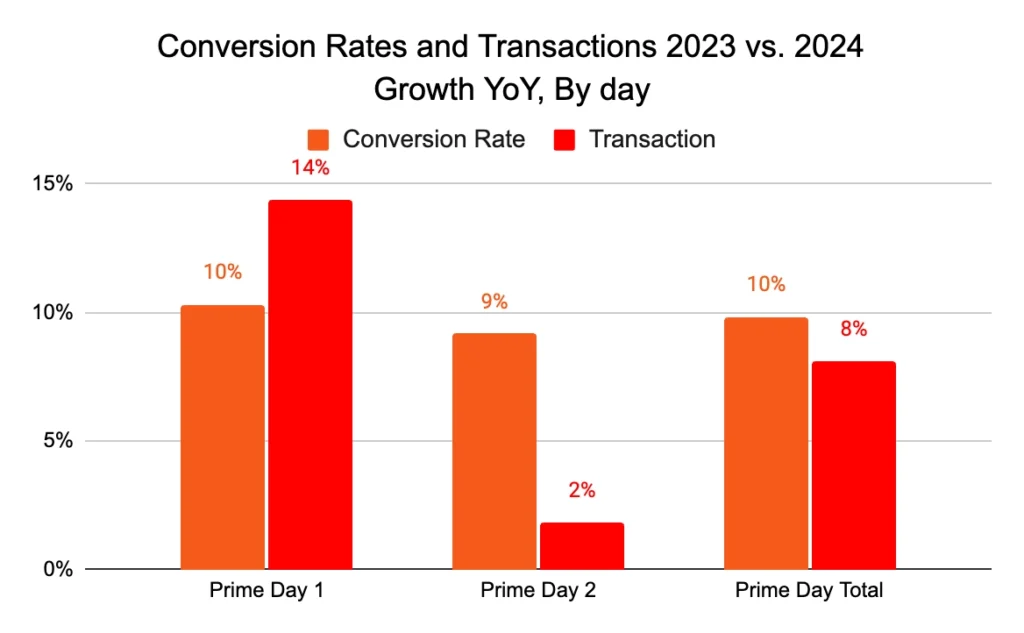
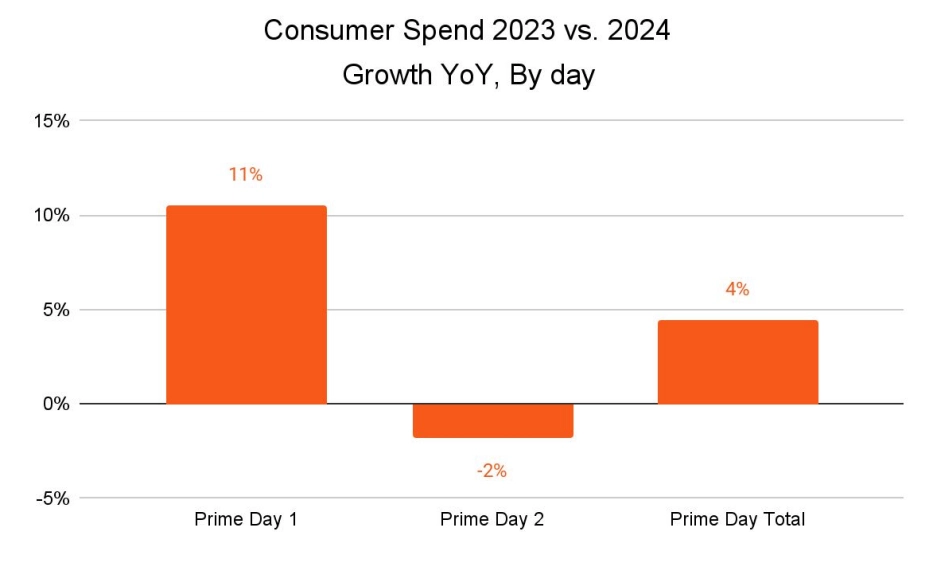
Unlike July’s Prime Day event, shoppers didn’t wait for better deals on day two. Instead, shoppers completed 14% more transactions on day one, driven by a 10% increase in conversions.
Transactions increased 8% YoY, though only 2% more transactions happened on day two compared to 2023. However, day two conversions were still up 9% YoY.
This reiterates that shoppers came ready to buy on both days, without as much concern for shopping around.
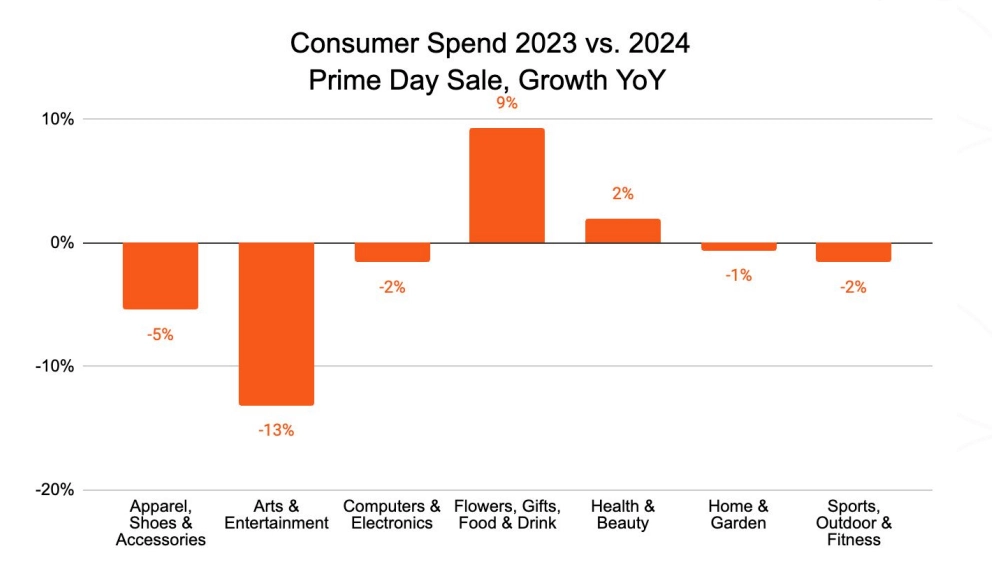
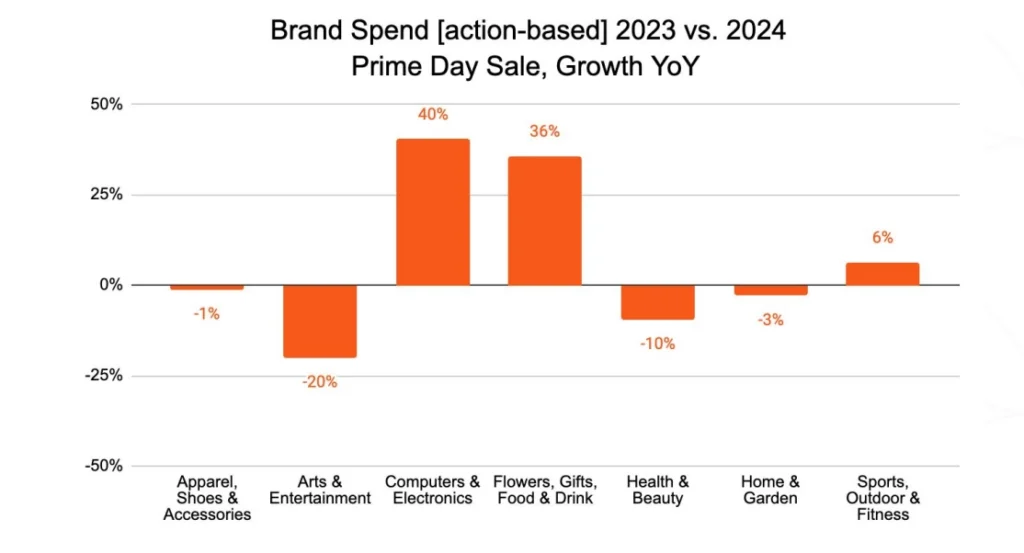
Brand categories like Arts and Entertainment saw a huge performance boost this year, receiving 50% more conversions YoY and 19% more transactions.
Meanwhile, Computer and Electronics brands saw a 27% boost in conversions and 15% more transactions, while Sports, Outdoor, and Fitness brands experienced 28% more conversions and 12% more transactions.
Shoppers have historically waited for notable shopping events to get the best deals on Computers and Electronics—even when budgets were tight.
The increases in Arts and Entertainment and Sports, Outdoor, and Fitness purchases tell a different story. These purchases are often seen as splurges that people considered less essential in recent years. However, the recent uptick in these sales suggests higher consumer confidence going into the holiday season.
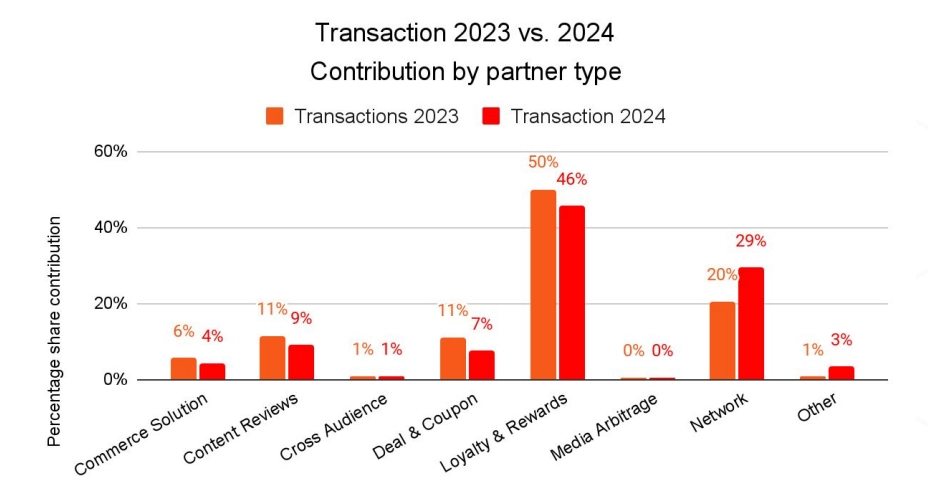
While loyalty and reward partners still drove the majority of transactions, network partners saw a significant increase in transactions this year. This reveals that more shoppers are clicking on ads and referral links—even without the promise of additional rewards like cashback.
As the holiday season approaches, shoppers may be more likely to splurge on advertised products instead of actively searching for savings opportunities. This suggests a shift in brand focus, with brands concentrating more on spotlighting products through advertising rather than promoting deals or sales.
Elevate your partnership marketing strategy by:
- Capitalize on impulse buying by simplifying the checkout process and incorporating upsell opportunities, countdown timers, and flash sales to create urgency.
- Form diverse partnerships that cover multiple channels—including live shopping events, unboxing videos, limited edition product access opportunities, and how-to content—to feature product benefits beyond price.
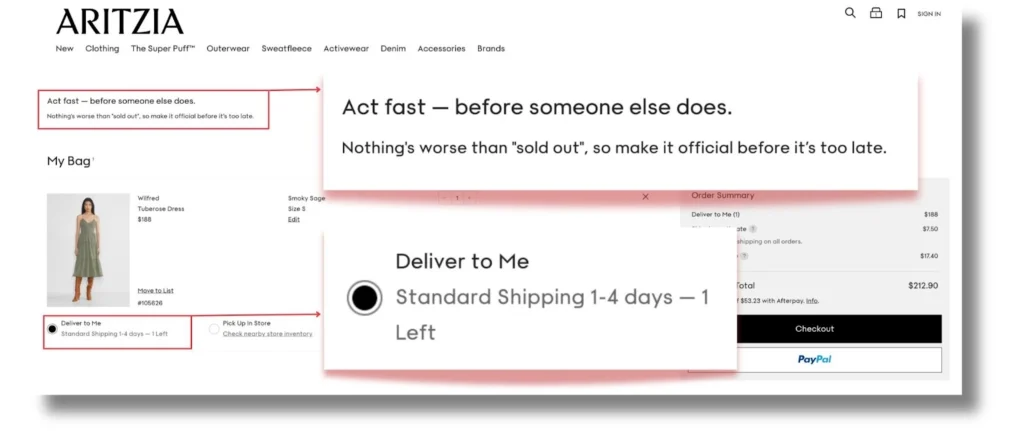
Aritzia creates a sense of urgency during checkout by urging customers to complete their purchase before items sell out. They also highlight how many items are left in stock.
3. Higher-value purchases resulted in lower average order values (AOV)
Consumers seem less concerned about stocking up during sales in 2024. A 3% dip in AOV and 11% fewer items per transaction show shoppers are buying higher-value items per transaction despite 8% higher item costs.
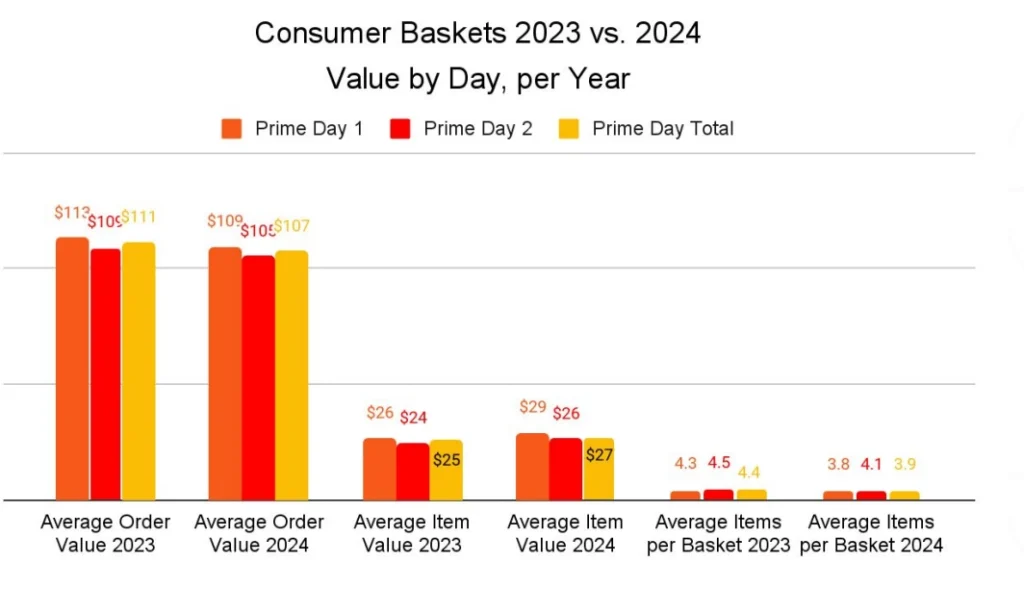
Like July’s event, October’s 8% boost in transactions implies that shoppers made multiple purchases over the two-day sale rather than one large purchase. These additional transactions led to a 4% YoY increase in consumer spending despite a lower AOV.
Unlike July’s event, shoppers didn’t wait to see if day two deals would be better than day one. Consumer spending increased 11% on day one and dropped -2% on day two.
This suggests that shoppers used the October event to capture deals on high-ticket items as they arose instead of searching for the best deal.
Strong discounts may have also driven lower AOV during the Prime Big Deal Days. For example, Computer and Electronic brands saw a 14% dip in AOV despite a 10% boost in average item value. This may exemplify how shoppers are jumping on higher-value items this year based on compelling deals.
Interestingly, purchases from Flowers, Gifts, Food and Drinks brands saw an 8% boost in AOV and 18% more items per transaction. This may reflect that shoppers are using the October sale for holiday gift purchases instead of everyday needs or personal shopping.
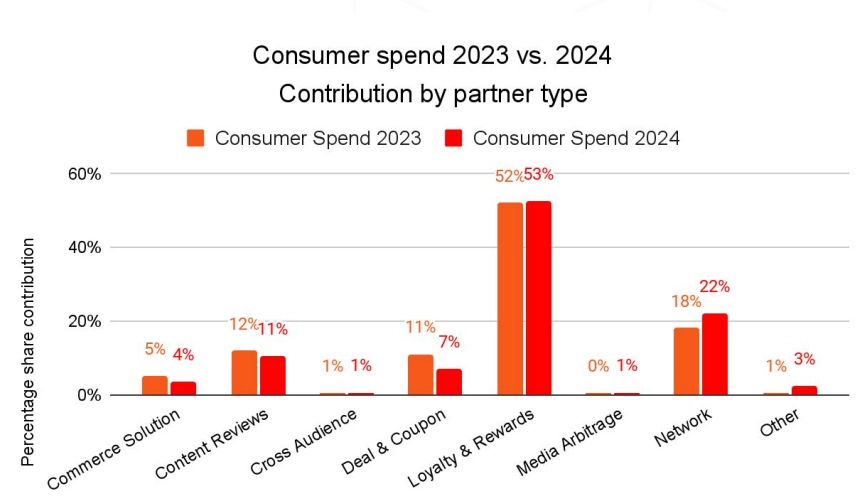
While consumer spend by partner type remained largely the same YoY, network partners saw an increased contribution to consumer spending.
Shift your strategy by:
- Prioritize offering strong deals on smaller items or bundling items to boost AOV, capturing shoppers who want to buy accessories and add-on items to their larger purchases before the holidays.
- Work with partners to highlight big-ticket items and relevant smaller items that can enhance functionality or customer experience.
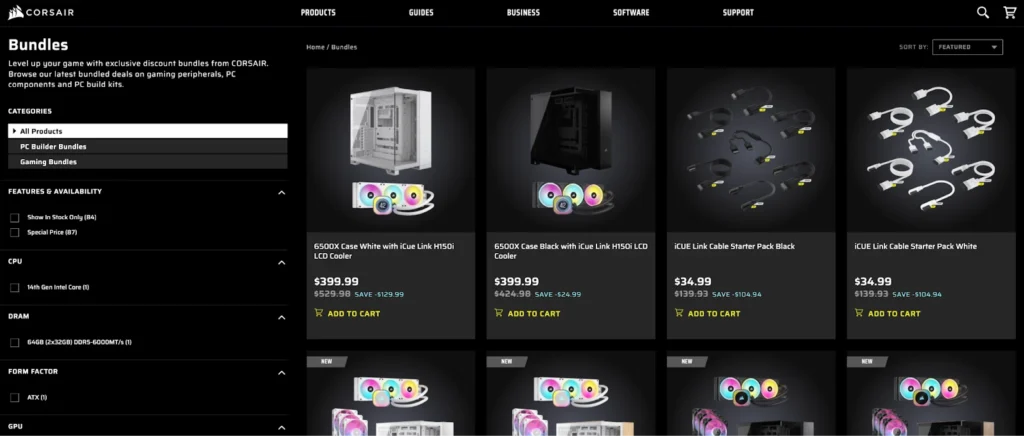
Corsair provides compelling product bundle deals that motivate customers to spend more and keep coming back to enhance their existing purchases.
4. More network partnerships led to higher commission costs
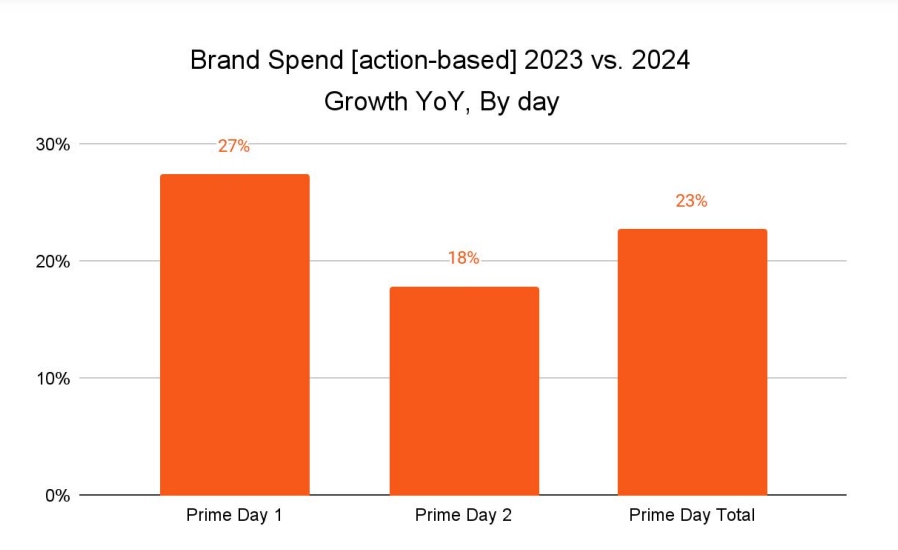
Strong partner performance wasn’t the only thing driving the 23% YoY increase in action-based brand spending this year.
An 18% increase in commission payout rates significantly increased advertising costs during the October Prime Day event.
Loyalty and rewards partners continue to drive the most action-based brand spending while providing marginally higher consumer spending. Brands also spent more on network partners to drive impressive clicks, transactions, and consumer spending results.
The focus on network partnerships shows a significant departure from how brands promoted their products during the July Prime Day sales, where brands only spent 11% of their budget on network partnerships.
In July, brands spent more on action-based spending for content review partners, while review commissions dropped YoY during the October sale.
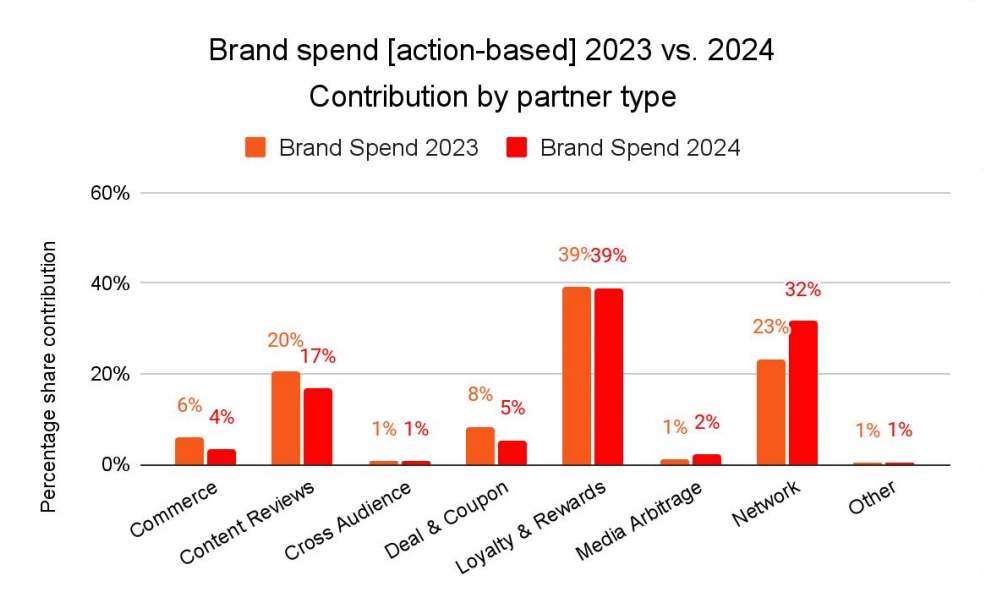
However, other partner types provided value in different parts of the customer journey. For example, content review partners drove only 9% of transactions and 11% of consumer spend, but were accountable for 19% of all clicks. This indicates that they offer an effective channel for increasing brand awareness ahead of sales events.
Content review partners also accounted for 17% of brand spend. This suggests that brands are still willing to reward these awareness-driving partners, even if they don’t directly impact sales.

Interestingly, sharp inclines in transactions for Arts and Entertainment and Sports, Outdoor, and Fitness brands don’t correspond to significantly higher action-based spending.
However, the 15% increase in transactions for Computer and Electronics brands led to a substantial 40% boost in brand spending. Meanwhile, increases in Flowers, Gifts, Food, and Drink brands resulted in 36% higher action-based spending.
Upgrade your partnership marketing strategy by:
- Expanding to new or underutilized partner types to maximize reach.
- Implement action-based spending with multiple kinds of partners to reward performance for desired actions throughout the purchase funnel.
Prepare for the possibility of a strong holiday shopping season
Even so soon after the iconic July Prime Day event, sales around Amazon’s October Prime Big Deal Days showed consumers are ready to start splurging again.
As economic turmoil eases, impulsive spending becomes more common, creating new opportunities for brands to connect with customers. Use these insights to prepare for a successful holiday shopping season and maximize Cyber Week sales performance.
Discover more insights to shape your partnership marketing strategy: