

Consumer behavior shifted dramatically in the first half of 2025. Morgan Stanley predicts a slowdown in consumer spending growth, projecting it to decline from 5.7% in 2024 to 3.7% this year.
Despite economic headwinds, including the majority of consumers (32%) already changing their spending habits due to looming tariff rates, our analysis of 1,554 North American retail brands reveals consumers aren’t retreating—they’re researching.
Clicks increased 18% and orders rose 12%, yet spending grew just 0.4%. Conversion rates declined 5% as purchase journeys extended, but total order volume still increased. Partnership ecosystems diversified as loyalty programs lost their share of orders to commerce solutions and deal and coupon platforms.
The data reveals four concrete strategies for adapting to research-driven consumers and capitalizing on extended purchase journeys. Brands already implementing these approaches capture market share, while others struggle with traditional metrics that no longer reflect consumer reality.
Methodology
The impact.com market research team conducted this mid-year industry benchmark study in July 2025, analyzing year-over-year (YoY) performance metrics across 1,554 North American brands in the Retail and Shopping vertical.
The study focused on same-store brands using the impact.com platform during both analysis periods to ensure accurate comparisons. Data covers January 1 through June 30, 2025, compared to the same period in 2024.
Key performance metrics analyzed
- Clicks: Total unique clicks generated
- Orders: Total completed transactions
- Consumer spending: Total revenue generated
- Conversion rates: Percentage of clicks that resulted in completed orders
- Average order value (AOV): Average dollar amount per completed transaction
- Commission payouts: Expenditure that occurs when brands pay their partners a commission for a specific, predefined action
Partner types included in the analysis
| Network partners | Publisher platforms that broker access to brand campaigns and provide tracking, reporting, and payment services. This includes publishers categorized as network, syndication blog networks, or cost per action (CPA) networks. |
| Content review partners | Publishers that produce editorial content to promote, compare, and list products and services. This includes premium publishers, shopping comparisons, financial comparisons, content, bloggers, etc. |
| Loyalty and rewards partners | Publisher platforms that incentivize transactions from consumers, employees, or businesses through a membership or benefits reward program. |
| Deal and coupon partners | Publishers who aggregate and classify deals and promotions for consumer savings. |
| Commerce solutions | Site-side shopping tools and services that drive conversion optimization for brands. |
| Media arbitrage | Search engine, social, or programmatic marketers who manage keyword campaigns for brands, often on a performance basis. |
| Cross-audience monetization | Businesses that publish offers, content, and complementary products to current customers or audiences (e.g., exit traffic, improved UX) to drive incremental revenue. |
Data quality and comparability
All metrics reflect same-store performance to eliminate the impact of brand additions or departures from the platform. The values shown throughout this report reflect the percentage change relative to the baseline value from January 2024.
Interpreting the graphs

This analysis provides insights into consumer behavior trends and partnership performance shifts, offering a comprehensive view of industry dynamics during the first half of 2025.
Consumer spending stays steady as research behavior intensifies
Consumer behavior in the first half of 2025 reveals a clear shift in how people approach purchasing decisions.
Our analysis of 1,554 North American retail brands shows clicks increased 18% and orders rose 12% YoY, yet consumer spending grew just 0.4%.
This disconnect between engagement and expenditure signals a new consumer reality. People are browsing more, researching longer, and purchasing with greater intention. The data shows they’re not buying less—they’re buying more deliberately.
The new consumer calculus
The metrics reveal three key patterns:
Higher engagement, controlled spending: The difference between click growth (18%) and spending growth (0.4%) shows consumers are actively shopping while exercising financial discipline.
Volume over value: Orders increased 12% while AOV dropped 10%. Consumers are making more purchases at lower price points, suggesting planned shopping behavior rather than impulse buying.
Extended consideration: The increase in browsing activity without proportional spending growth indicates longer research periods before purchase decisions.
What this means for performance marketers
The 2025 consumer represents change, not retreat. Higher click volumes combined with controlled spending create more touchpoints throughout extended purchase journeys. The opportunity lies in supporting this research-driven behavior rather than trying to compress it back into impulse-driven patterns.
Our data shows consumers remain willing to spend—they want validation that purchases deliver genuine value. The brands succeeding in this environment adapt their engagement strategies to support longer, more complex purchase journeys while maintaining consistent touchpoints throughout the research process.
Conversion rates decline as purchase journeys extend
Conversion rates dropped 5% YoY in the first half of 2025, but this decline tells a story of consumer empowerment rather than disengagement. The data reveals shoppers are taking more time to research, compare prices, and validate purchases before buying.
The decline accelerated through Q2 of 2025, with conversion rates falling 5% from April to May and 16% from May to June. This sharp Q2 decline reflects seasonal budget allocation, as consumers likely preserved spending for summer experiences while continuing to browse and research products online.
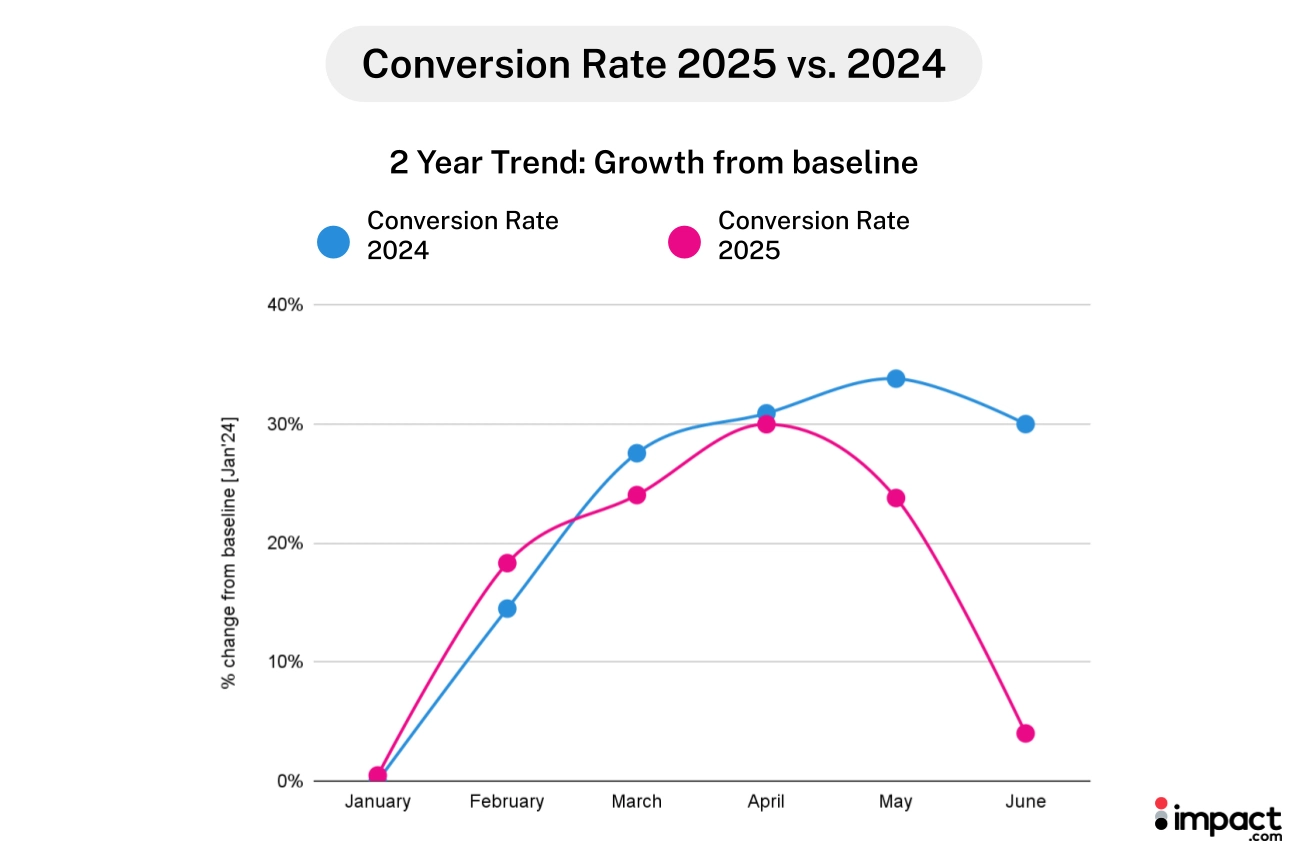
Conversion rates dropped 5% YoY in H1 2025, with a 16% dip from May to June.
The research-driven purchase journey
Despite lower conversion rates, total orders increased 12% thanks to sustained click growth. The data reveals a longer, more complex path to purchase:
- Conversion rates: Down 5% YoY
- Total orders: Up 12% YoY
- Click volume: Up 18% YoY
Consumers visit multiple sites, read reviews, compare prices, and wait for promotional opportunities before completing transactions. This extended research behavior is clearly visible in our partner contribution data.
Traditional quick-conversion channels saw their influence decline, while platforms that support product research and price comparison gained ground.
January surge reveals promotional opportunity
January delivered the strongest performance of any month, with orders exceeding 2024 levels by 36%. This surge likely reflects the convergence of post-holiday promotions, gift card redemptions, and pent-up demand from extended Q4 research cycles.
January’s strong performance highlights that increased clicks drove higher conversion volumes, even though conversion rates remained consistent YoY. The key opportunity lies in supporting the research process to drive these moments of engagement.

In H1 2025, orders rose by 12% YoY.
Seasonal budget patterns emerge
The 2025 Q2 conversion decline reveals calculated budget management.
Consumers appear to redirect spending toward summer experiences—travel, entertainment, and outdoor activities—while maintaining product research behavior. They browse and add items to wish lists but delay purchases until budget priorities shift.
This seasonal pattern creates predictable opportunities for marketers who can time their engagement accordingly. Q2 becomes a relationship-building period, while Q1 and potentially Q3 offer higher conversion potential.
Key implications for marketers
Lower conversion rates paired with higher order volumes signal successful adaptation to research-driven behavior rather than campaign failure. The brands winning in this environment support longer consideration periods with educational content, comparison tools, and retargeting strategies that nurture prospects through extended decision-making cycles.
Success now requires multi-month thinking, rather than single-session focus. The opportunity lies in staying present throughout the research journey, not just optimizing the final purchase moment.
Deal and content partners double market share as loyalty programs decline
The partnership ecosystem shifted dramatically in the first half of 2025, reflecting consumer demand for validation and value discovery throughout extended purchase journeys. Traditional loyalty programs lost ground, while deal and coupon aggregators gained significant influence.
The most notable changes in order attribution:
- Loyalty and rewards partners: 45% → 28% of total orders
- Deal and coupon partners: 9% → 18% of total orders (doubled contribution share)
- Network partners: Remained steady at ~24% of orders
- Content review partners: Maintained ~14% of orders, but captured the largest commission share (26%)
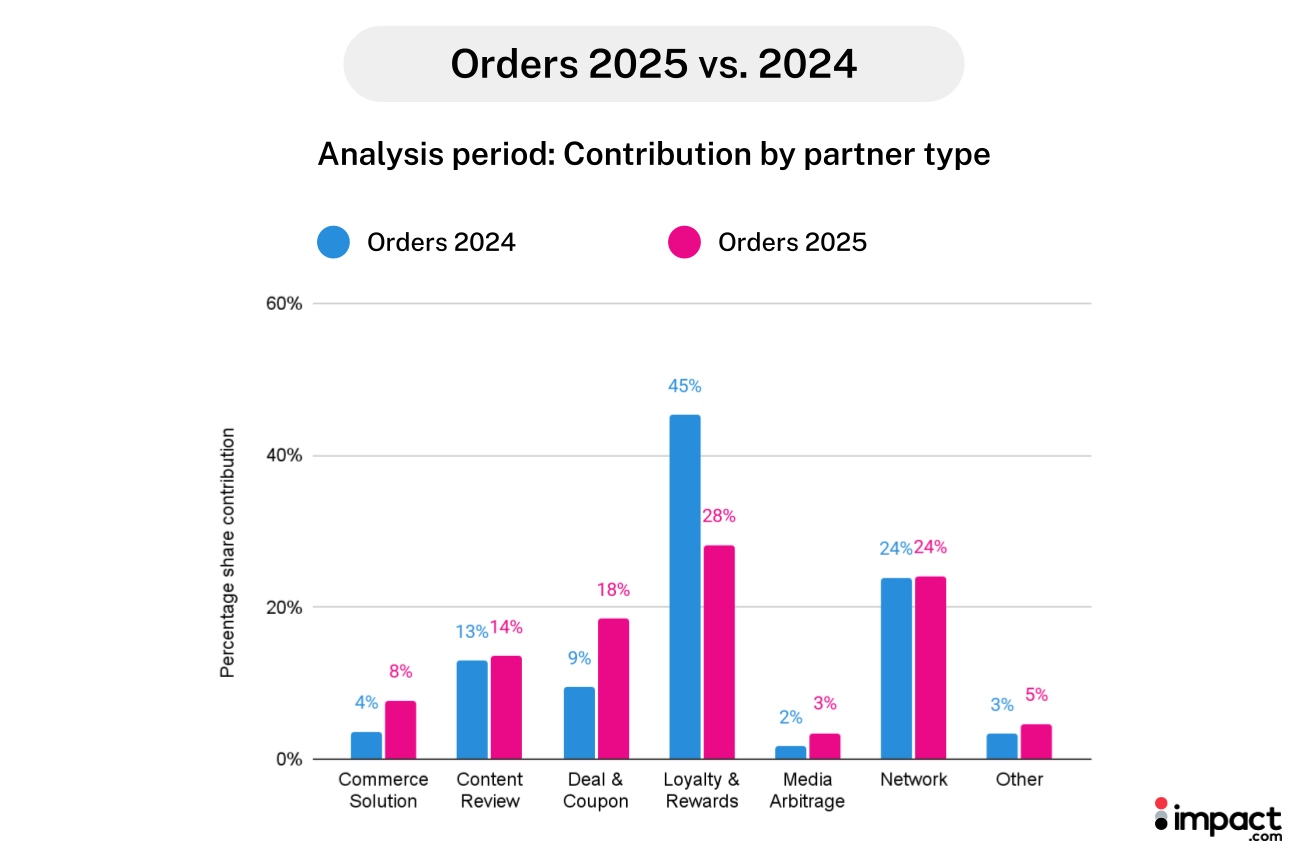
Loyalty partner share dropped from 45% to 28%, while deal and coupon partners rose from 9% to 18%.
Commission distribution reveals new priorities
The commission payout data tells an even more compelling story about where brands are directing their partnership investments:
- Content review partners: 26% of total commission payouts (largest share)
- Loyalty and rewards partners: 21% of payouts
- Network partners: 21% of payouts
- Deal and coupon partners: 14% of payouts (doubled from the previous year)
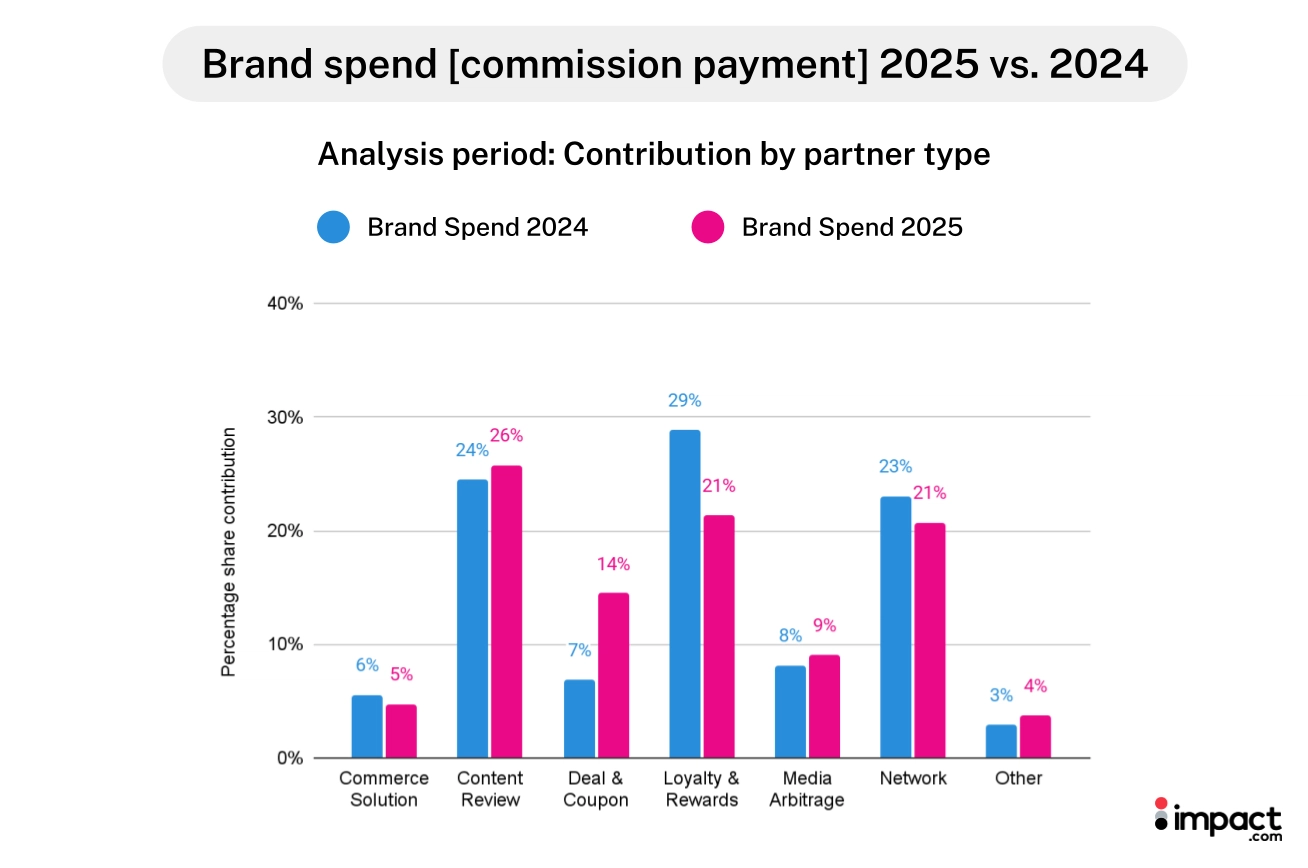
Content Review partners claimed the largest portion of total payouts, securing an impressive 26% share.
Content review partners—those who produce editorial content, product comparisons, and buying guides—captured the largest share of commission payments. This shift indicates brands are investing heavily in partners who support the research phase of consumer decision-making.
Why the partnership mix changed
The partner mix evolution aligns directly with the extended purchase journeys we identified in conversion data. Consumers spending more time researching purchases naturally gravitate toward partners who provide educational content, price comparisons, and deal validation.
Deal and coupon partners saw dramatic growth because they serve a dual purpose in the new consumer journey: They provide the price validation consumers seek while offering the promotional trigger needed to convert extended research into actual purchases. Their contribution doubled not just in orders, but across almost all metrics we tracked.
Content review partners gained commission share because they support the lengthened consideration phase. When consumers take more time to research, they consume more editorial content, product comparisons, and expert reviews. Brands responded by increasing their investment in these relationships.
Network and loyalty partners adapt their role
While loyalty programs lost share, they remain significant contributors at 28% of orders and 21% of commission payouts. The decline reflects consumers’ broader research behavior rather than loyalty program failure. Customers still value rewards and exclusive access, but they’re no longer the primary discovery mechanism.
Network partners maintained consistent performance at 24% contribution of orders, while increasing their share to clicks from 38% to 48%, demonstrating their continued importance in the partnership ecosystem. Their stability suggests they’ve successfully adapted to support longer purchase journeys while maintaining their traditional strengths.
Strategic implications for partner portfolio management
The data reveals that successful brands diversified their partner mix rather than doubling down on single channel types. The most effective approach appears to be building complementary partnerships that support different stages of the extended consumer journey.
Early research phases benefit from content partnerships that provide education and comparison tools. Mid-journey validation comes through deal platforms that offer price transparency and promotional opportunities. Final conversion often involves traditional loyalty or network partners who provide the closing incentive.
This evolution suggests that partnership strategies now require thinking about the entire consumer journey, rather than just the final conversion moment. The winning approach supports research-driven consumer behavior through diverse touchpoints instead of trying to compress decisions back into single-session conversions.
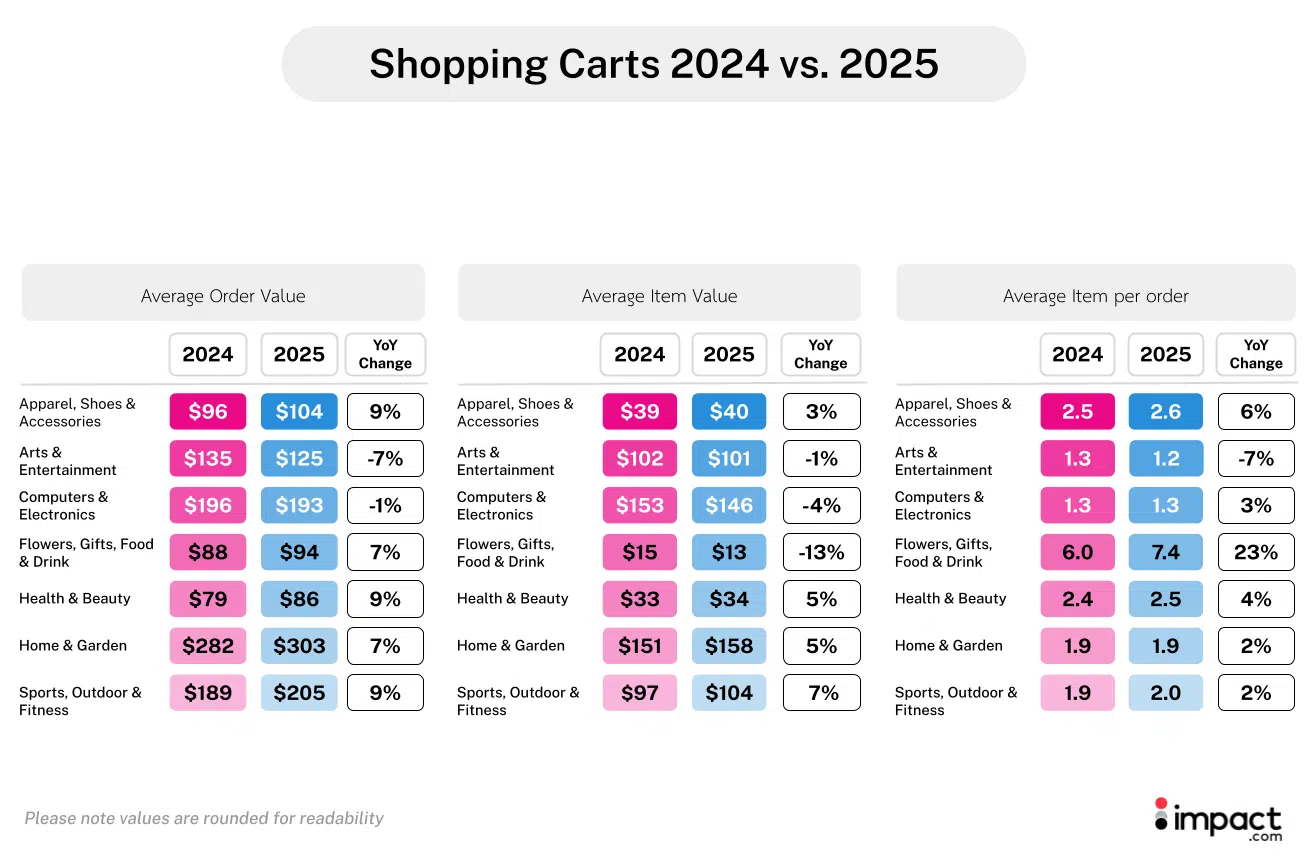
Essential categories outperform discretionary spending across all metrics
Category performance in the first half of 2025 reveals clear consumer priorities: Essential and lifestyle purchases maintained strong growth, while consumers cut back on discretionary categories. This divide reflects how consumers allocate their more careful spending decisions across different product types.
Essential and lifestyle categories saw higher AOV, with several categories seeing significant increases in AOV despite the overall 10% AOV decline:
Categories with AOV growth:
- Health & Beauty: +9%
- Sports, Outdoor & Fitness: +9%
- Apparel, Shoes & Accessories: +9%
- Home & Garden: +7%
- Flowers, Gifts, Food & Drink: +7%
Categories where AOV declined:
- Arts & Entertainment: -7%
- Computers & Electronics: -1%
Essential and lifestyle items saw higher conversion rates and order volumes compared to discretionary purchases.
Conversion rates tell a different story
Conversion rate data reveals the complexity of consumer behavior and purchase intent across categories:
Categories where conversion rates increased:
- Arts & Entertainment: +22%
- Home & Garden: +14%
- Apparel, Shoes & Accessories: +2%
Categories where conversion rates declined:
- Computers & Electronics: -13%
- Health & Beauty: -18%
Arts & Entertainment’s +22% conversion rate increase paired with -7% AOV decline suggests higher consumer purchase intent for buying entertainment products, but at lower price points. This indicates a shift toward smaller, more affordable entertainment purchases, rather than major discretionary spending.
Understanding the category dynamics
The Health & Beauty category exemplifies the new consumer approach: Despite 16% higher click volume, conversion rates dropped 18%. However, AOV increased 9% YoY. This pattern suggests consumers are researching beauty and wellness products extensively before purchasing, but when they buy, they’re investing in higher-quality and purchasing multiple items per order.
Computers and Electronics showed slower performance this year. Despite 3% click growth, 13% lower conversion rates compared to last year resulted in fewer orders YoY. High-consideration, expensive items like electronics face headwinds in an environment where consumers are more price-sensitive.
Home & Garden saw significantly higher purchase intent this year as conversion rates increased 14% YoY. Despite fewer clicks and orders compared to last year, consumers who were in the market to purchase spent 7% more on average per order. These consumers purchased more items per order, at higher item values. The results indicate that brands in this category successfully adapted to research-driven consumer behavior while maintaining pricing power.
Category-specific consumer behavior patterns
The data reveals three distinct consumer behavior patterns by category type:
1. Essential/wellness categories (Health & Beauty): High engagement, extensive research, premium purchasing when converting. Consumers invest time in research but buy more and better quality products.
2. Home/lifestyle categories (Home & Garden, Apparel, Shoes & accessories): Higher consumer purchase intent indicated by higher conversion rates. Brands in these categories successfully capitalize on higher purchase intent despite lower click volumes, encouraging upsells to those in the market to buy (higher item values + more items per order to increase AOV).
3. Discretionary spending saw lower order values YoY. However, this is also nuanced based on the general value of the items:
Arts and Entertainment, typically lower-ticket items, saw higher purchase intent by consumers in the market to buy, indicating that perhaps they weren’t doing such intensive research as seen with Computers and Electronics. Despite higher intent, they purchased lower-valued items and added fewer items to their cart.
Computers and Electronics, typically higher-priced items, saw lower purchase intent as consumers conducted more research. Consumers spent less on their overall orders despite adding more items to their carts, as the items they were purchasing were of lower value compared to last year.
Strategic implications by category
Category performance suggests marketers need differentiated approaches based on consumer behavior patterns rather than applying universal tactics. Essential categories benefit from educational content that supports extended research, while discretionary categories may need stronger promotional strategies to overcome purchase hesitation.
The data indicates that successful categories either support consumer research behavior effectively (such as Health & Beauty) or maintain purchase intent momentum despite economic pressures (such as Home & Garden). Categories struggling to adapt to longer research cycles and consumer purchase behavior face the most significant headwinds.
4 partnership strategies for research-driven consumers
The data from the first half of 2025 points to four critical adjustments performance marketers must make to succeed with research-driven consumers. These strategies address the longer purchase journeys, partner mix changes, and category-specific behaviors we’ve identified.
1. Build multi-touch attribution for extended journeys
The 18% increase in clicks, combined with conversion rates declining 5%, resulted in orders increasing only 12%. These data points point to longer research periods. This means consumers interact with multiple touchpoints before converting, resulting in traditional last-click attribution models no longer capturing the full customer journey.
Implementation priorities:
- Track engagement metrics for longer periods to capture the full customer journey
- Weigh early-journey touchpoints that influence final purchase decisions
- Measure partner contribution throughout the research phase, not just at conversion
- Account for seasonal variations in journey length (Q2 extensions vs Q1 acceleration)
The January 36% YoY order surge demonstrates that when extended research culminates in purchase decisions, the volume impact can be significant. Attribution models must capture the partners and all the touchpoints that support this extended consideration process.
2. Diversify partner portfolios beyond loyalty programs
The shift from loyalty-dominated partnerships (45% to 28% contribution of orders) to a more balanced ecosystem creates opportunities for brands willing to adapt their partner mix.
Portfolio rebalancing priorities:
- Expand deal and coupon partnerships: Their doubled contribution (9% to 18% of orders) reflects consumer demand for price validation
- Invest in content partnerships: Content review partners captured 26% of commission payouts, the largest share of any partner type
- Maintain loyalty program value: Despite reduced share, 28% contribution to total orders still represents a significant impact
- Leverage network partner stability: Their 48% contribution to total clicks and consistent ~24% contribution share to orders, provides a reliable performance foundation
The most successful brands in our data built complementary partnerships that support and meet the customer at different stages in their purchase journey, rather than concentrating investment in a single partner type.
3. Optimize promotions for seasonal budget cycles
The 16% conversion rate decline from May to June in Q2 of 2025 reveals a predictable seasonal budget allocation that creates both challenges and opportunities for promotional timing.
Seasonal optimization approach:
- Q1 promotional intensity: Capitalize on January’s 36% YoY order growth with aggressive promotional campaigns
- Q2 relationship building: Use slower conversion periods for content creation, educational partnerships, and brand building
- Budget cycle alignment: Time major promotional pushes around consumer budget reallocation periods
- Category-specific timing: Align promotional calendars with category performance patterns
Understanding that Q2 represents research and relationship building rather than conversion failure allows marketers to optimize their strategies for different phases of consumer budget cycles.
4. Create category-specific value messaging
The varying performance between essential and discretionary categories requires different strategies. Essential categories, such as Health & Beauty and Sports, Outdoor & Fitness, are experiencing lower conversion rates and increases in AOV YoY. In contrast, discretionary categories, like Computers and Electronics, show lower conversion rates and AOV, while Arts & Entertainment demonstrate higher conversion rates and lower AOV.
Category strategy framework:
For essential/wellness categories:
- Support extensive research with educational content and comparison tools
- Emphasize quality and long-term value over promotional pricing
- Partner with content creators who provide expert guidance and reviews
For home/lifestyle categories:
- Balance conversion optimization with value proposition messaging
- Leverage the 14% YoY conversion rate growth in Home & Garden to increase orders and spending of buyers in the market
- Focus on practical benefits and immediate utility
For discretionary categories:
- Address the 13% YoY conversion rate decline in Computers and Electronics with stronger promotional strategies that encourage bundle deals and complementary products for those in the market to buy.
- Capitalize on their patterns of adding more (even though lower-valued items) to their cart.
- Create urgency around lower-priced items in Arts & Entertainment
- Use social proof and limited-time offers to overcome purchase hesitation
FAQs
Consumers are spending “smarter, not less,” and are prioritizing value over volume. They are taking longer to make purchases, which has led to lower conversion rates. While clicks and orders increased, overall consumer spending remained nearly flat at +0.4% year-over-year. Shoppers are buying more items per order. However, they are choosing lower-valued items, causing the overall average order value to drop by 10%.
Conversion rates dropped by 5% year-over-year, and this indicates that shoppers are taking a longer time to make a purchase. Consumers are doing more research and comparing prices before buying, which extends the buyer’s journey. For marketers, this means the path to conversion is less linear and includes more touchpoints. Marketers can adapt by emphasizing value, leveraging data for personalized offers, and diversifying their partnerships to reach cautious, value-driven shoppers at every stage of their purchase journey.
The average order value (AOV) dropped by 10% year-over-year. However, the number of items per order increased by 4%. This “strategic cart filling” shows that consumers are choosing lower-priced items to maximize value. They might be doing this to get free shipping, unlock bundle deals, or simply feel a sense of accomplishment by securing multiple deals in one transaction.
Essential and lifestyle categories, such as Apparel, Health & Beauty, Home & Garden, and Sports, Outdoor & Fitness, are outperforming discretionary items in terms of shopping cart sizes (average order values). For example, Health & Beauty and Sports, Outdoor & Fitness both saw a 9% rise in average order value. On the other hand, discretionary categories like Arts & Entertainment and Computers & Electronics experienced a decline in average order value.
Brands are shifting to a more balanced and diversified partner mix. The contribution of deal and coupon partners nearly doubled, rising from 9% to 18% of total orders. Content review partners are the biggest commission earners at 26%, while loyalty and rewards partners’ share of total orders dropped from 45% to 28%. This shift reflects a move to engage consumers across every stage of the buying funnel with various partners.
Measuring success in the new environment
Success metrics must evolve to reflect research-driven consumer behavior. Total order growth paired with conversion rate decline isn’t campaign failure—it’s successful adaptation to longer purchase journeys.
Revised success indicators:
- Multi-touch journey completion rates over single-session conversions
- Partner portfolio balance and contribution diversity
- Seasonal performance optimization across budget cycles
- Category-specific engagement and conversion patterns
The brands thriving in this environment:
- Adapt to and support consumer research behavior rather than fighting it
- Build diverse partnership ecosystems that serve different journey stages
- Optimize their strategies around predictable seasonal and category patterns
A look ahead
As we head into the second half of 2025, the trends identified in this analysis are likely to accelerate. Economic pressures may persist, but consumer engagement remains strong. The competitive advantage will go to brands that view longer purchase journeys as an opportunity rather than an obstacle.
The four strategies outlined in this report—multi-touch attribution, diversified partnerships, seasonal optimization, and category-specific approaches—provide a framework for capitalizing on research-driven consumer behavior.
The brands implementing these strategies are positioning themselves to capture market share as these behavioral patterns become the new standard.
Explore more ways partnerships can boost your performance in 2025:
- How to increase affiliate conversions: 5 research-backed strategies for content creators (2025) [blog]
- The modern customer journey: New research 2025 [Webinar]
- The convergence strategy: Transforming affiliate and influencer channels to accelerate growth [Research report]
- Creator economy vs influencer marketing: Why smart brands are making the switch in 2025 [blog]
- Evaluating influencer performance in 2025: 3 ways brands can optimize ROI through real-time tracking [blog]
- Navigating oversaturation with meaningful partnerships [podcast]
- Beyond basic tracking: 5 data-driven strategies to transform your affiliate program’s ROI [blog]