
2025 Industry Benchmark Report
Affiliate performance looked different in 2025. Traffic was up. Shoppers were clicking through partner links at record levels, especially during Q4. But conversion rates dipped, and transactions declined despite all that activity.
For program managers watching their dashboards, the disconnect was hard to ignore. High click volume usually signals demand. But clicks were up 2% year-over-year (YoY) while transactions dropped 5% YoY. Conversion rates fell 6% YoY.
If shoppers weren’t buying right away, what were they doing with all those clicks?
It turns out they were researching, comparison shopping, and building carts. Customers were monitoring prices across multiple partners and waiting for the right moment to pull the trigger. And when they finally converted, they did it strategically—consolidating multiple items into a single, higher-value purchase.
Consumer spending fell just 1% YoY despite fewer transactions because shoppers weren’t buying less. They were buying differently.
Adobe Analytics captured the same behavior at scale. The five days from Thanksgiving through Cyber Monday accounted for more than 17% of total online holiday spending between November 1 and December 31, 2025.
Demand didn’t evaporate—it compressed into narrow windows after extended research periods.
We tracked this pattern all year. Our Prime Day, mid-year benchmark, October Prime Day, and Cyber Week reports each documented parts of the whole picture. This annual benchmark analysis brings it all together.
We analyzed 2,368 North American retail brands across the full 2025 calendar year and compared it with 2024 to understand how the buyer journey reshaped affiliate performance—and what it means for programs heading into 2026.
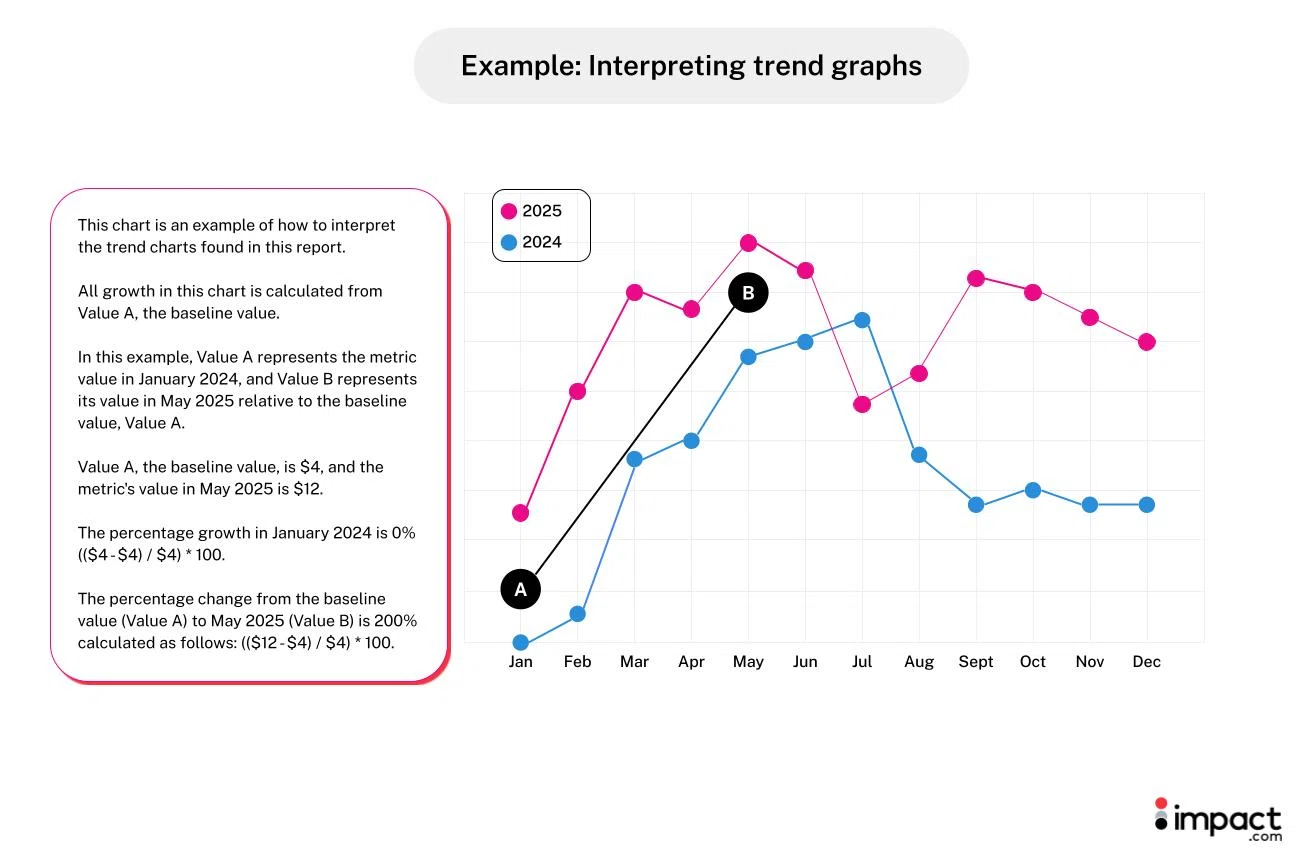
(See Appendix for full methodology, glossary, and how to read the graphs.)
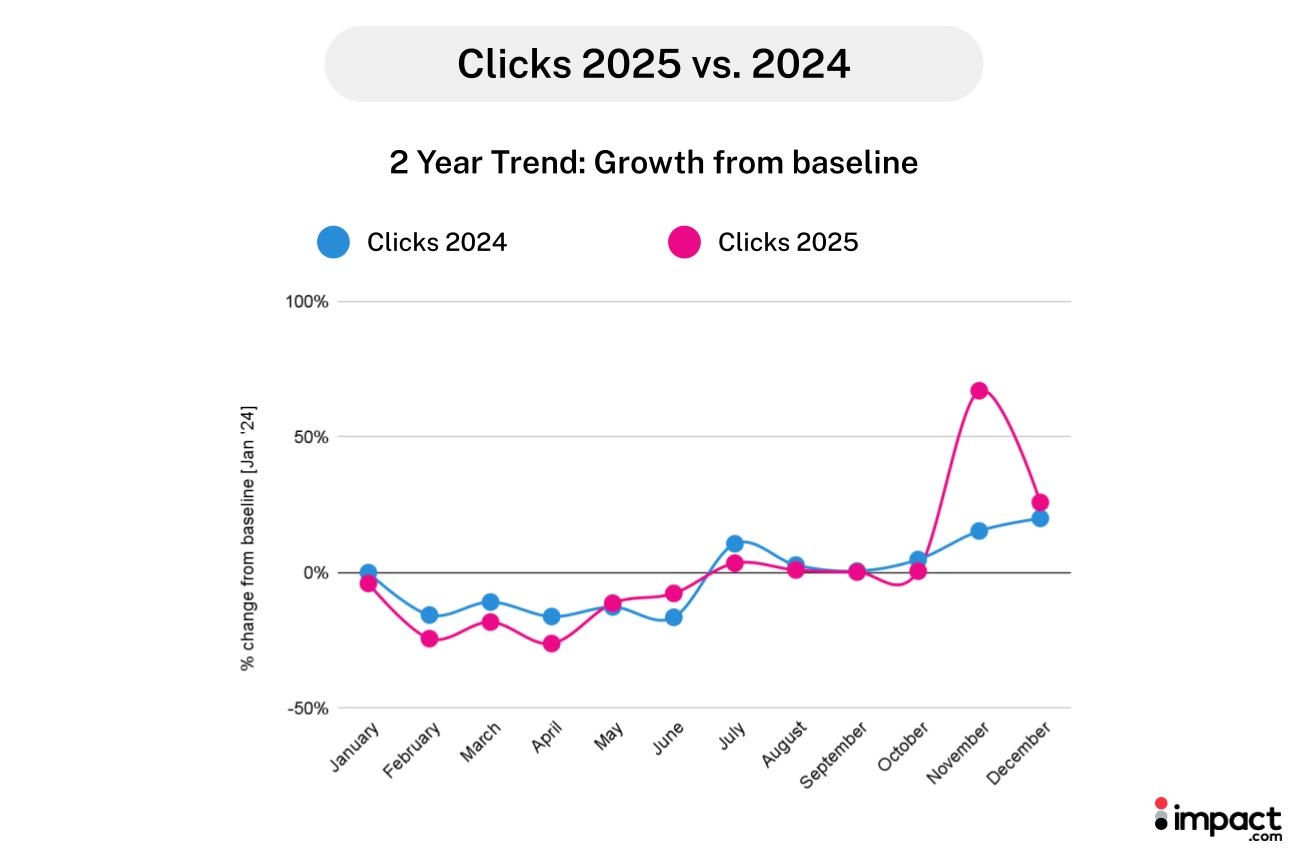
Clicks grew 2% while conversions fell—shoppers researched more before buying
Clicks increased 2% YoY while conversion rates dropped 6% YoY. Shoppers clicked more frequently to compare prices across partners but delayed purchases.
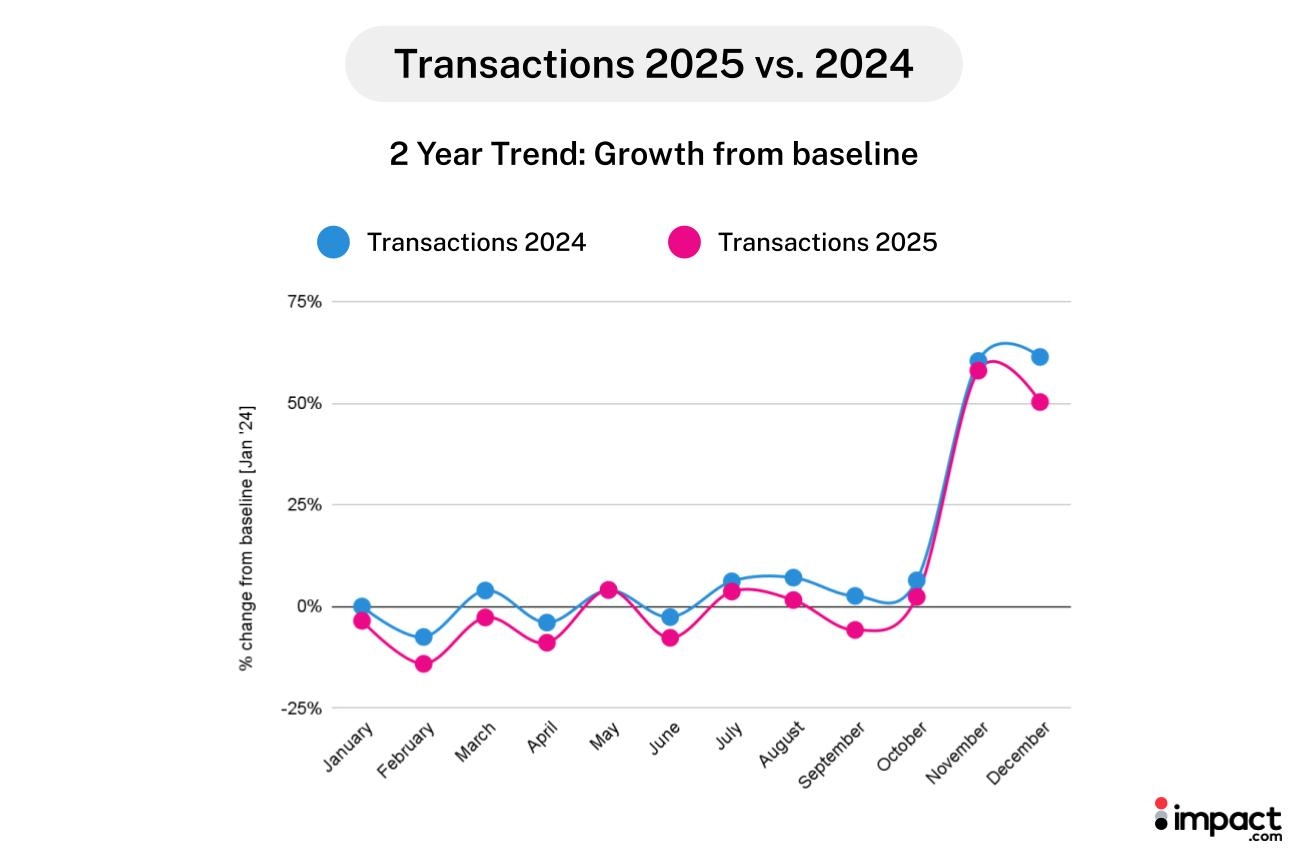
This pattern intensified during Q4. November saw clicks surge 45% YoY, yet conversion rates hit their lowest point of the year. Q4 accounted for 33% of annual clicks—up from 29% in 2024.
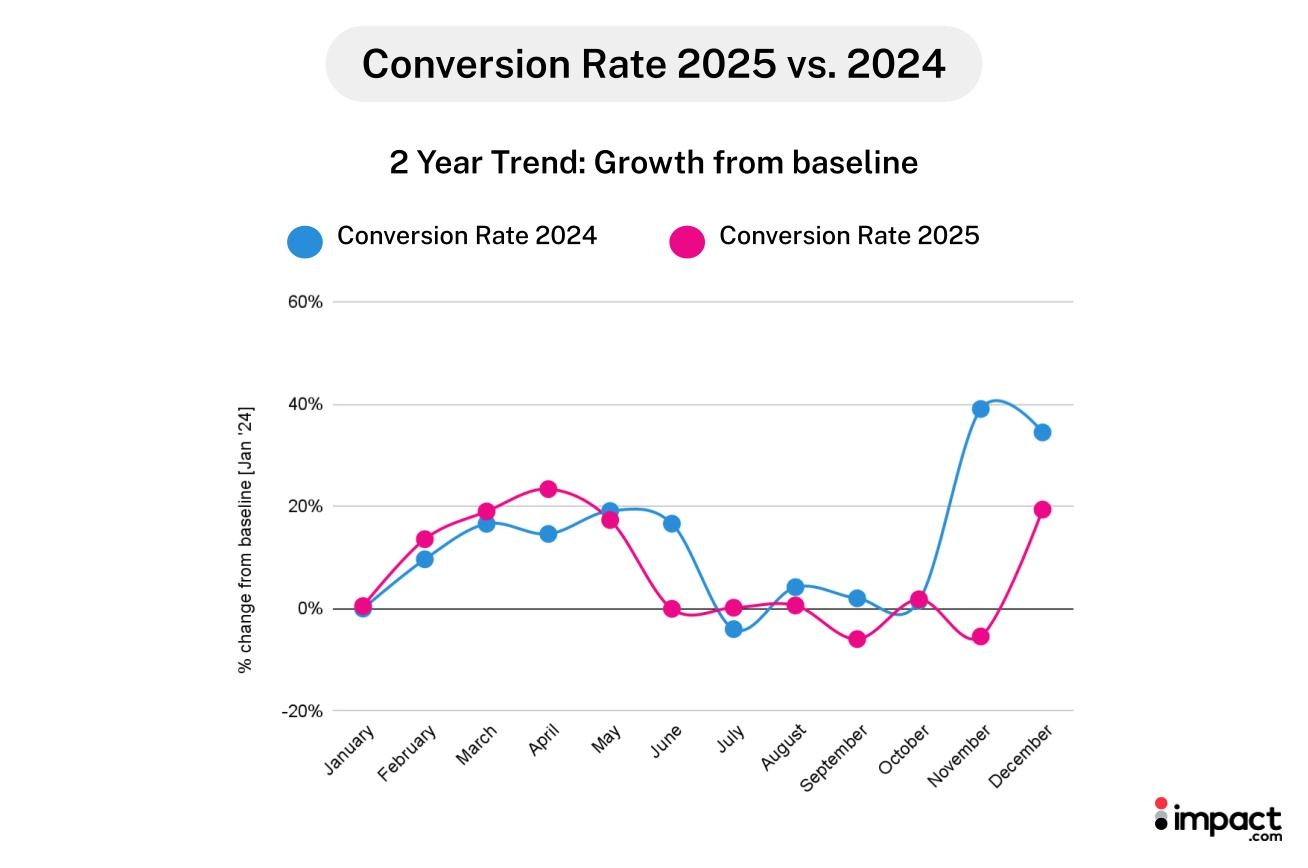
The outlier: March and April recorded the highest conversion rates of the year. Without holiday promotion noise, traffic during these months was higher intent and more decisive.
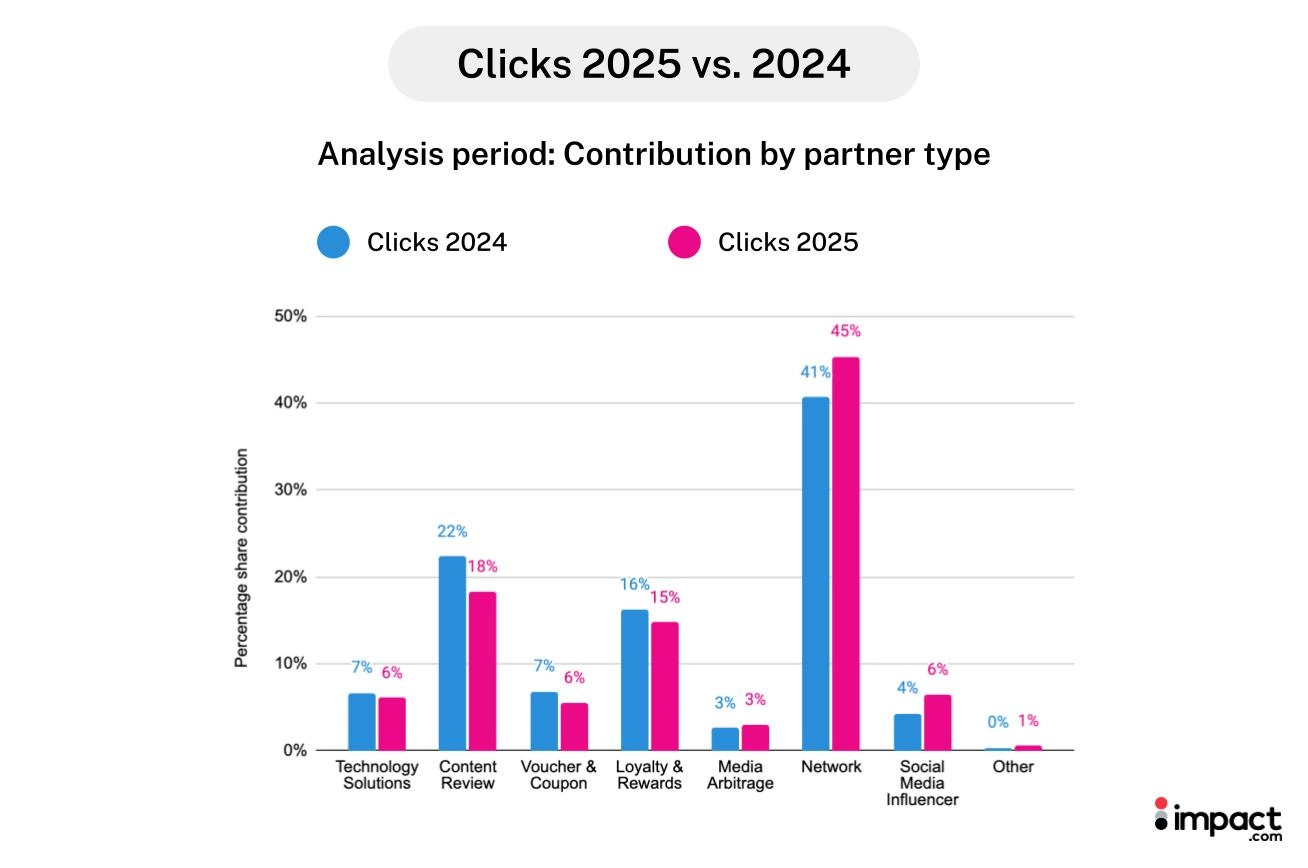
Network and content partners drove the majority of research traffic
- Network partners: 45% of clicks (up from 41% in 2024)
- Content review partners: 18% of clicks
- Influencers: 6% of clicks (up from 4% in 2024)
Why the research phase expanded
Affiliate links now serve dual purposes: research and purchase. Shoppers use them to compare prices, monitor deals, and build knowledge across multiple partners before converting. The ratio shifted—more research activity relative to final purchases.
How to measure partner value during the research phase
- Evaluate partners by influence during consideration, not just final purchases
- Distinguish partners that drive research (content, network, influencers) from those that capture ready buyers
- Don’t penalize high clicks with low immediate sales during peak research windows—November’s 45% YoY click surge with flat YoY sales reflects research behavior, not poor performance
Source: 2025 Black Friday consumer report
Transactions declined 5% despite heavy research activity
Transactions fell 5% YoY, even as clicks increased 2% YoY. November illustrated this disconnect most clearly, showing that clicks surged 45% YoY while transactions remained nearly flat (-1% YoY). Shoppers used November to build carts and compare options, then waited.
The purchase window compressed into early December. With Cyber Monday falling on December 1, shoppers delayed final checkouts until they could validate the deals they’d been monitoring. Unlike 2024—when December transactions spread more evenly across the month—the 2025 data suggests that purchases were concentrated in the first few days.
Throughout the rest of the year, transaction patterns remained stable. Q1 through Q3 each contributed 22-23% of annual transactions, with Q4 accounting for 32%—consistent with 2024.
Technology solutions and influencers improved at converting prepared shoppers
Partners who help move shoppers from consideration to decision saw the strongest growth. Technology solutions improved their conversion rates by 25% YoY, while influencers increased theirs by 8% YoY. Transaction volume from influencers grew 65% YoY, tech solutions 16% YoY, and media arbitrage 12% YoY.
Loyalty and rewards partners continued to drive half of all transactions (50%), capturing shoppers at the moment they were ready to complete purchases.
Why the decision window narrowed
Shoppers spent November researching across multiple partners, monitoring prices, and filling carts. When they were ready to buy, they moved quickly—concentrating purchases around the Cyber Monday window when confidence, value, and timing aligned. The decision phase didn’t disappear, but it was notably compressed.
Where to focus when shoppers are ready to decide
Build visibility during the decision window, not just the research phase. Shoppers who’ve spent weeks comparing options need final validation (whether through reviews, deal confirmation, or social proof) before converting.
Partners like tech solutions and influencers help provide that push from consideration to purchase. Maintain strong relationships with execution partners (loyalty, voucher/coupon) who capture shoppers at the final moment, but don’t assume all value happens at last click. The partners who influenced the decision weeks earlier deserve credit too.
When shoppers finally converted, they maximized the value of each purchase.
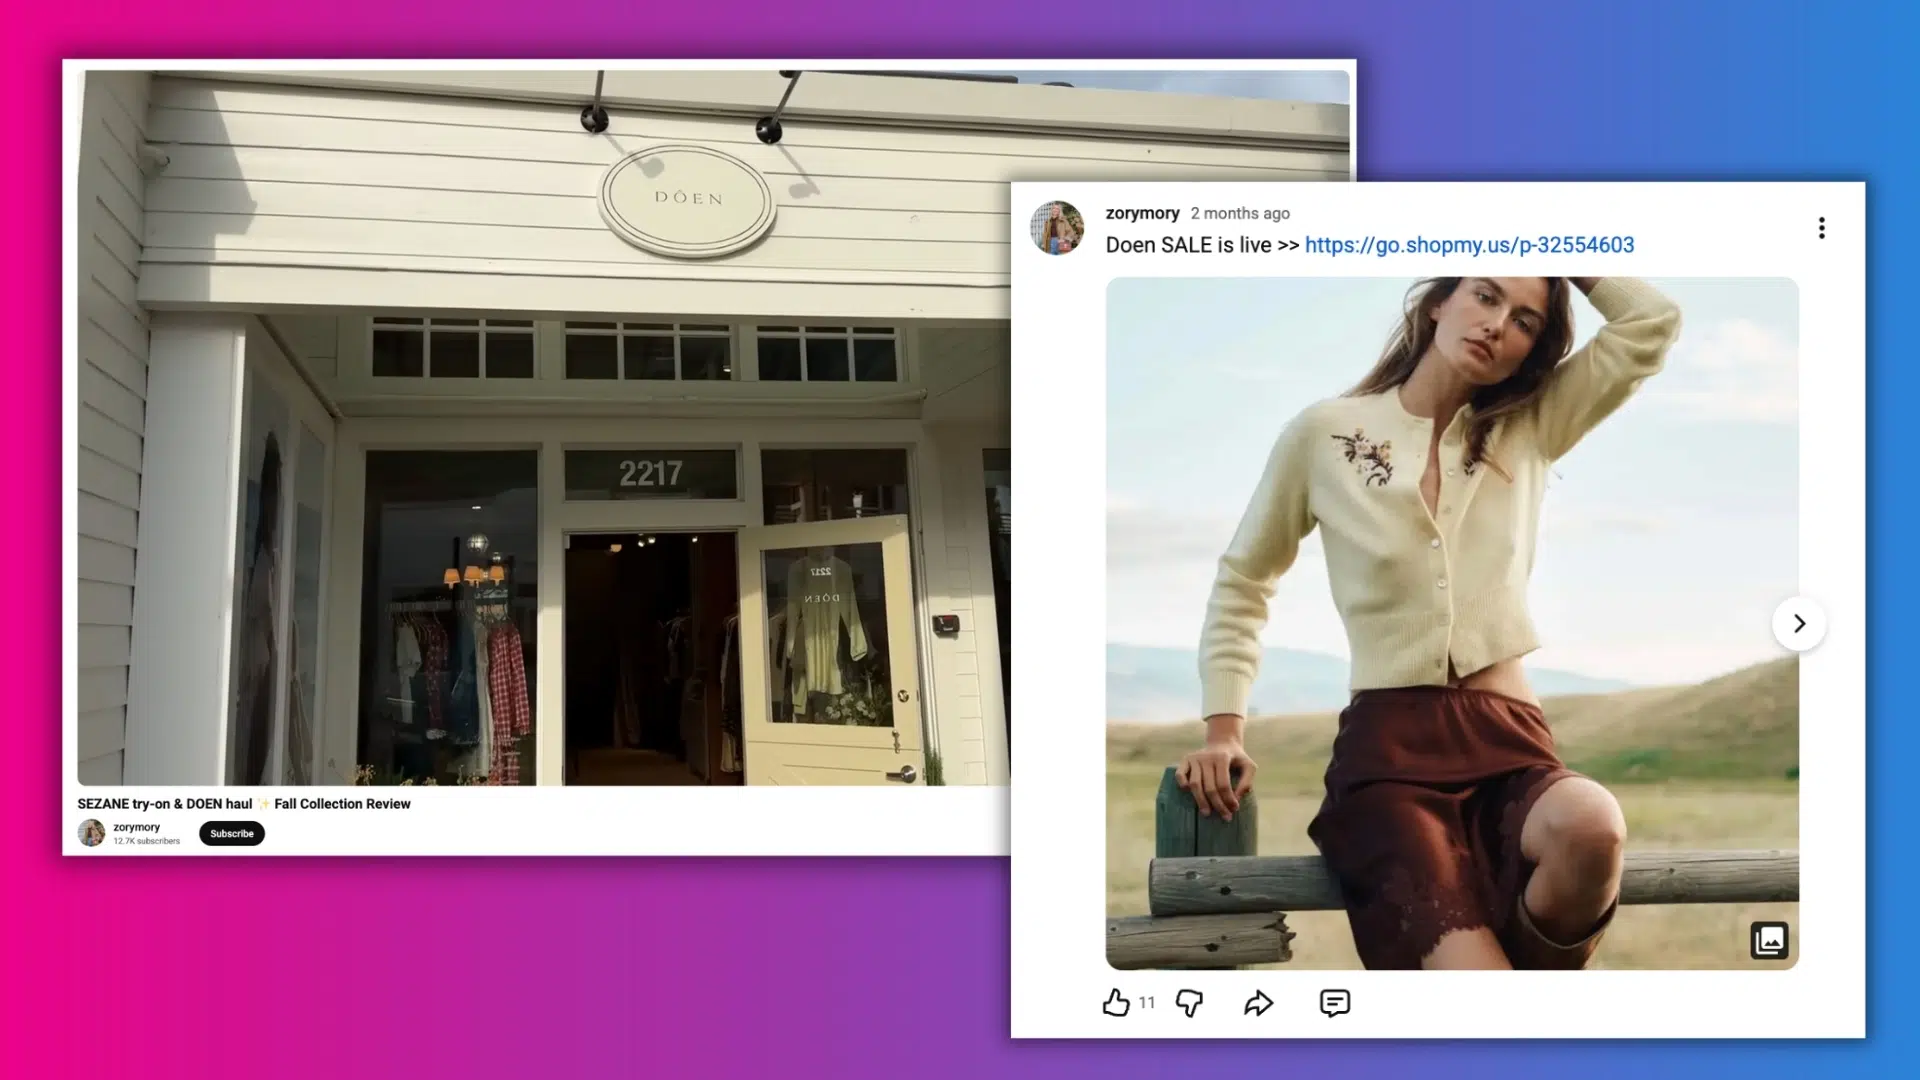
Doen supported YouTuber Zory’s audience from try-on to purchase with a later Black Friday promotion.
Fewer checkouts, but 4% AOV increase
Average order value (AOV) increased 4% YoY—from $118 to $123—even as transactions declined 5% YoY. Shoppers consolidated purchases into fewer trips but added more items per order.
The shift was driven by volume, not price:
- Items per order: 2.3 → 2.5 (+8% YoY)
- Average item value: $50 → $49 (-3% YoY)
- Net result: AOV up 4% YoY
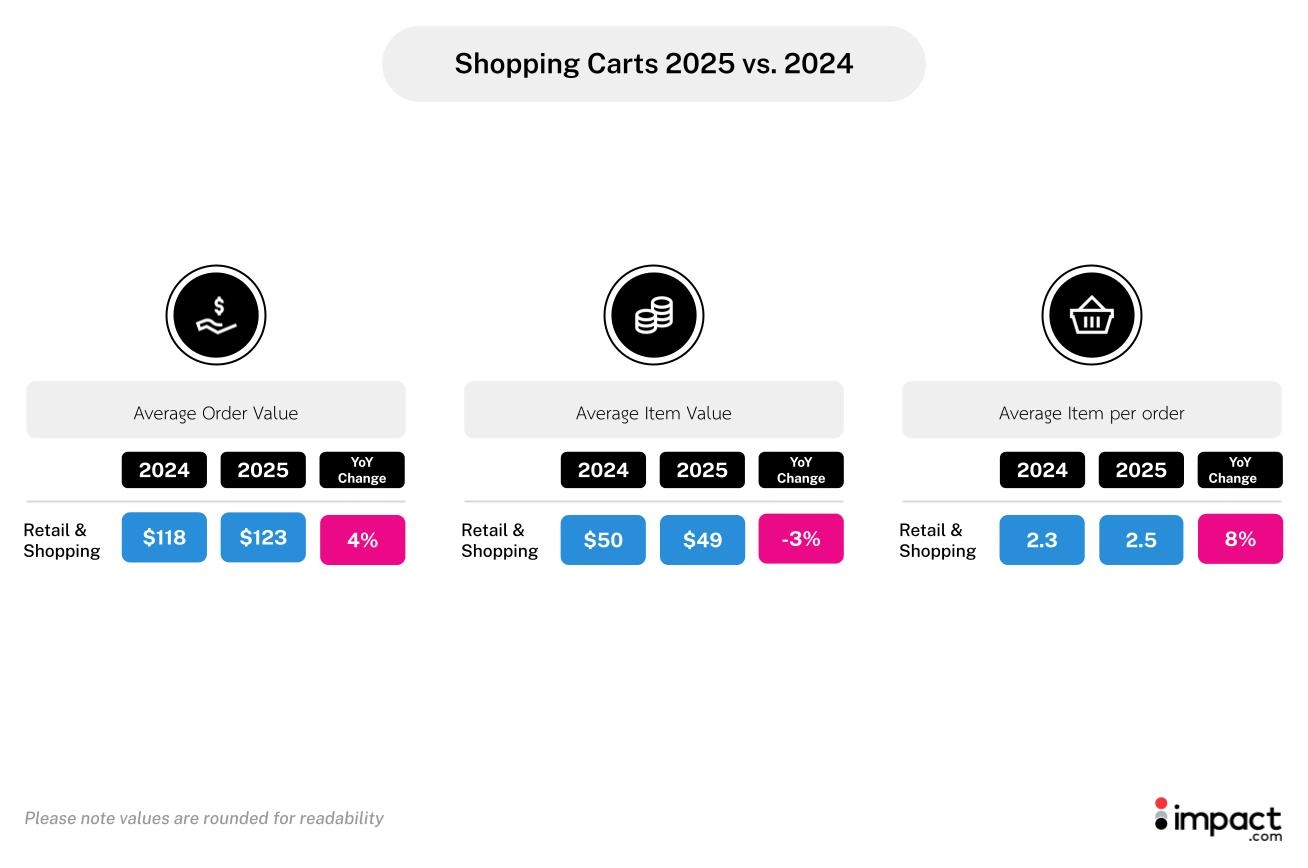
Shoppers bundled more lower-priced items together, likely to meet free shipping thresholds or take advantage of bulk discounts. This strategy kept total consumer spending nearly flat. Despite 5% YoY fewer transactions, consumer spending declined just 1% YoY.
Loyalty and voucher partners captured the final checkout moment
Partner efficiency varied significantly at the execution stage:
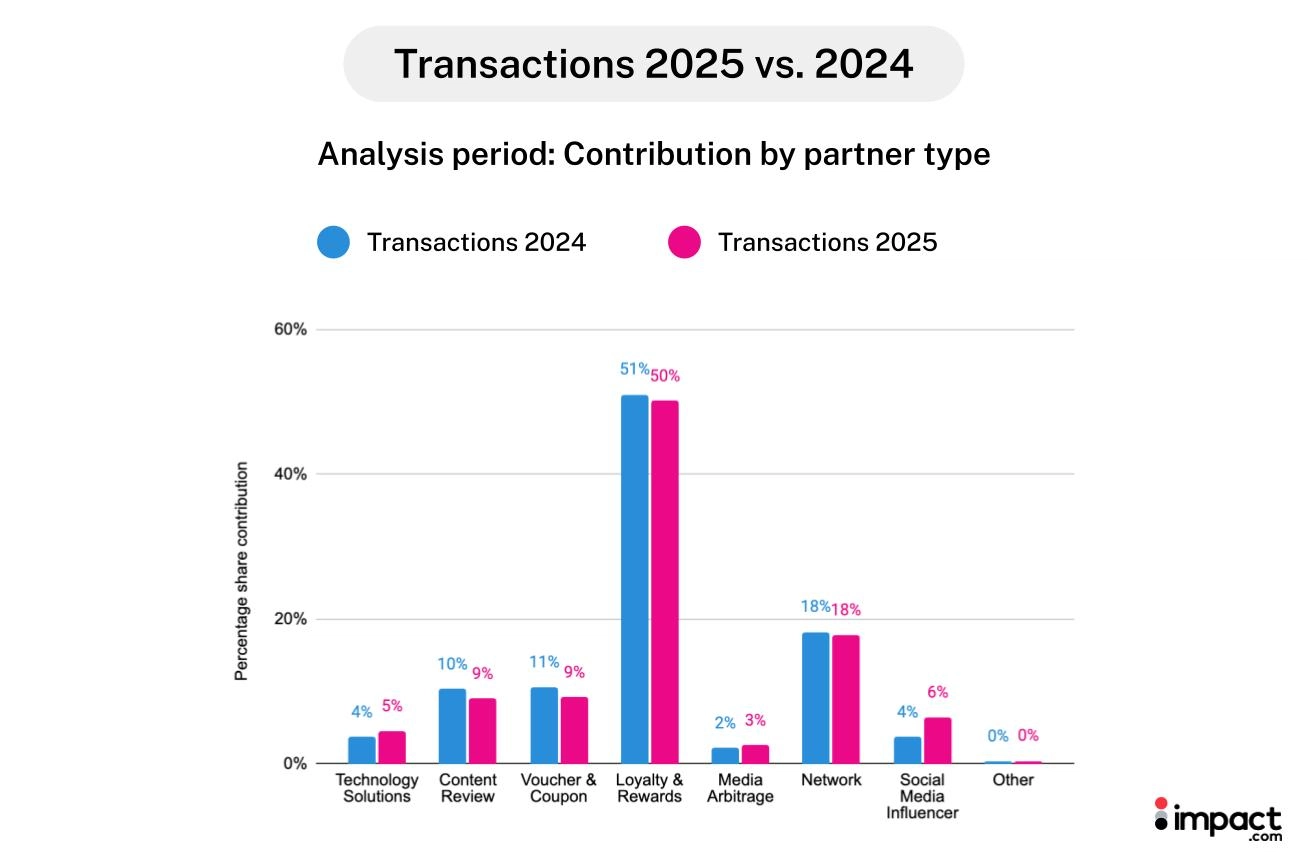
- Loyalty & Rewards: 50% of transactions, 50% of consumer spend (highest efficiency)
- Voucher/Coupon: 10% of consumer spend (down from 11% in 2024)
- Influencers: 6% of transactions, 3% of consumer spend (+37% YoY growth)
- Tech solutions: 5% of consumer spend, 5% of transactions (+37% YoY growth)
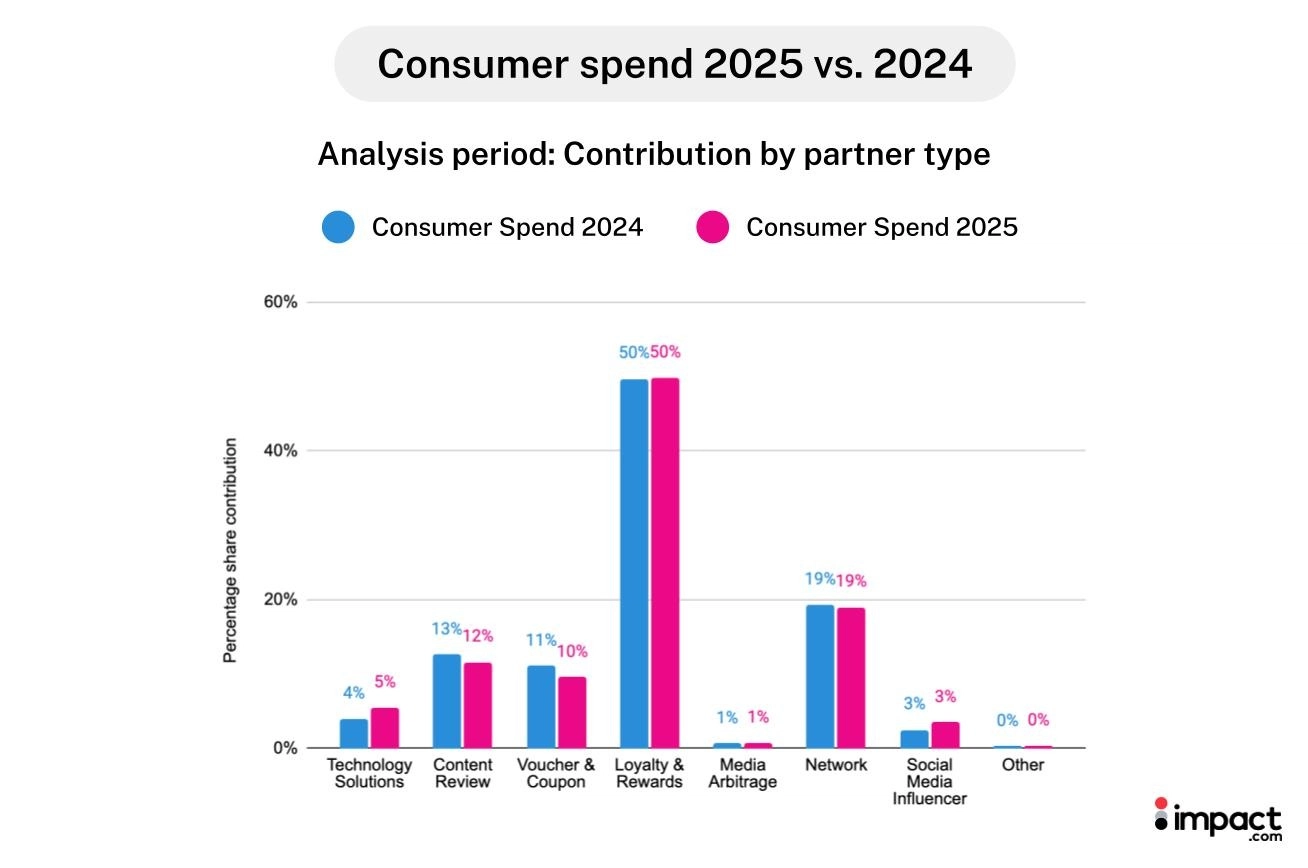
Loyalty partners remained the most efficient, capturing equal share of transactions and consumer spend. Influencers and tech solutions drove higher sales volumes at lower price points. While they’ve increased consumer spending by 37% YoY, their overall share contribution of total consumer spending is still small (yet growing)
Why shoppers bundled strategically
Shoppers bought less often but made each checkout count. They traded down to lower-priced items but added more to their carts, optimizing for value per transaction.
This behavior suggests intentional planning: researching across weeks, waiting for the right moment, then executing with a fully loaded cart.
How to capture value at checkout
Focus on net order value, not just transaction volume. Partners who drive larger baskets or higher-value items—whether through bundling recommendations, threshold messaging, or complementary product suggestions—can deliver more revenue per conversion.
Loyalty and rewards programs remain one of the most efficient execution partners, but don’t overlook how influencers and tech solutions drive incremental volume at lower acquisition costs. Evaluate partners by revenue per transaction and total consumer spend, not just transaction counts.
Brands reallocated spend to defend key moments rather than simply increasing budget this past year
Source: The State of Affiliate Marketing Report
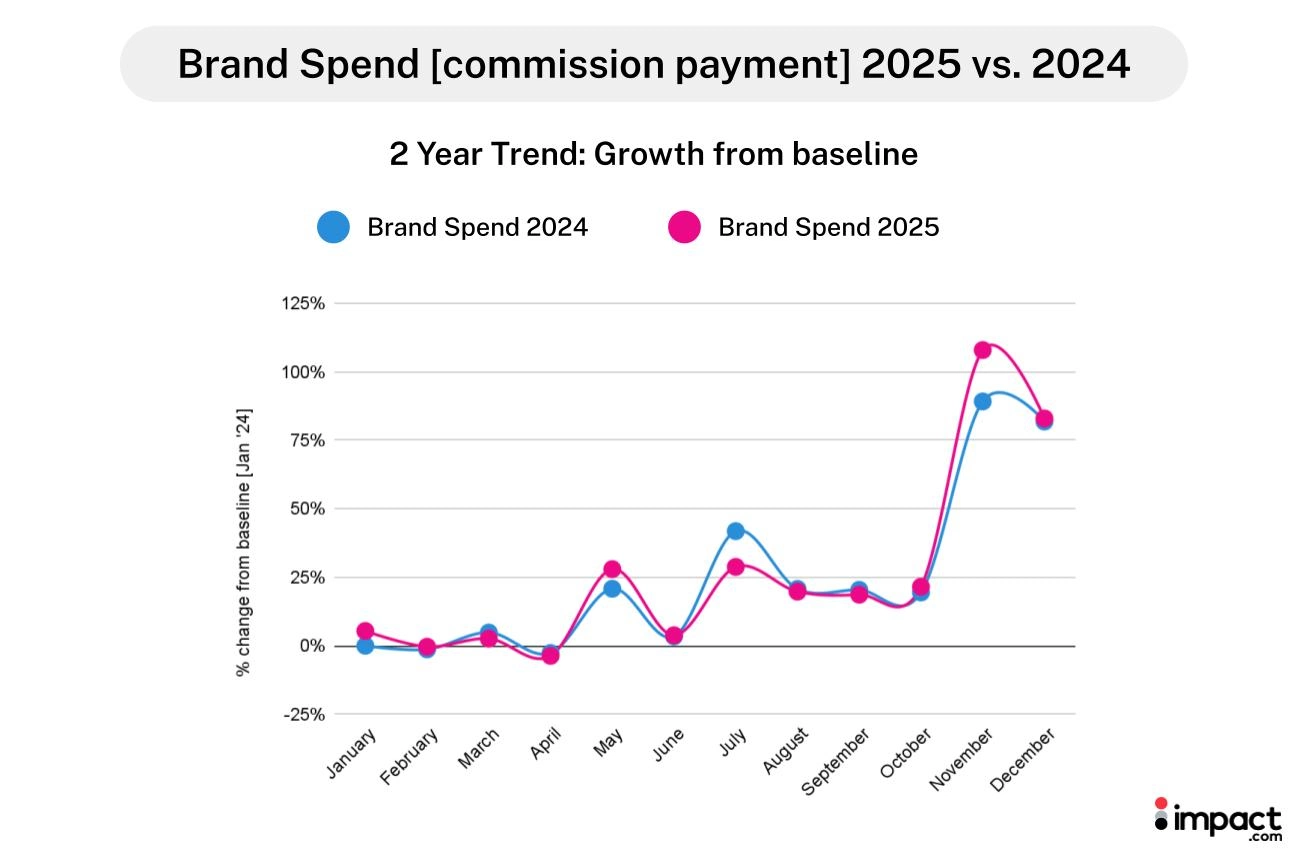
Total spending stayed flat but shifted toward visibility
Total brand spending increased just 1% YoY in 2025, matching the modest 1% YoY growth in commission payments. Non-commission costs grew 3%—bonuses, placement fees, and other fixed payments to secure visibility during competitive windows.
These costs increased their share of total spend:
- Non-commission: 14% of total spend (up from 13% in 2024)
- Commission: 86% of total spend (down from 87% in 2024)
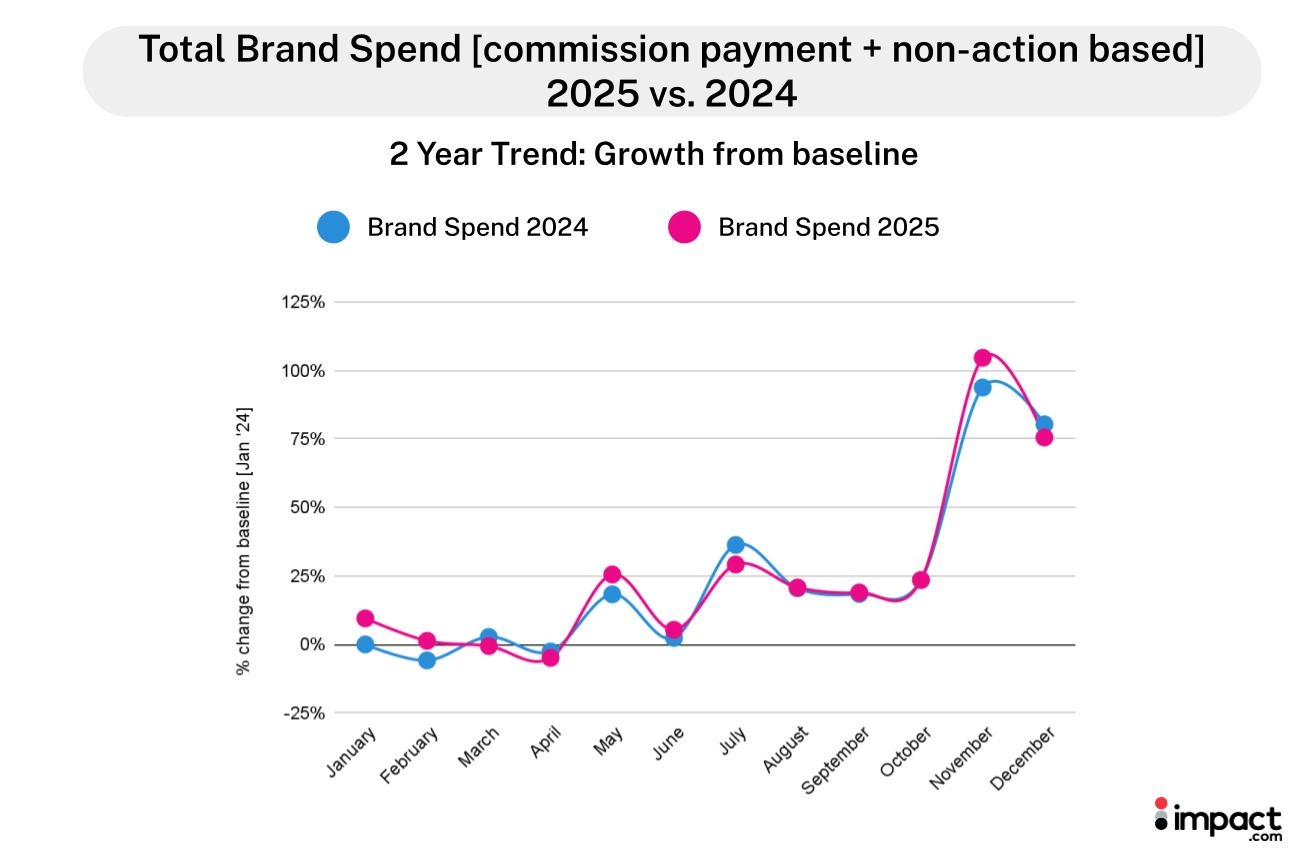
Budgets didn’t expand. Instead, brands shifted how they allocated spend.
The reallocation concentrated in November. Total brand spend increased 6% that month, with commission payments up 10%. Brands raised commission rates by 7% to compete for placement during the year’s highest-traffic research period.
Where brands invested vs. what they got back
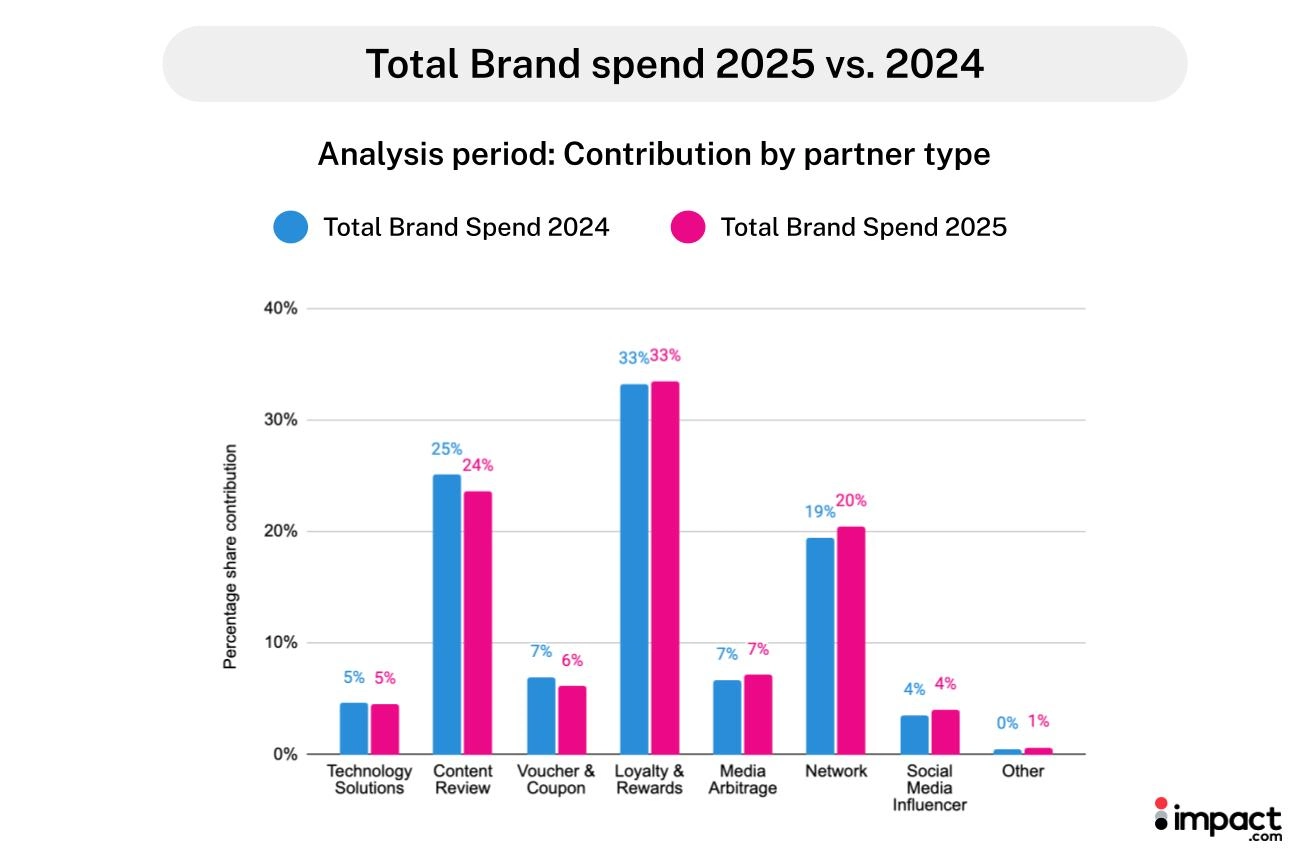
Spending efficiency varied dramatically by partner type:
- Loyalty & Rewards: 33% of total brand spend → 50% of transactions (most efficient)
- Network Partners: 20% of total brand spend → 18% of transactions (balanced)
- Content Review: 24% of total brand spend → 9% of transactions and 18% of clicks (research investment)
- Influencers: 4% of total brand spend → 6% of transactions (high efficiency)
Loyalty partners delivered the strongest return—one-third of brand spend generated half of all transactions. Content review partners consumed 24% of brand budgets but drove just 9% of transactions and 18% of clicks, reflecting their role earlier in the funnel during research. Influencers remained highly efficient, generating more transactions than their share of brand spend.
Why brands concentrated their spend around peak moments
With shoppers compressing purchases into narrow windows after extended research, brands couldn’t rely on consistent, distributed spending. They needed visibility during November’s research surge and conversion power during December’s execution window. Higher commission rates and placement fees in November secured visible positioning during the critical consideration phase.
Commission payments increased despite fewer transactions because brands raised commission rates strategically—paying more per transaction to defend market share during compressed shopping periods.
How to allocate spend when the journey lengthens but transactions compress
Build flexibility into your budget. Fixed, always-on spending doesn’t match how shoppers actually behave. Concentrate investment during peak research windows (higher placement fees, bonuses for content partners) and peak conversion windows (higher commission rates for execution partners).
Evaluate partner efficiency by their role in the customer journey, not overall. Content review partners look expensive at 24% of brand spend for 9% of transactions—until you recognize they drive the research phase that feeds everything else. Balance high-efficiency execution partners (loyalty, influencers) with necessary research investments (content, network).
Don’t expect to outspend the problem. Total brand spending grew just 1% while successfully navigating a more complex customer journey. Strategic reallocation matters more than budget increases.
Now that we’ve seen how the journey transformed, here’s how to design a partner mix that matches it.
Source: The State of Affiliate Marketing Report
Match partners to customer journey stages, not just outcomes
The strongest affiliate programs in 2025 didn’t optimize for a single partner type. They built portfolios that covered the entire journey—from research through decision to execution.
Partners perform differently depending on where shoppers are in their journey:
Research partners (generate awareness and comparison)
Decision partners (move shoppers from consideration to intent)
Execution partners (capture ready-to-buy shoppers)
Why journey-stage thinking prevents misallocation
Programs that judge all partners by last-click efficiency systematically undervalue research partners. Network and content review partners consumed 44% of total brand spend but drove only 27% of transactions. That looks inefficient—until you recognize they generated 63% of total clicks.
These partners don’t close sales. They create the conditions for sales to happen. Shoppers who click through content review or network partners often convert through loyalty or voucher partners. Both deserve credit.
How to build a partner mix for a compressed journey
Fund the full customer journey, not just the conversion stage. Allocate budget to research partners (network, content) even when their direct transaction attribution is low. Balance them with high-efficiency execution partners (loyalty, voucher) who capture prepared demand.
Invest in decision-stage partners who are improving. Technology solutions and influencers showed the strongest efficiency gains in 2025—conversion rates up 25% YoY and 8% YoY respectively. These partners help bridge the gap between the research and execution stage.
Don’t expect every partner to do everything. Content review partners driving 18% of clicks and 9% of transactions aren’t underperforming—they’re doing exactly what they should. Judge partners by their stage-specific role, not by universal conversion metrics.
The affiliate journey transformed in 2025—programs must transform with it
Shoppers spent more time researching and less time buying. Clicks increased 2%YoY while transactions declined 5% YoY. The journey stretched across weeks, but purchases compressed into days.
This isn’t temporary behavior. It’s a change in how shoppers use affiliate channels. They click to compare, not to convert. They research across multiple partners, build carts deliberately, and execute when confidence and value align.
Programs designed for consistent, distributed conversions no longer match reality. The buyer journey lengthened at the front end (research) and compressed at the back end (execution). Success in 2026 requires matching partner strategy and budget allocation to this new shape.
3 shifts that define 2026
Check out these other articles that will help you sharpen your program this year:
- Influencer marketing trends 2026: 13 experts weigh in on the future of performance-driven growth (blog)
- Marketing budget optimization: The performance marketer’s guide to partnership-driven growth (blog)
- The state of affiliate marketing in 2025 (research report)
Research appendix
Methodology
The impact.com 2025 Industry Trend Benchmark Report tracked key performance metrics across 2,368 North American same-store brands in the Retail and Shopping industry, comparing year-over-year (YoY) performance from January 1 to December 31, 2025, to the same period in 2024.
To ensure a representative benchmark, this report uses a normalized subset of data that excludes extreme outliers, encompassing nearly 1 billion transactions, over $116 billion in GMV, and more than $10 billion in GTV.
The findings in this report are highlighted through the performance of key Retail and Shopping sub-categories, including but not limited to:
- Apparel, Shoes, and Accessories
- Computers and Electronics
- Health and Beauty
- Home and Garden
- Sport, Outdoor, and Fitness
- Arts and Entertainment
- Flowers, Food, Gift, and Drink
This report aims to offer unique and valuable insights into consumer behavior and significant trends throughout 2025.
Glossary
| Total brand spending | The sum of action-based (commission payouts) and non-action-based payments (bonuses, paid placement fees, etc). |
| Non-action based payment (Fixed expenses) | Brand expenditure that occurs when brands pay their partners, bonuses, paid placement fees, etc. |
| Action-based payment (commission) | Brand expenditure that occurs when brands pay their partners a commission for a specific, predefined action. |
| Network partners | Publisher platforms that broker access to brand campaigns and provide tracking, reporting, and payment services. This includes publishers categorized as network, syndication blog networks, or CPA networks. |
| Content review partners | Publishers that produce editorial content to promote, compare, and list products and services. This includes premium publishers, shopping comparisons, financial comparisons, content, bloggers, etc. |
| Loyalty and rewards partners | Publisher platforms that incentivize transactions from consumers, employees, or businesses through a membership or benefits reward program. |
| Voucher and coupon partners | Publishers who aggregate and classify coupons, vouchers and/or discounts for consumer savings. |
| Technology solutions (Commerce Solutions) | Innovative technological solutions that enhance the customer experience and drive conversions through various touchpoints, such as banking integrations, post-checkout offers, retargeting tools, or embedded software solutions |
| Media arbitrage | Search engine, social, or programmatic marketers that manage keyword campaigns for brands, often on a performance basis. |
| Cross-audience monetization | Businesses that publish offers, content, and complementary (non-competing) products to current customers or audiences (e.g., exit traffic, improved UX) to drive incremental revenue. |
| Analysis period | 2024: January 1, 2024 – December 31, 2024 2025: January 1, 2025 – December 31, 2025 |
Understanding the graphs