

Heading into the 2026 holiday season, holiday shopping trends reflect real financial pressure. Inflation has eased from its May peak per the U.S. Bureau of Labor Statistics’ Consumer Price Index Summary, but remains at 3.4% year-over-year (YoY) as of July 2026. Gas prices, still elevated in part from the oil supply disruption caused by the 2026 Iran war, sat roughly 29% higher than a year ago as of August 2026, according to the U.S. Energy Information Administration’s Gasoline and Diesel Fuel Update.
Consumer sentiment about wage growth has barely kept pace. “Across all consumers, only 8% expect their income growth to exceed inflation in the year ahead, down from 18% in December 2024,” says University of Michigan’s Surveys of Consumers Director Joanne Hsu.
Shoppers feel that pressure, but they’re responding by changing what and when they buy, not whether they buy.
We surveyed 1,046 U.S. consumers in July 2026 about their holiday shopping plans to understand how that pressure is shaping this year’s spending—and what it means for brands heading into Cyber Week.
When asked how they expect to navigate economic conditions this season, 39% said they’ll time purchases around major sales events like Cyber Week—more than the 31% who said they’d be stricter with their budget or the 26% that anticipate shifting more of purchases to discount, off-price or warehouse retailers.
Despite these pressures, 76% still plan to spend the same or more this Cyber Week and holiday season compared to 2025. This year, not all shoppers are cutting back—they’re getting more deliberate about four specific decisions:
- when they buy
- how deep a discount has to be before it’s worth acting on
- what earns their trust
- which sources and tools they look to for guidance
See the ten holiday shopping trends that could shape your marketing strategy this Q4.
About the data
We surveyed 1,046 U.S. consumers in July 2026 about their plans for the end-of-year holiday season.
Two terms recur throughout this report:
- Cyber Week refers to the period from Thanksgiving through Cyber Monday
- The holiday season refers to November and December, including Cyber Week.
This report measures what shoppers say they plan to do this season based on our survey findings—not observed purchases or transaction data.
See the full methodology in Appendix A.
10 holiday shopping trends brands need to watch for the 2026 season
This year, consumers are steady in spending but selective about where they place their trust and dollars. These holiday shopping trends cover what’s driving demand, how shoppers decide, and what earns their business at checkout.
1. Most buyers aren’t cutting their holiday shopping budgets despite economic pressures
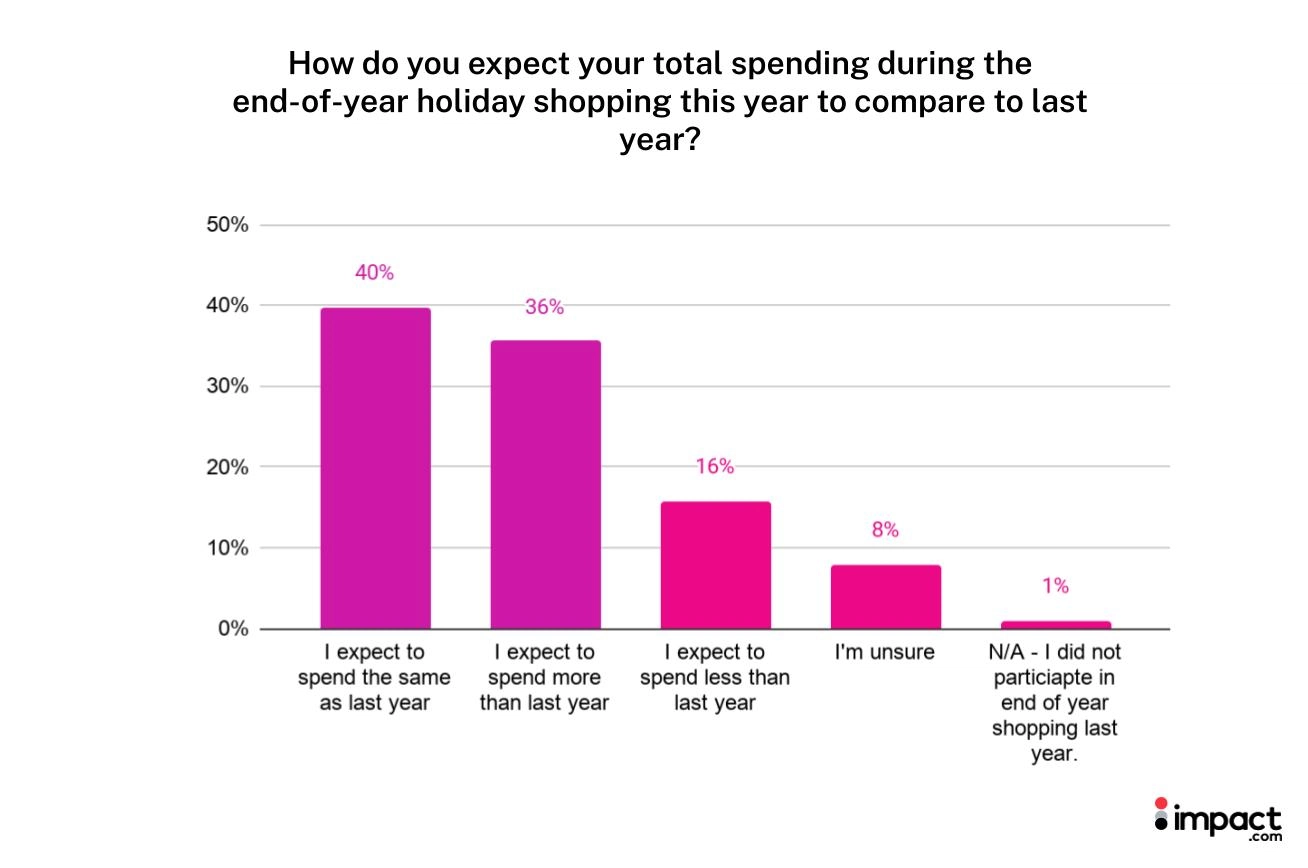
Pressure on household budgets hasn’t pulled shoppers back from holiday shopping—most consumers (76%) plan to spend the same or more this holiday season.
Spending confidence has eased slightly compared with last year, with 81% planning to spend the same or more as the previous year in our 2025 Cyber Week consumer survey. Given the pressure households are under, a modest five percentage-point dip is unsurprising—the majority still aren’t cutting back.
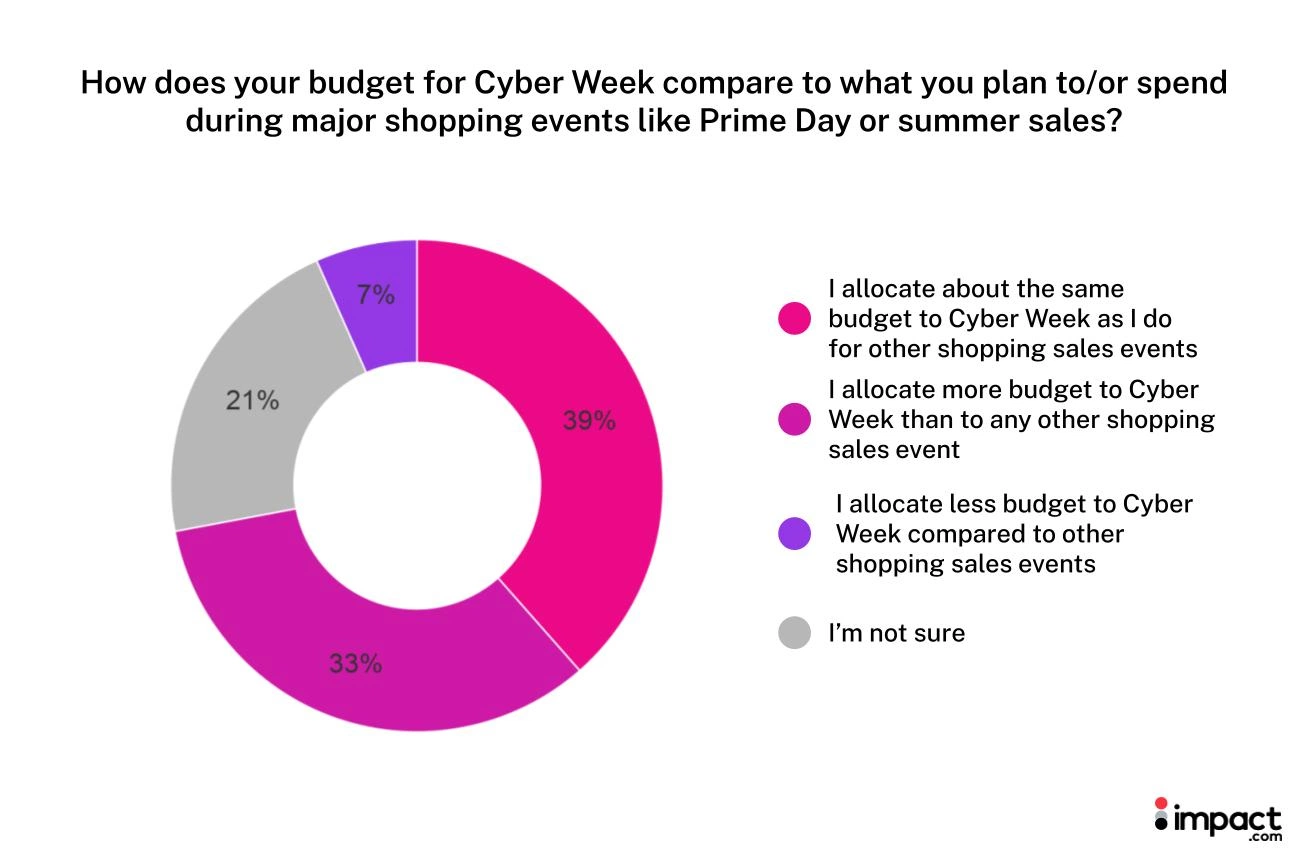
Most plan to hold their Cyber Week budget level with—or raise it above—what they spend on other major shopping events like Prime Day or summer sales, with 39% keeping it about the same and 33% planning to spend more. Only a modest 7% plan to allocate less budget.
2. Price sensitivity drives holiday season spending for gift-givers and shoppers buying for themselves
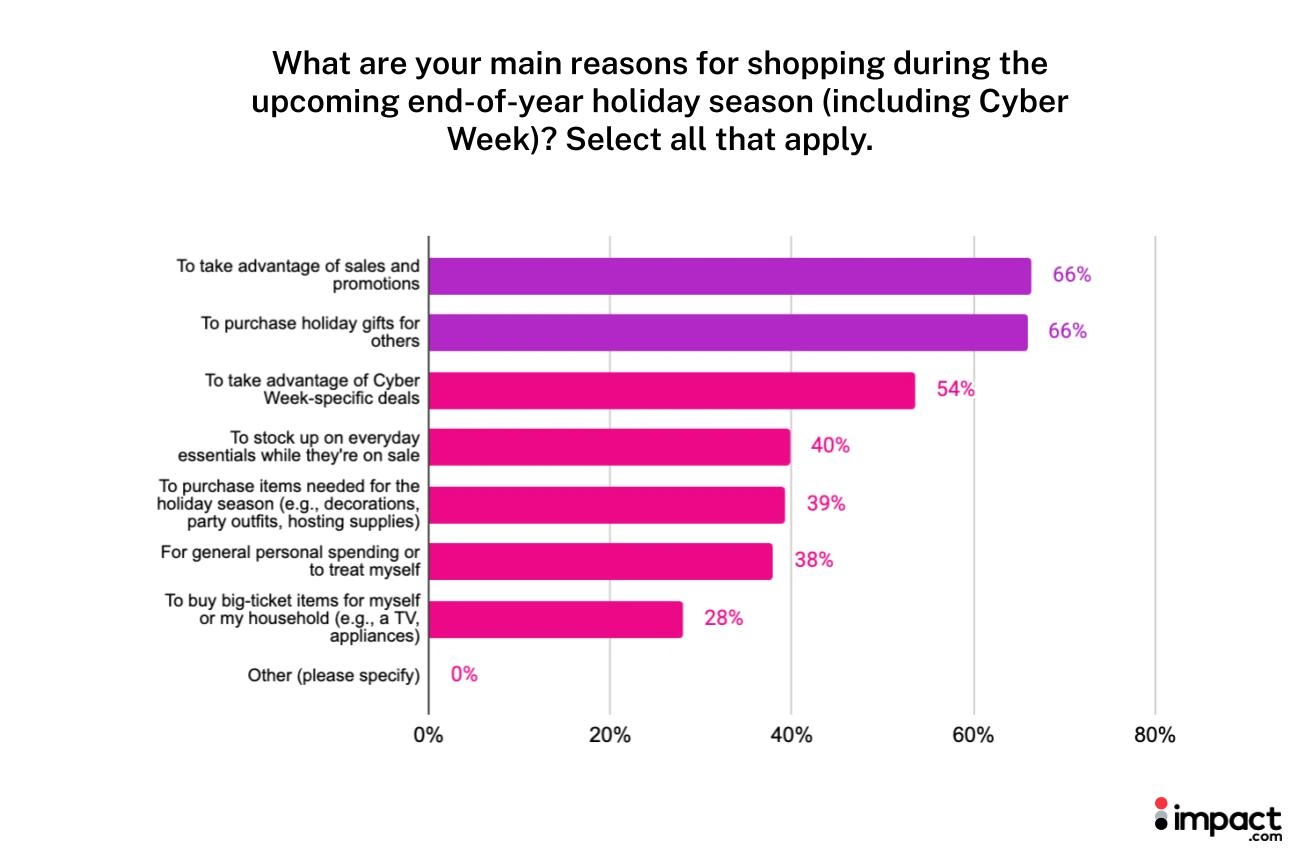
Gift-giving for others is the only top motivation that isn’t self-directed, cited by two-thirds of shoppers—tied with sales and promotions as the season’s most-cited reason to shop.
Everyone else’s stated reasons are about buying for themselves or their household:
- 40% plan to stock up on everyday essentials while they’re on sale
- 38% citing general personal spending or treating themselves
- 28% buying big-ticket items like a TV or major appliance for their household
Most of these reasons still carry a deal-seeking element, likely reflecting the financial pressure many households are under this year—even shoppers planning to spend as much or more still want to feel like they got a good price.
What you can do: Go beyond the gifting angle in your partners’ brief messaging
Deal-seeking drives shopping across many motivations this season—gift-giving, everyday essentials, and big-ticket purchases alike. That means that affiliate strategies built primarily around gift guides miss the two-thirds of shoppers looking to take advantage of sales and promotions.
Include essentials roundups and big-ticket buying guides in holiday sale event partner briefs alongside normal gift guides. For lifestyle and self-care content, where treat-yourself spending is likely to concentrate, lead with value-driven product storytelling rather than a price-first pitch.
3. Holiday season demand spreads across product categories
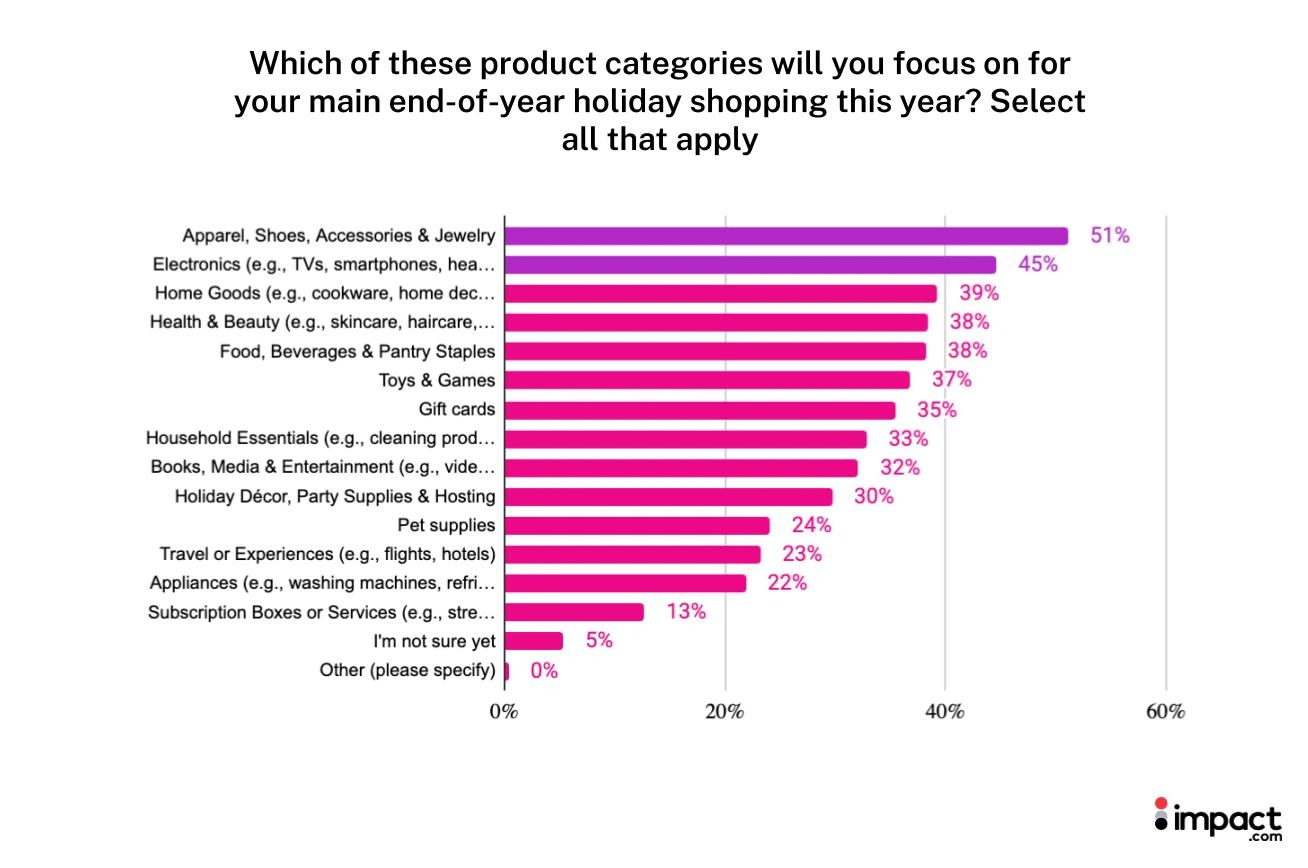
Holiday season demand isn’t concentrated in one product type: the average shopper plans to buy across 4-5 categories, with Apparel, Shoes, Accessories & Jewelry (51%) and Electronics (45%) being shoppers’ top focus areas.
For brands, that means competing for a small slice of a diverse cart. A shopper buying a variety of product types won’t be fully captured by a single-category sale—a retailer promoting only an electronics discount, for example, misses the other four categories that shoppers plan to buy from this season.
4. Most shoppers plan weeks or months ahead, rarely acting on impulse
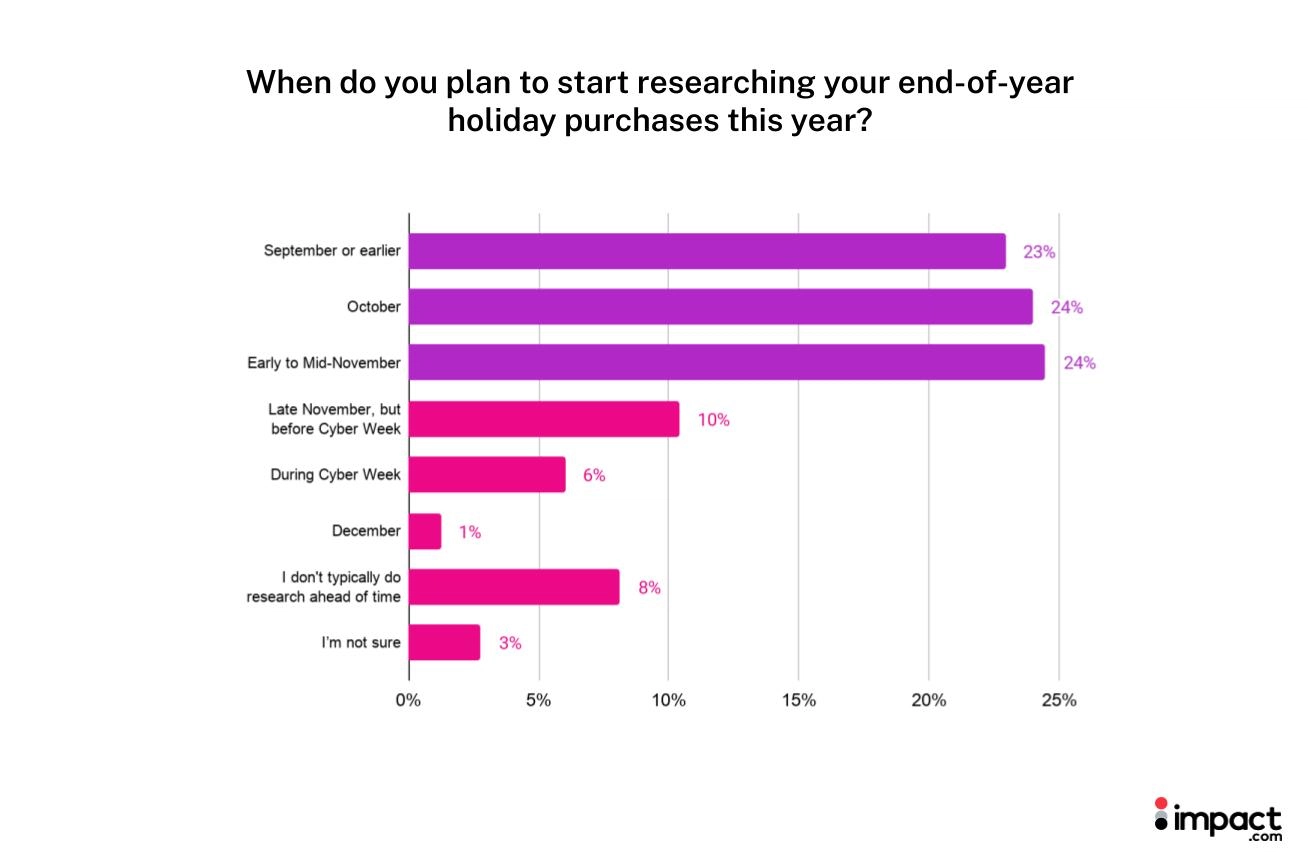
Nearly half of shoppers (47%) plan to begin researching their holiday purchases by the end of October, with only 8% saying they don’t typically research ahead of time. By the time Black Friday and Cyber Monday arrive, much of the season’s real decision-making has already happened.
Last year, our 2025 Cyber Week consumer survey found that a similar share (51%) had begun planning by the end of October, suggesting this extended consumer journey is the new normal.*
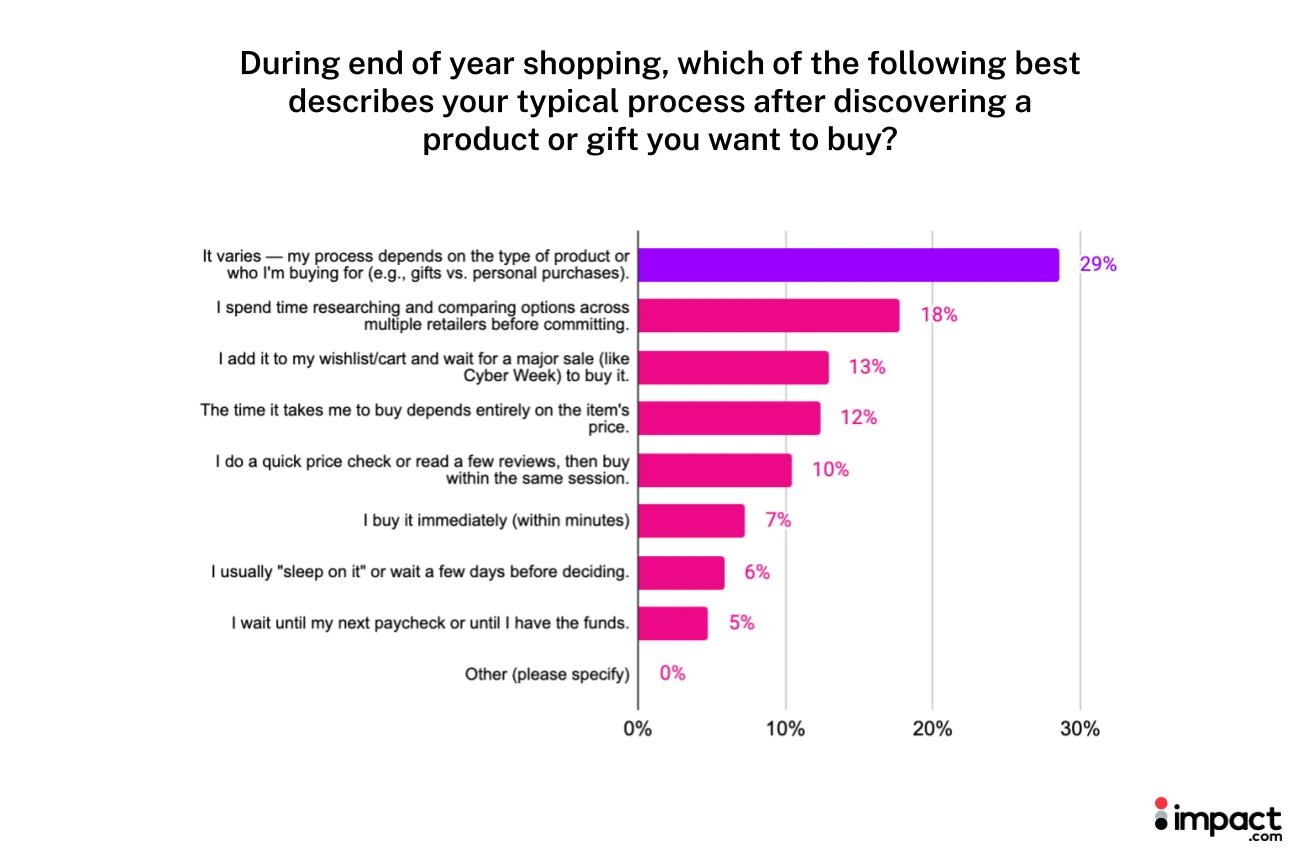
Once shoppers have found what they want, how quickly they act is often contingent: 29% say their next steps after discovering a product or gift they want to buy depend on what it is or who it’s for, while another 12% say it depends entirely on the item’s price.
A large share of consumers delay their purchase in some form, with only 7% buying immediately (within minutes). And many shoppers (41%) spend that time performing some form of evaluation that involves waiting for the right review or deal to finally buy:
- 18% spend time researching and comparing options across retailers
- 13% add it to their wishlist or cart and wait for a major sale to buy it
- 10% do a price check or read a few reviews, but buy within the same session
That’s where partner content does its real work—meeting shoppers while they’re still evaluating, whether in advance of holiday shopping or in the moment.
It’s also where this season’s price sensitivity shows up again: deal-seeking runs through nearly every reason shoppers buy this year, and partner content is one of the clearest ways brands meet that expectation before the holiday shopping season even begins.
*The 2025 and 2026 surveys use slightly different definitions for what counts as early research, making this a directional comparison rather than an exact YoY comparison.
5. The steeper the price, the steeper the discount shoppers expect
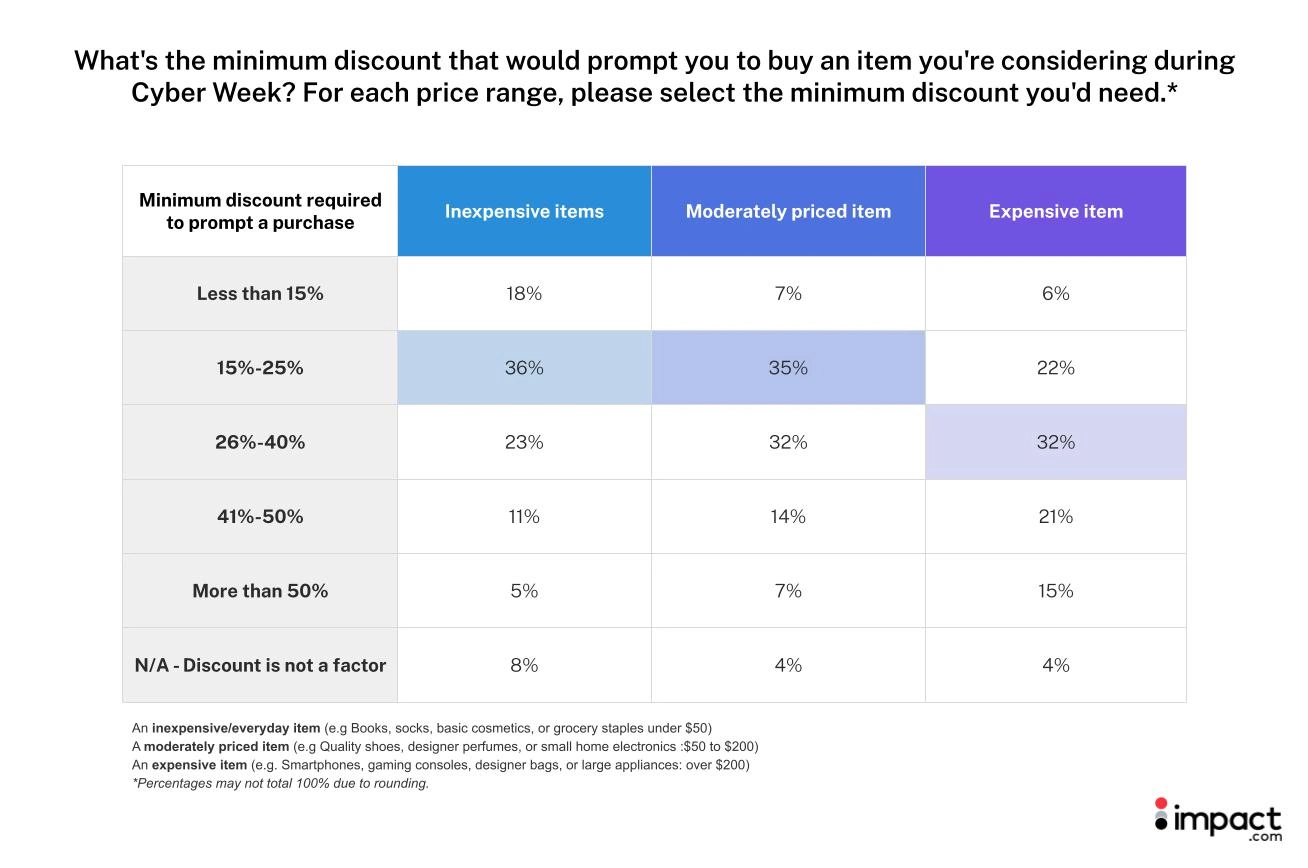
Discount thresholds rise sharply with price—what convinces a shopper on an inexpensive item barely moves them on an expensive one.
- Inexpensive items under $50: 15–25% off converts 36% of shoppers, and less than 15% off still works for 18%.
- Expensive items over $200: that same 15–25% range convinces only 22%, while 32% need 26–40% off and 36% need more than 40% off.
According to Adobe Analytics’ 2025 Holiday Season Spend Analysis, last holiday season, the deepest average category discount was electronics at 30.9%. Most higher-ticket categories ran lower, with televisions at 24.3%, appliances at 20.2%, and furniture at 18.8%. These were stronger discounts on average than in 2024.
What over a third of shoppers say they need on an expensive item sits above what the market typically delivers.
6. Free shipping tops shopper preference and drives impulse buys
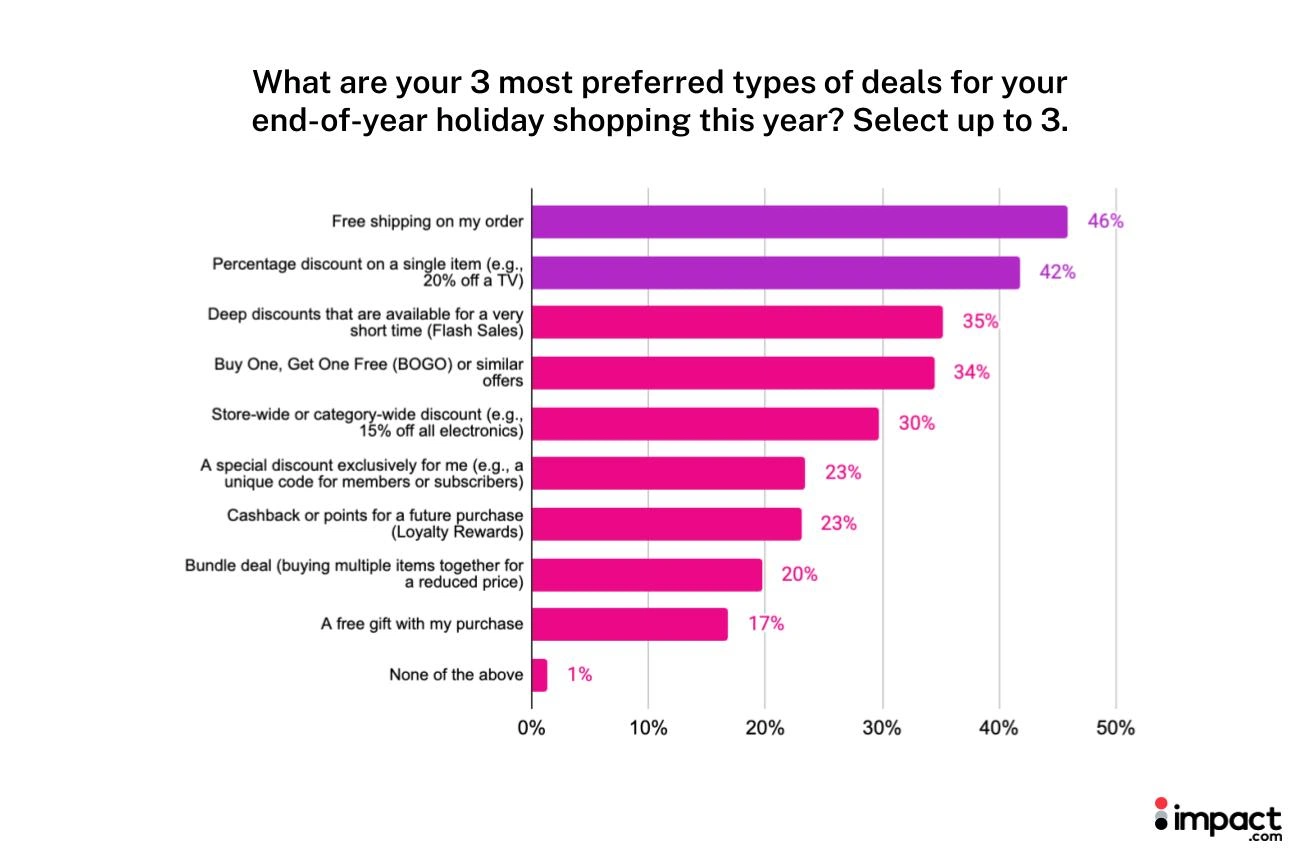
Deal shape matters this season as much as whether a deal exists at all, part of the same price sensitivity already shaping how much shoppers spend.
Free shipping leads what shoppers prefer most (46%, up slightly from 44% in 2025), ahead of a straight percentage discount on one item (42%) and flash sales (35%).
Bundle deals (20%) and a free gift with purchase (17%) rank lowest.
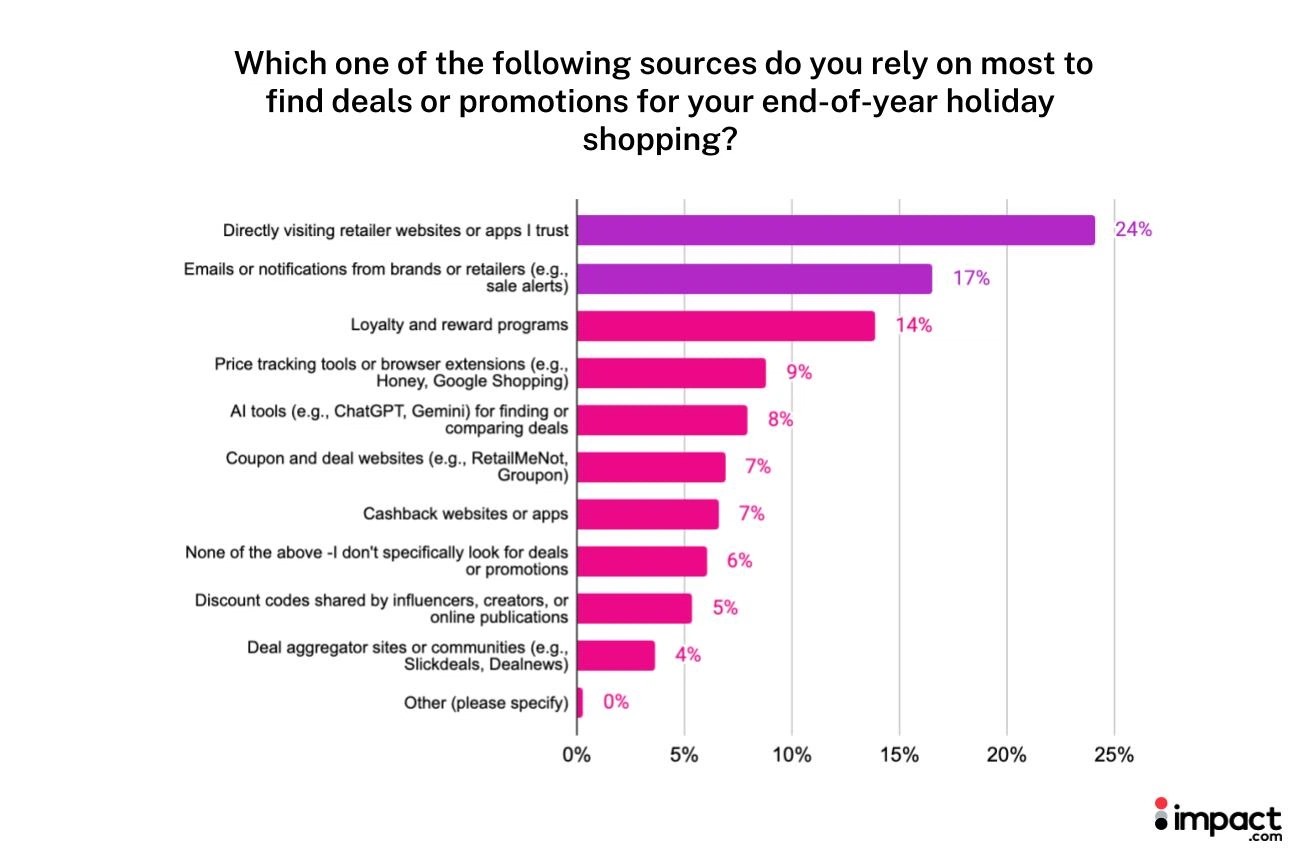
Where shoppers find those deals matters just as much as the format. Visiting a retailer website or app directly (24%) and that retailer’s own email or notifications (17%) outrank every other source tested in the survey, including loyalty and rewards programs, the next-highest option at 14%.
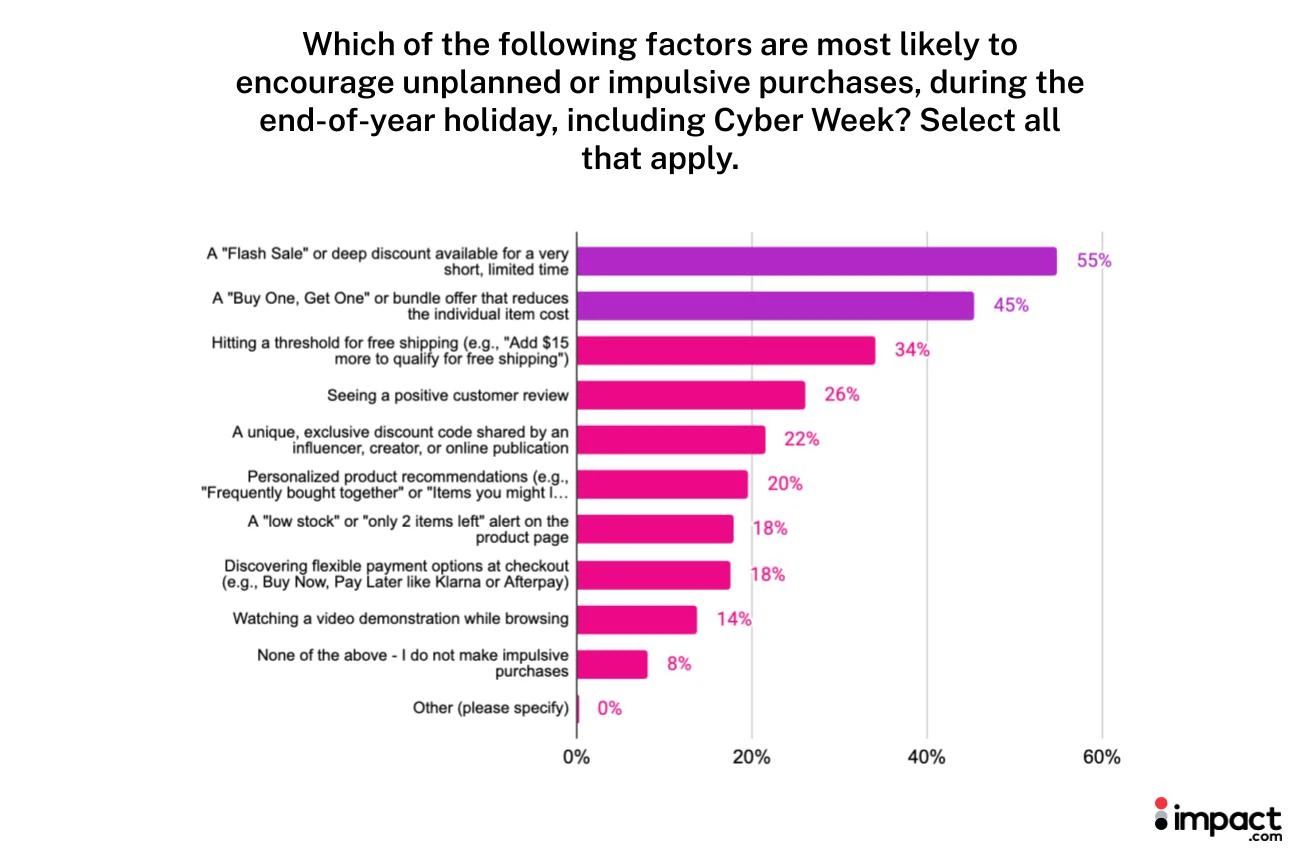
Most shoppers take their time deciding, researching and comparing before they buy rather than acting on impulse—and that patience is exactly what urgency-based promotions cut through.
Flash sales (55%) and BOGO or bundle offers (45%) top the list of what prompts an impulse purchase, but hitting a free-shipping threshold isn’t far behind (34%)—ahead of a positive review (26%), an influencer discount code (22%), or a personalized recommendation (20%).
What you can do: Make free shipping the centerpiece of your Cyber Week offer
Free shipping is the rare offer that works for both kinds of shopper this season: shoppers prefer this deal structure most overall, and it’s also the third-strongest trigger for an unplanned purchase, behind only flash sales and BOGO or bundle offers. Lead with it as your default offer, not just a threshold reward buried in the cart.
7. Personal recommendations help buyers most, but they still trust paid content
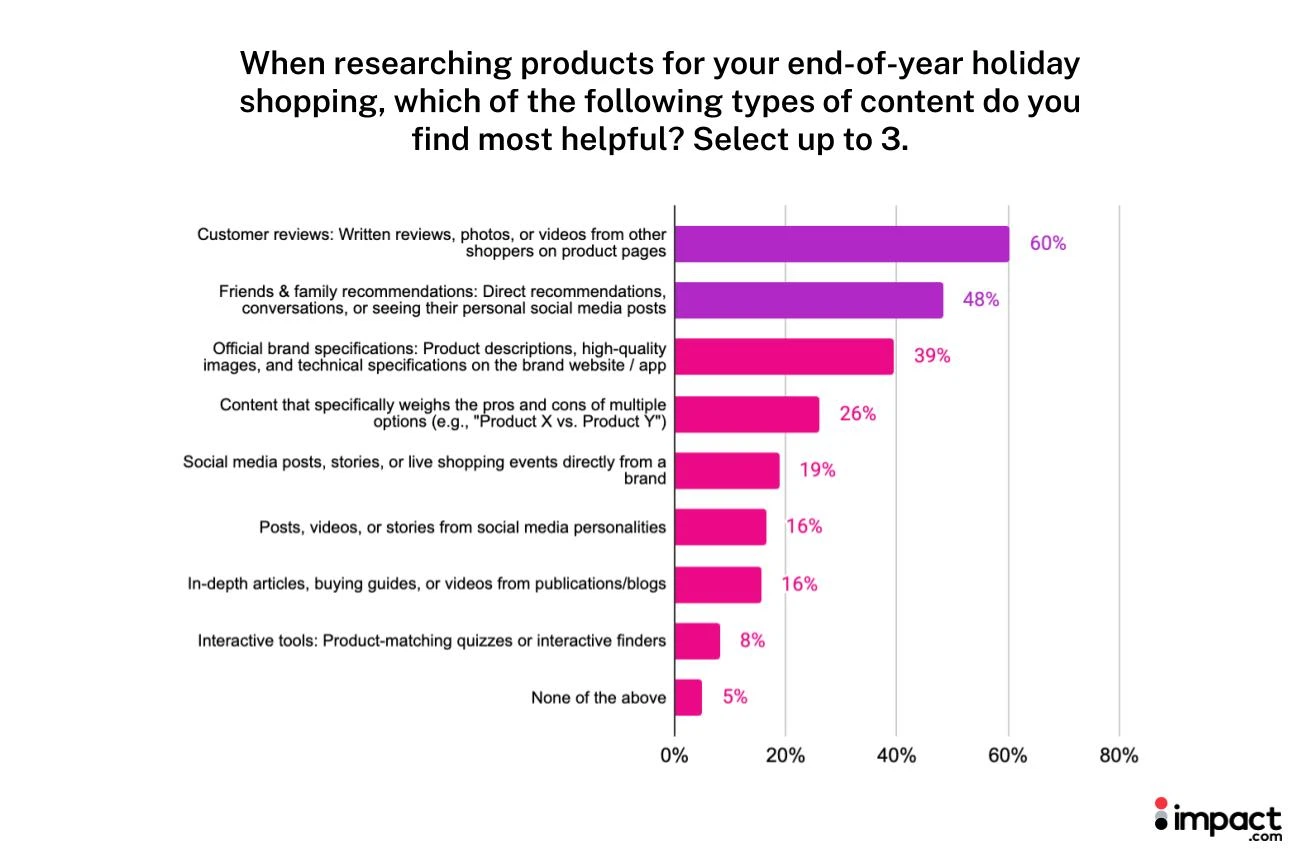
Word-of-mouth marketing remains a leading strategy in retail. Shoppers find unpaid content from someone sharing their own experiences most helpful for researching holiday purchases—customer reviews (60%) and friends-and-family recommendations (48%) lead by a wide margin.
The next most helpful set of content comes directly from the brand itself: official brand specifications and technical details (39%), plus social posts, stories, or live shopping events a brand runs directly (19%).
Among third-party content, what shoppers cite most is content that specifically weighs the pros and cons of multiple options (26%), followed by posts from social media personalities or influencers and in-depth articles or buying guides from publications or blogs (both 16%).
It’s tempting to read that ranking as proof shoppers don’t trust third-party or affiliate content. They do—even when a recommendation is clearly paid for.
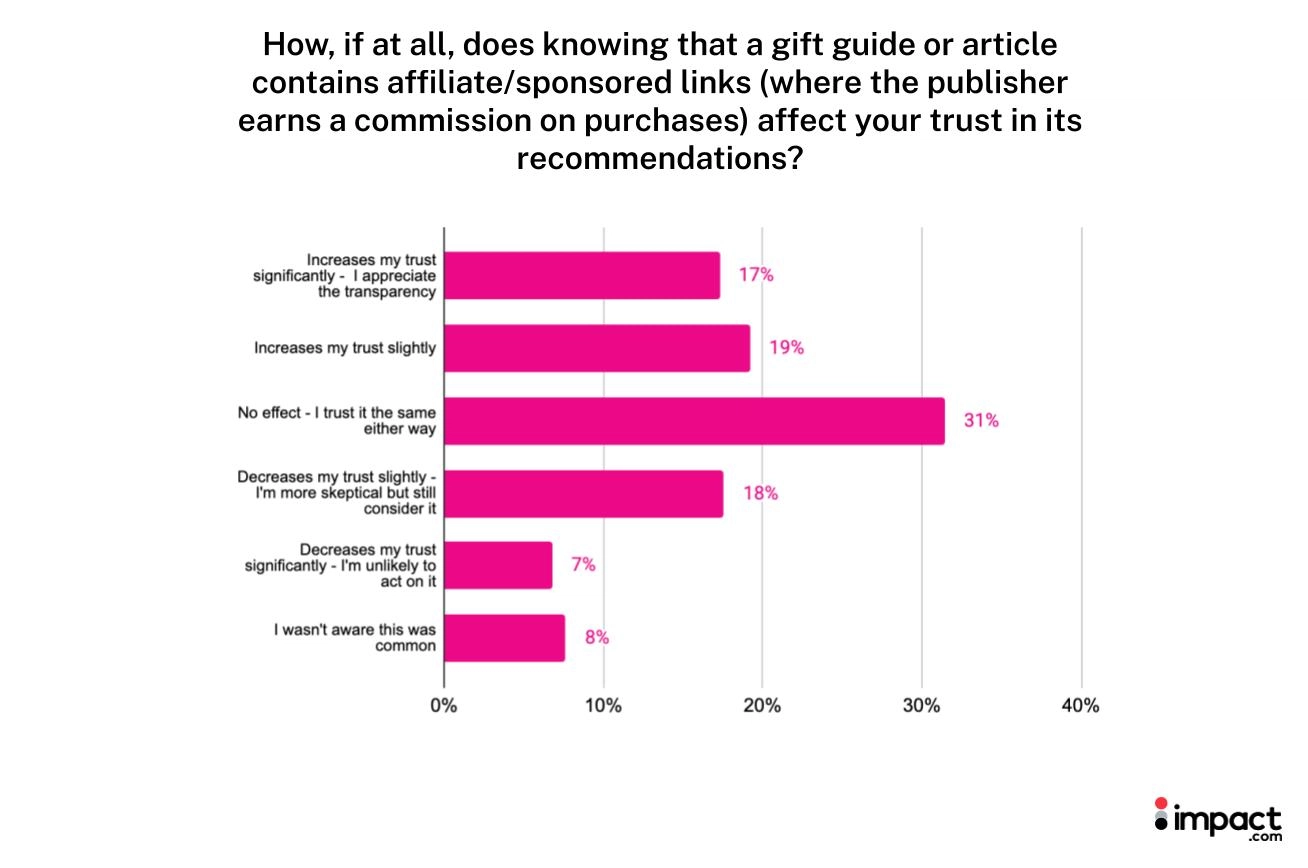
Brands sometimes treat disclosed affiliate links as a trust risk to manage or minimize. The data doesn’t support that assumption. A disclosed link:
- Has no effect on trust at all for the largest single group (31%)
- Increases it slightly or significantly (36%)
- Decreases it slightly or significantly (25%)
8. Verifiable value and consistency earn shopper trust this season
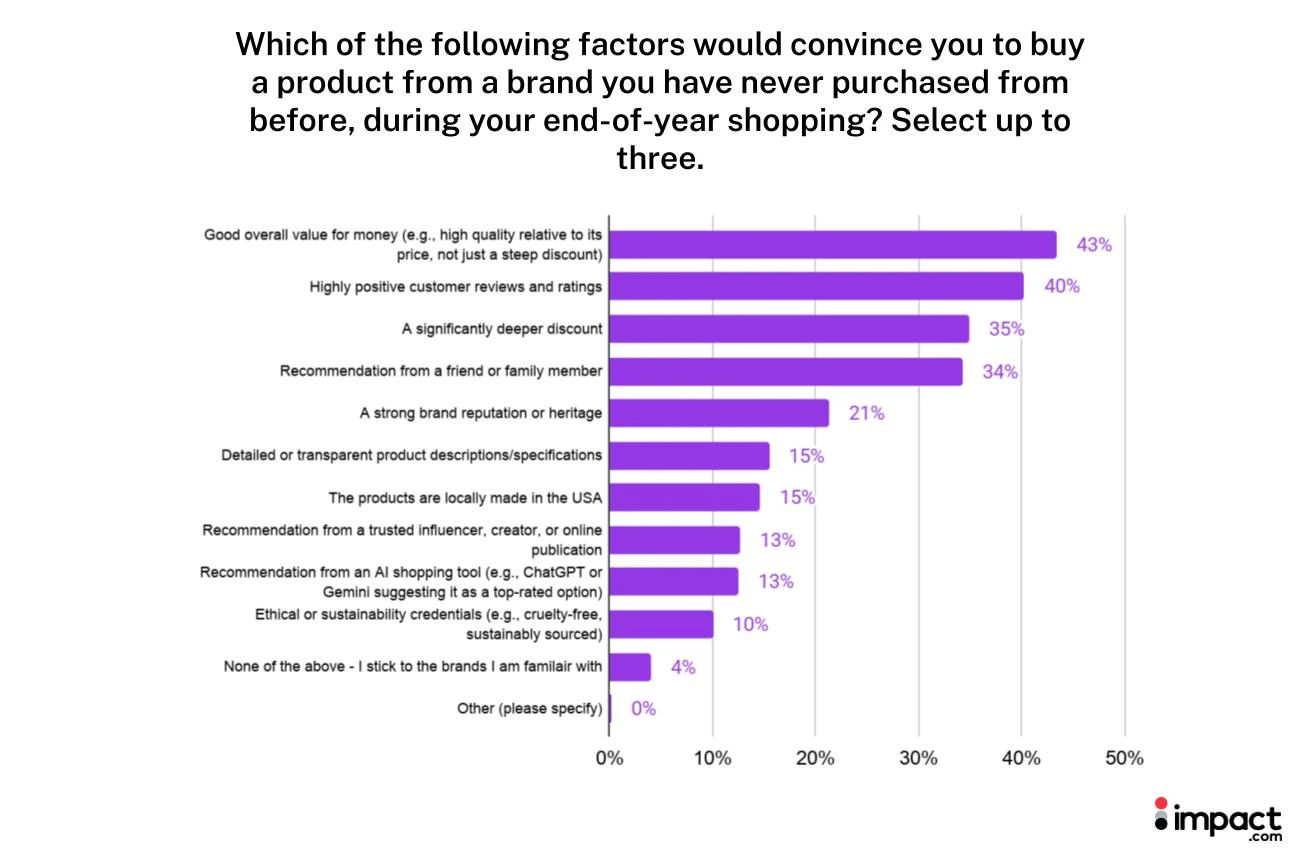
When a shopper isn’t already familiar with a brand, or two retailers carry the identical product, something has to decide the sale: what information a shopper can verify for themselves.
Good overall value for money (43%) and highly positive customer reviews and ratings (40%) lead the list of what would convince a shopper to buy from a brand they’ve never purchased from before, ahead of a significantly deeper discount (35%) or a recommendation from a friend or family member (34%).
Common threads run through all four:
- The terms of the deal (value, discount)
- Sources a shopper already trusts or can verify directly (reviews, friends and family).
Recommendations from a trusted influencer or online publication and from an AI shopping tool tie at the bottom (both 13%) as trust factors for convincing shoppers to buy from an unfamiliar brand. These recommendations may matter earlier in the process instead, helping put a product on a shopper’s radar before comparison and verification stages.
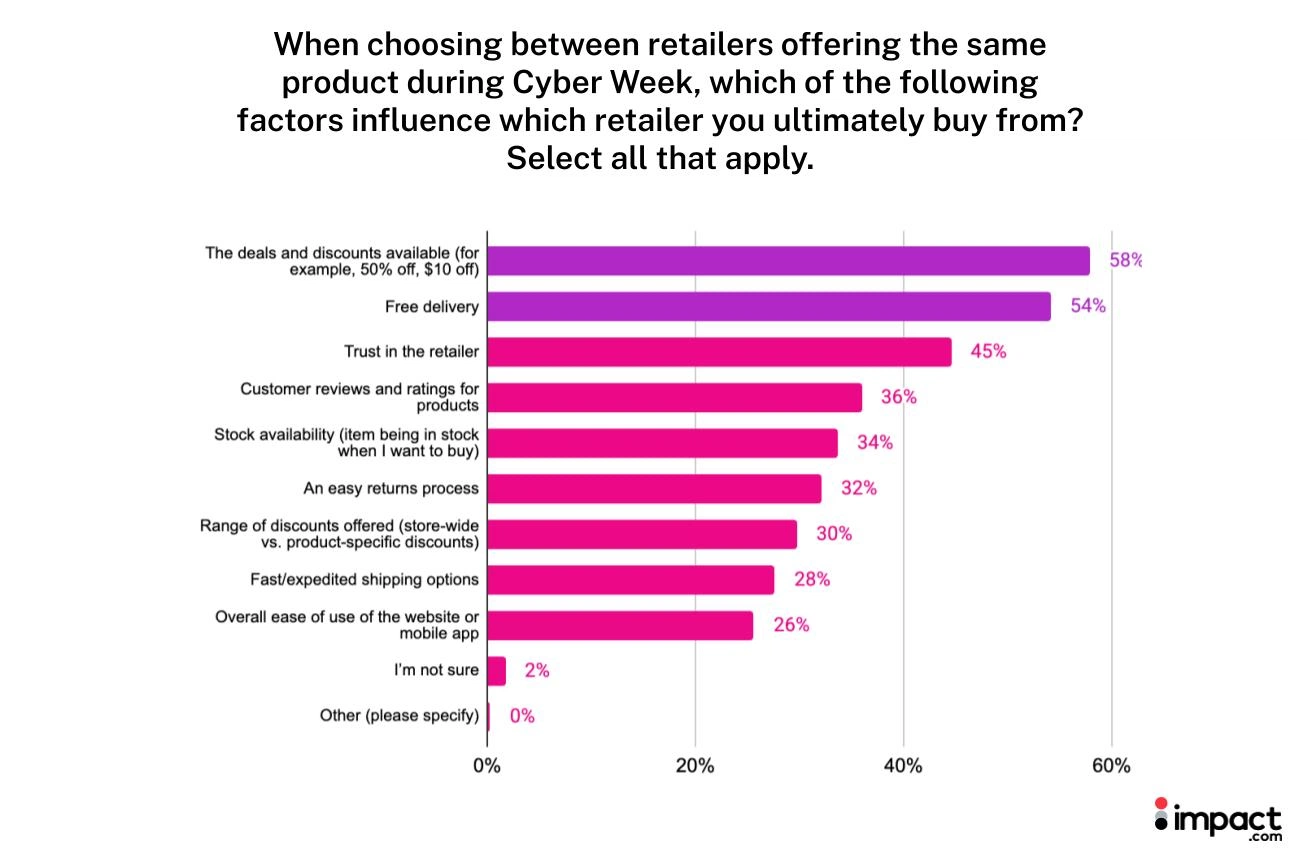
An established relationship with a retailer isn’t enough once shoppers can find an identical product elsewhere.
Deals and discounts (58%) and free delivery (54%) decide the purchase more often than reputational factors, such as trust in the retailer (45%) or customer reviews (36%). The better deal closes.
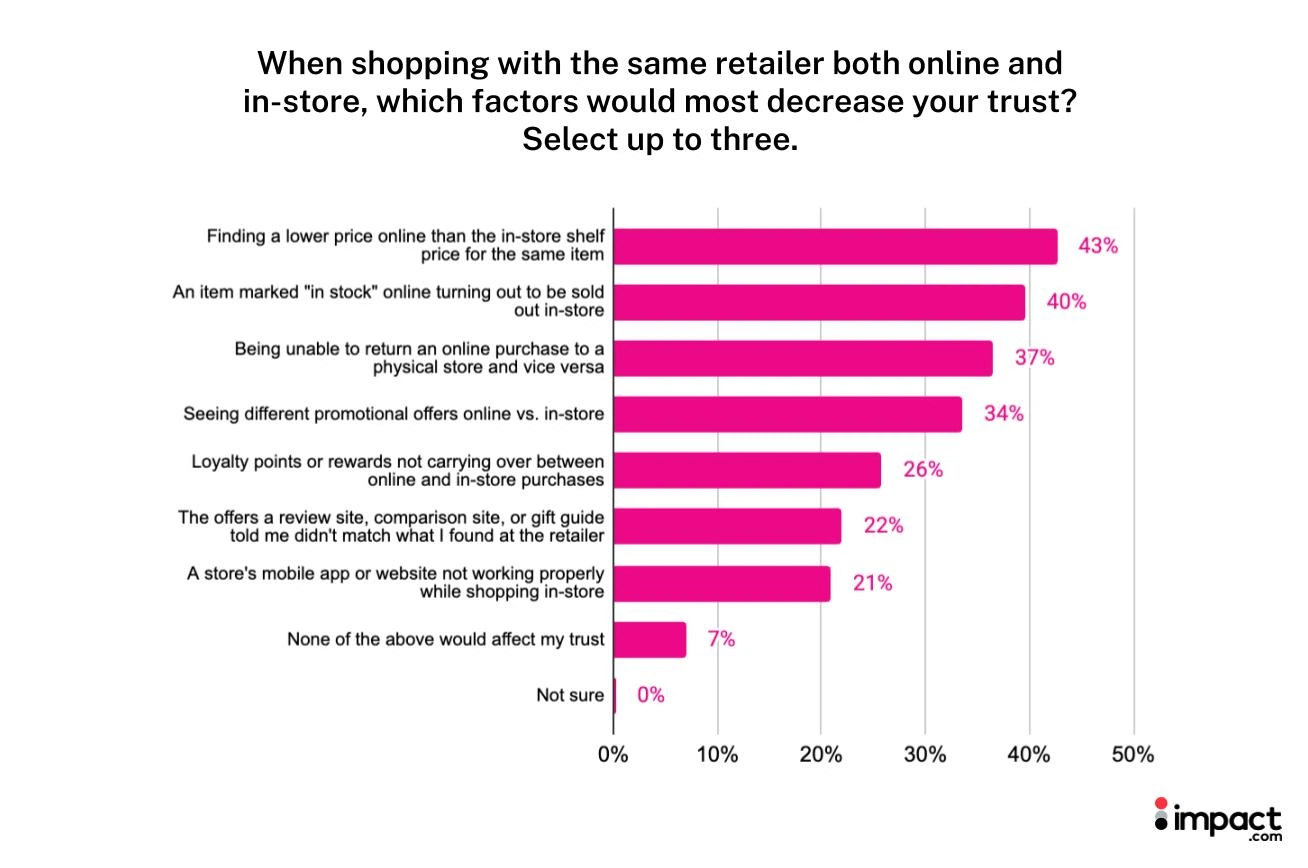
Even if your brand has already earned trust, it can be lost once a shopper directly compares its online and in-store experiences.
Almost all consumers (93%) who shop with the same retailer both online and in-store cited inconsistencies between the two experiences as trust breakers.
The most common inconsistencies that impact trust trace back to the same root cause—a retailer’s own systems don’t agree with each other:
- An online price differs from the in-store shelf price (43%)
- An item marked in stock online turns out to be sold out in-store (40%)
- An online purchase can’t be returned to a physical store and vice versa (37%)
None of these require a bigger marketing budget or a new campaign to fix—pricing, inventory, and returns systems all need to tell shoppers the same thing.
For a brand that’s unfamiliar to a shopper, or a retailer selling the same product as a competitor, that consistency alone can decide whether they buy from you or move to whichever retailer’s systems are in sync.
9. Shoppers use one channel to decide, another to buy
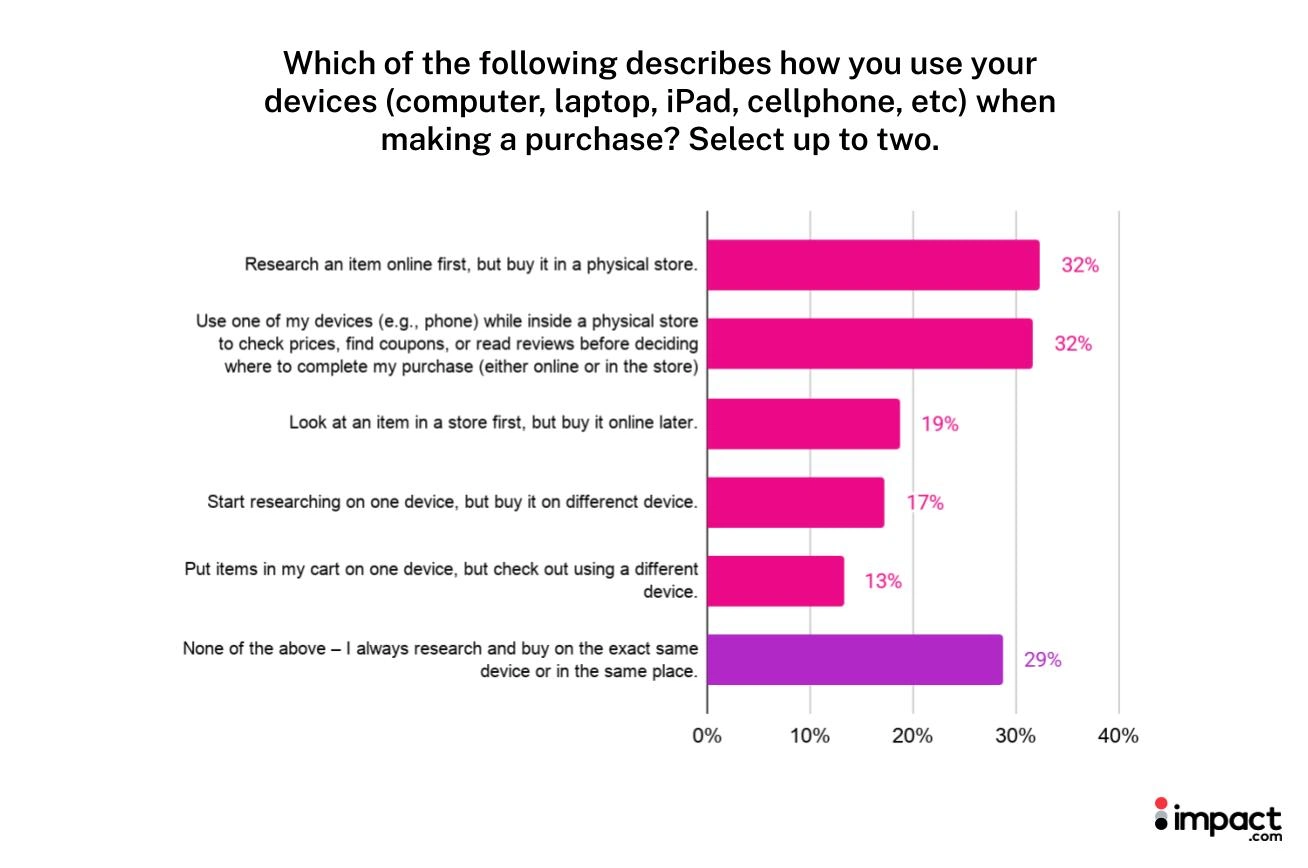
Most shoppers don’t rely on one source for the whole journey—they deliberately lean on different ones for different jobs: some channels do the guidance work, others complete it. Only 29% research and buy on the same device or in the same place every time.
The two most common journeys end at the physical store, but online research still plays a role:
- 32% research a product online, then buy in a physical store
- 32% check prices, find coupons, or read reviews on their phone while standing in a physical store before buying
The vast majority of journeys begin online, with only 19% looking at an item in store first and then buying online later.
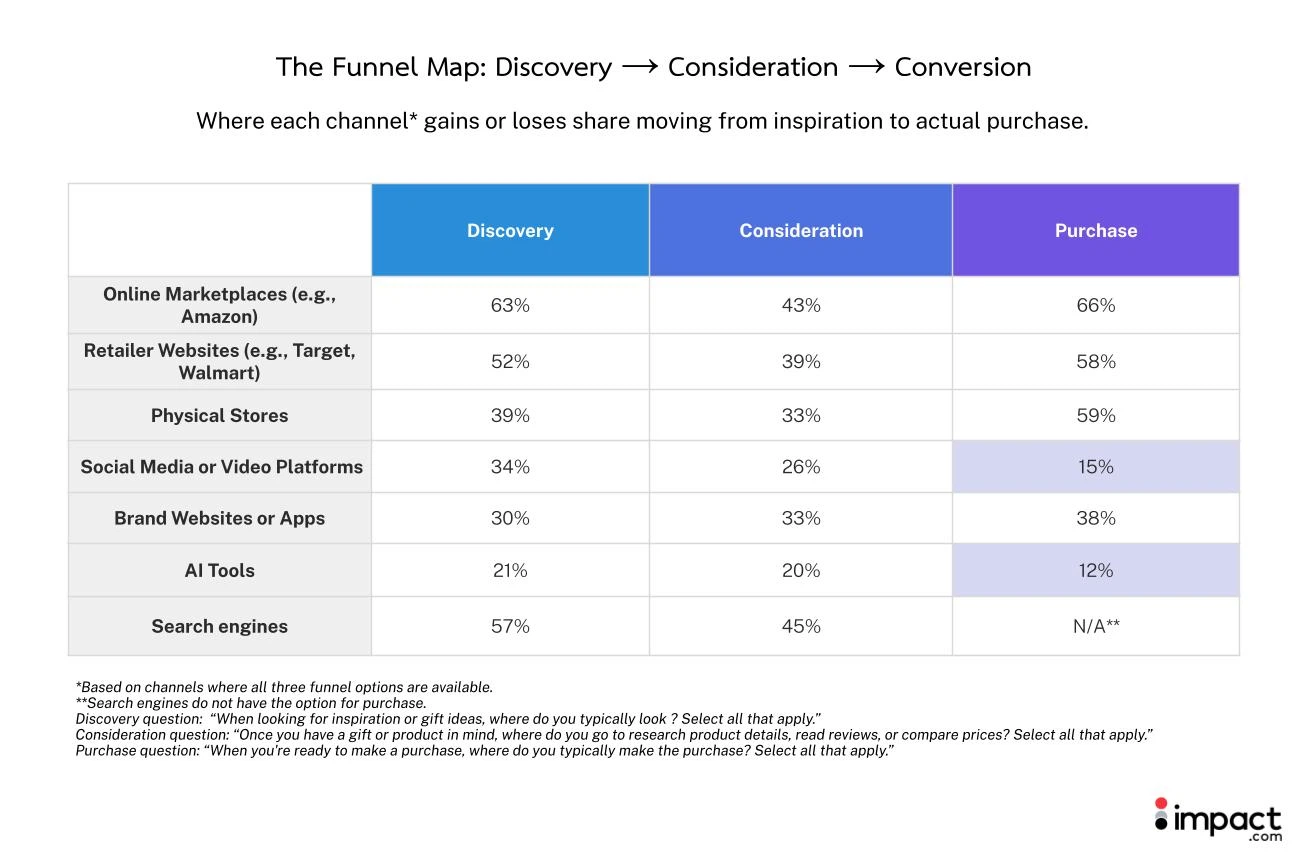
Comparing each channel’s share at discovery, consideration, and purchase shows two very different patterns: some channels hold or gain share all the way through, while others lose most of their audience before a sale happens.
Channels built for browsing and comparison lose shoppers by the time of purchase, while channels built to complete a transaction hold or gain them. For social media and AI tools, that gap means their real contribution to a sale through discovery and consideration often doesn’t show up in their purchase numbers at all.
10. AI shopping now converts, but adoption is generational
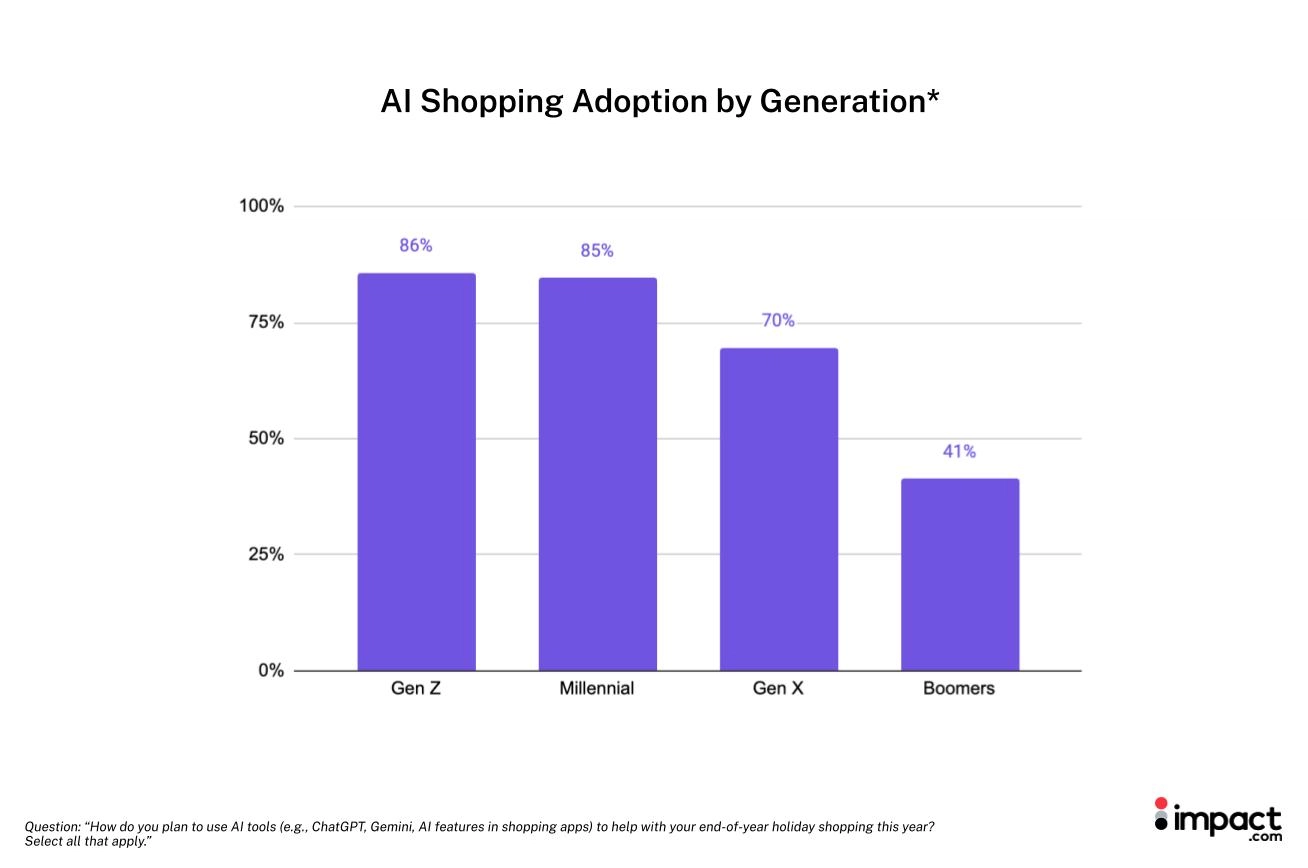
AI is no longer a niche tool for holiday shopping: 69% of shoppers will use AI tools in some form this season. But how widely varies sharply by age—86% of Gen Z shoppers plan to, against 41% of Boomers. The same two use cases led in 2025 as well.*
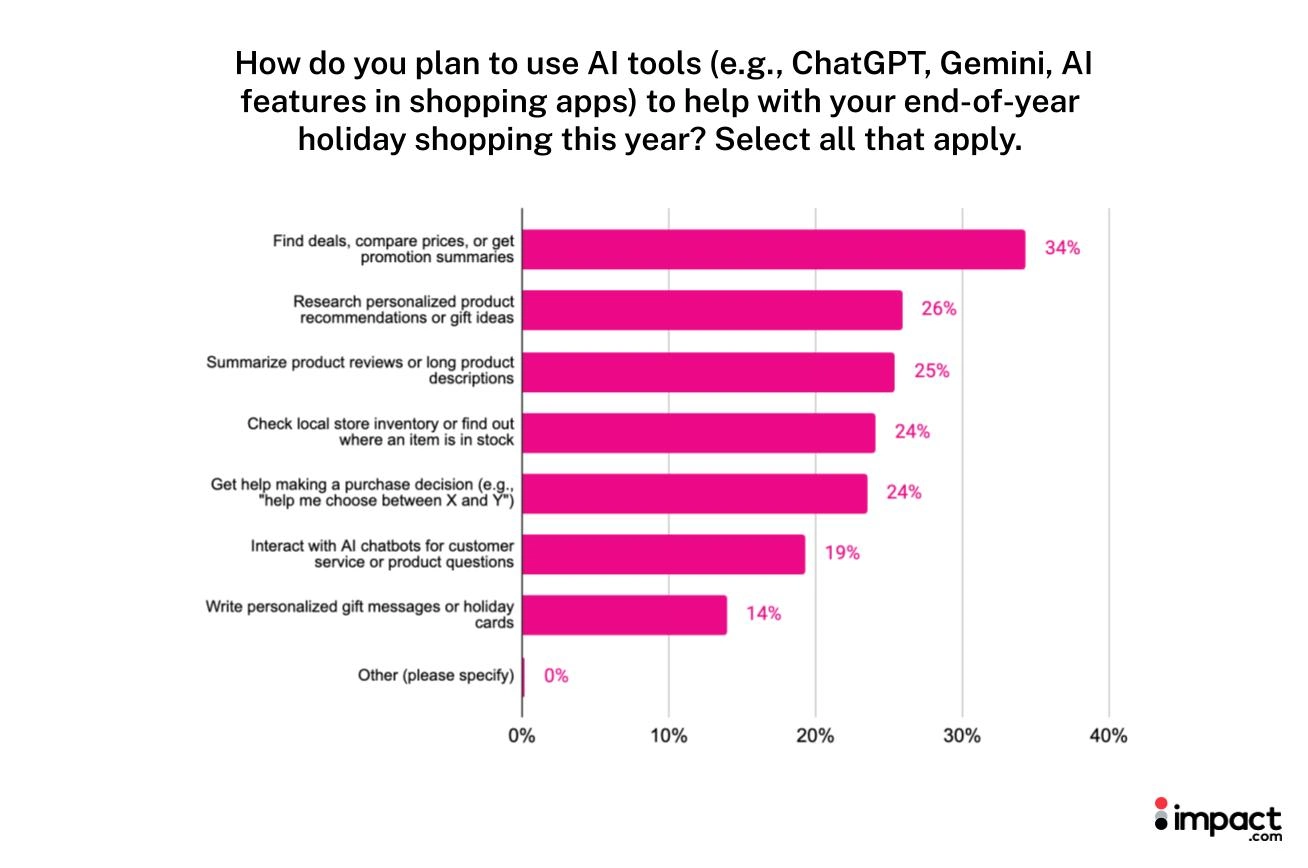
When shoppers do turn to AI, they’re mostly solving one of two problems: finding the best deal, or narrowing down what to buy. Some of the top use cases cluster around logistics that AI can answer quickly: finding deals, comparing prices, or getting a promotion summary (34%) as well as checking local store inventory (24%).
The other top use cases cluster around narrowing a decision: personalized product recommendations or gift ideas (26%), summarizing product reviews or long product descriptions (25%), and getting help deciding between two options (24%).
*The 2025 and 2026 surveys use slightly different wording and answer criteria, making this a directional comparison rather than an exact YoY comparison.
What a more deliberate shopper means for your Q4 2026 strategy
Cyber Week 2026 shoppers aren’t retreating from the holidays—they’re being more deliberate about how they get there.
That discipline shows up across every holiday shopping trend, whether it’s the 76% who still plan to spend the same or more this season to the discount thresholds they expect or the channels they trust enough to act on.
If you keep the same budget, discounts, and channels as last year, you risk losing ground to whoever tiers their discounts by price point, credits the channels that influence a sale, and reaches shoppers in the research window weeks before Cyber Week starts.
The programs that pull ahead this Q4 will be the ones that match that deliberateness—sharper offers, smarter channel allocation, and content that earns trust before the sale closes.
Discover more about 2026 shopping trends:
- Fewer sales, bigger stakes: First half of 2026 data shows how brands captured a pickier shopper [blog]
- Where Prime Day’s halo effect actually went in 2026 [blog]
Appendix
Appendix A: Full methodology
Participant eligibility and sample size
During July 2026, 1,046 consumers in the United States completed the study. To qualify for participation, respondents were required to meet several screening criteria:
- Reside in the United States.
- Be 18 years of age or older.
- Have made an online purchase within the 6 months prior to survey administration.
- Have at least some input in household purchasing decisions.
- Intend to shop during the upcoming holiday season.
The sample consisted of adults aged 18 and older. The survey was conducted at a 95% confidence level with a ±3.0% margin of error at the total sample level.
The age distribution of the final sample is detailed below:
- 18–29: 13%
- 30–45: 32%
- 46–61: 27%
- 62–71: 15%
- 72+: 12%
Sampling strategy and Household Income (HHI) distribution
The sample was sourced through a panel provider, using their vetted consumer panel networks.
The full HHI distribution of the study sample is detailed below:
- Less than $50,000: 19%
- $50,000–$99,999: 26%
- $100,000–$149,999: 30%
- $150,000+: 24%
- Prefer not to say: 1% (n=13)