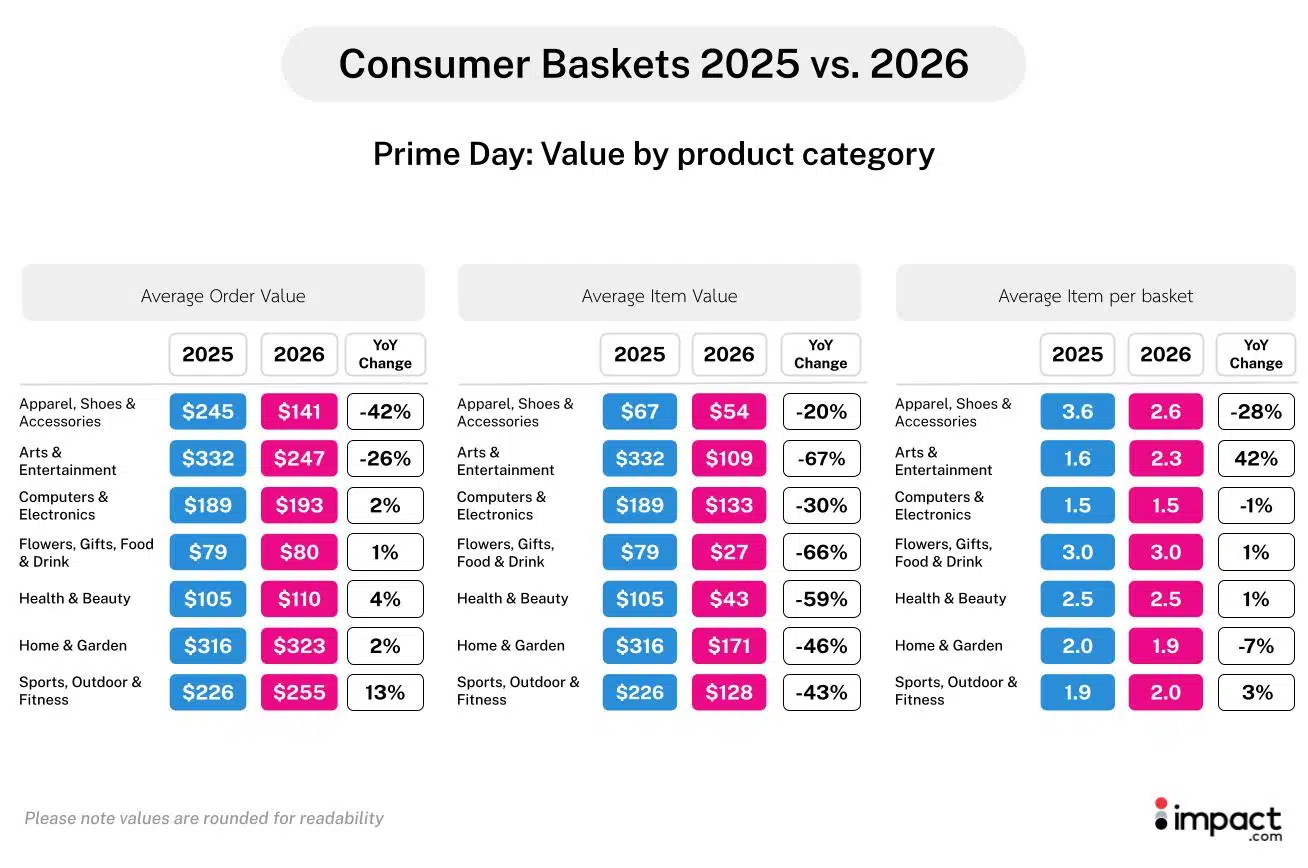

Overall, U.S. retail sales grew 6.7% year-over-year (YoY) in June 2026, according to the U.S. Census Bureau. Prime Day itself set a record too: U.S. shoppers spent $26.4 billion online during Amazon’s four-day event this year, up 9.3% YoY, according to Adobe Analytics.
But retail brands that built summer campaigns around Prime Day, hoping to catch Amazon’s halo effect, saw a different story inside their partner programs. Our analysis of 1,364 North American Retail & Shopping brands found that consumer spending tracked through partner and affiliate channels—on brands’ own sites, not Amazon’s—dropped 45% YoY during the same four days.
The market grew. The share of it flowing through affiliate-tracked channels didn’t.
Prime Day didn’t underperform, but the halo moved. Here’s where it went, and what it means for your next sales-event strategy.
Shoppers still showed up for Prime Day—just not on Prime Day
Prime Day 2026’s halo effect didn’t disappear. Instead, it stretched across the full month leading up to and including the event, diluting the four event days.
That shift showed up in what shoppers bought, how much they spent, and which partners got the sale:
- Partner performance diverged: Loyalty and Rewards Partners’ conversion rate dipped modestly (-13%), the smallest drop of any partner type, while Network and Media Arbitrage partners saw theirs fall by more than half (-60% and -55%, respectively).
- Pre-event spending increased while event spending fell: Average daily consumer spending in the days leading up to Prime Day rose 14% YoY, but declined 45% YoY during the four-day event itself.
- The purchase journey stretched: Shoppers took almost two days longer to decide what they wanted to buy (9.37 to 11.01 days), even as clicks climbed and conversion rate dropped 31%.
- Average order value (AOV) fell 27%: AOV dropped from $221 to $160—driven mostly by smaller baskets (items per basket down 22%) rather than lower-value items (item value down just 6%).
- One product category saw the biggest growth: Sports, Outdoor, & Fitness had the largest AOV increase of any category tracked (+13 +% YoY), driven by both bigger baskets and higher-value items.
Prime Day’s halo effect, redistributed, shapes what shoppers buy, how much they spend, and which partners earn the sale—here’s what to do about all three.
The data behind the insights
We compared impact.com data from 1,364 North American brands and retailers in the Retail and Shopping vertical during:
- Prime Day 2026 (June 23–26)
- Prime Day 2025 (July 8–11)
- The full month leading up to and including each Prime Day event
This doesn’t include any data from Amazon, and tracks performance on the brands’ and retailer’s owned channels only.
The metrics we focused on were chosen for their value to performance marketing teams: clicks, orders, conversion rates, average order value (AOV), consumer spending, and commission payouts across different partner types.*
*See the full methodology in Appendix A and the terminology in Appendix B.
4 ways the Prime Day halo moved—and how to move with it
Here’s the story behind each number that shifted, and what it means for how you approach your next sales event.
1. The most successful partner types focused on repeat customers
When shoppers slow down and research harder, they convert through partners they already trust.
Loyalty and cashback-driven partnerships, built on returning customers, held up far better in 2026 than channels focused on discovery or discounts—despite the event’s total transactions shrinking 25% YoY.
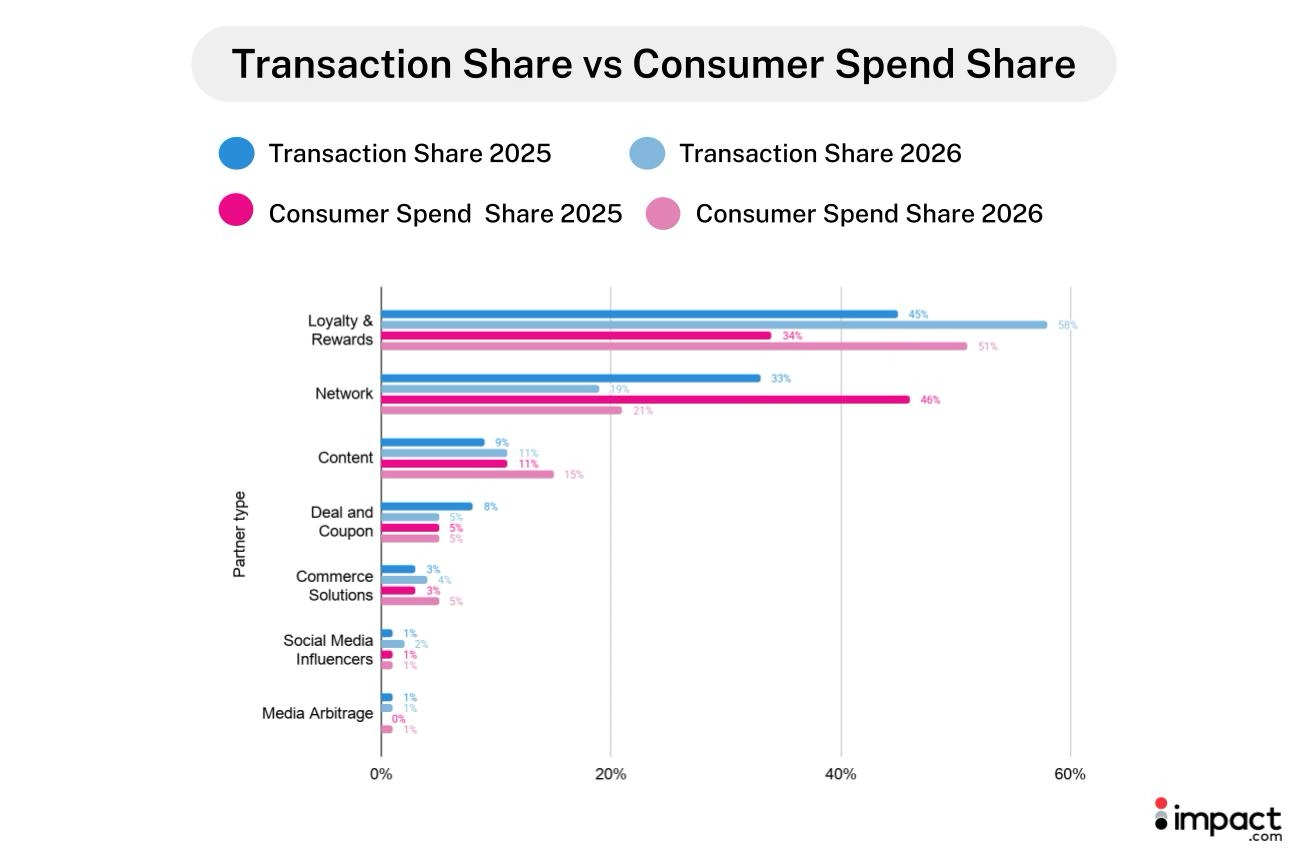
“Cross Monetization” and “Other” not shown in the tables as their values were less than 1%.
Loyalty and Rewards Partners drove over half of both transactions (58%) and consumer spend (51%) this year, showing the most growth among all partner types—13 percentage points and 17 percentage points YoY, respectively. This gap suggests that orders driven by this channel’s value shrank less than the broader market this year.
Network Partners moved in the opposite direction, falling from the leading consumer-spend contributor in 2025 (46%) to second in 2026 (21%). Its consumer spend share also dropped faster than its transaction share—a sign the orders it drove were worth less than in 2025.
Deal and Coupon Partners‘ contribution shrank this year. Clicks into deal-driven channels dropped by roughly half, pulling transaction share down from 8% to 5%. But consumer-spend share held flat at 5%, meaning the shoppers it did reach spent just as much as they did last year.
2. Consumer spending was diluted across the days leading up to Prime Day
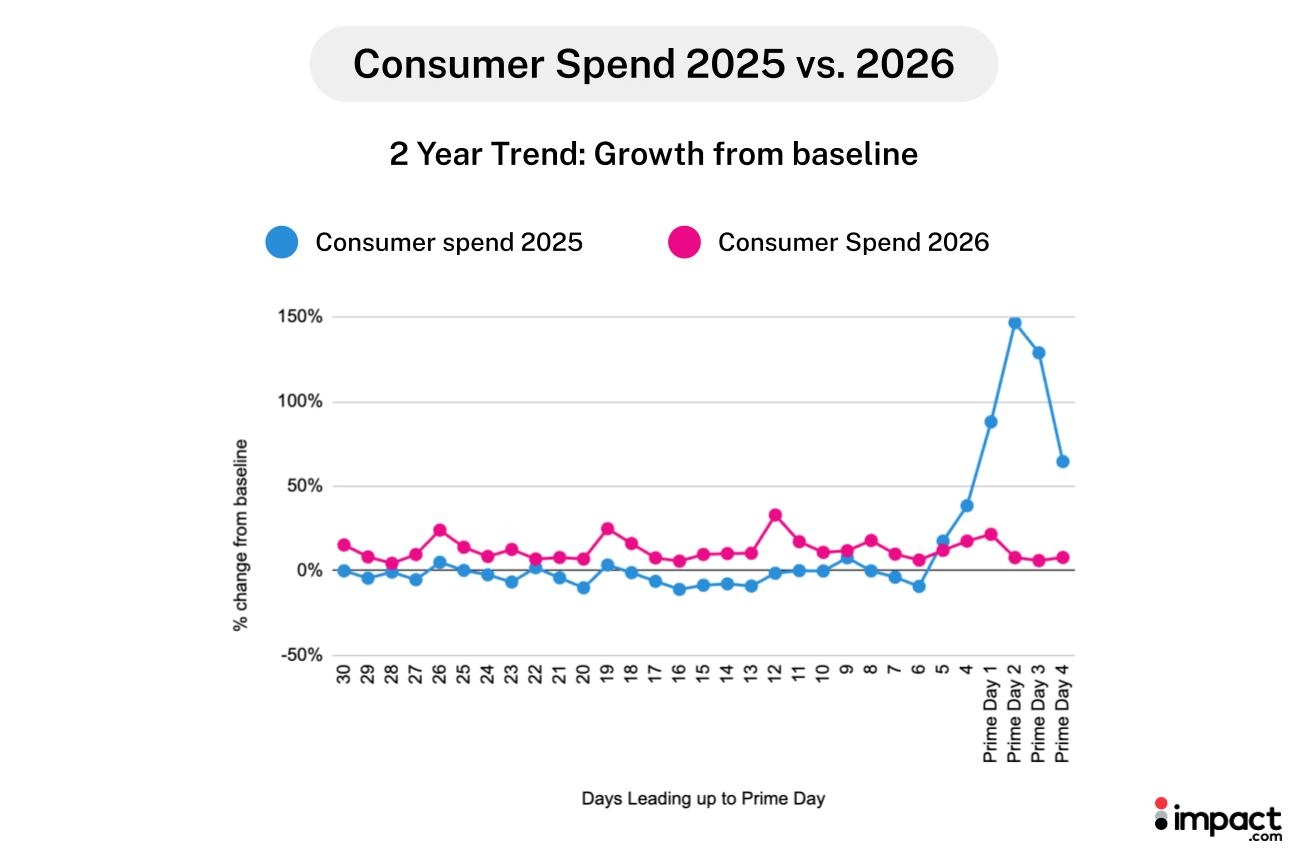
See how to interpret the graphs in Appendix C.
Consumer spending fell 45% YoY during the four-day event, with the sharpest drops on Day 2 and Day 3 and smaller declines on the opening and closing days.
Yet in the days leading up to Prime Day, average daily consumer spending actually rose 14% YoY.
Brands tend to judge Prime Day’s halo effect by how much consumers spend during the event itself. When those numbers drop, brands assume that the event underperformed. Prime Day 2026 shows that read doesn’t hold.
3. Shoppers took more time to research before buying
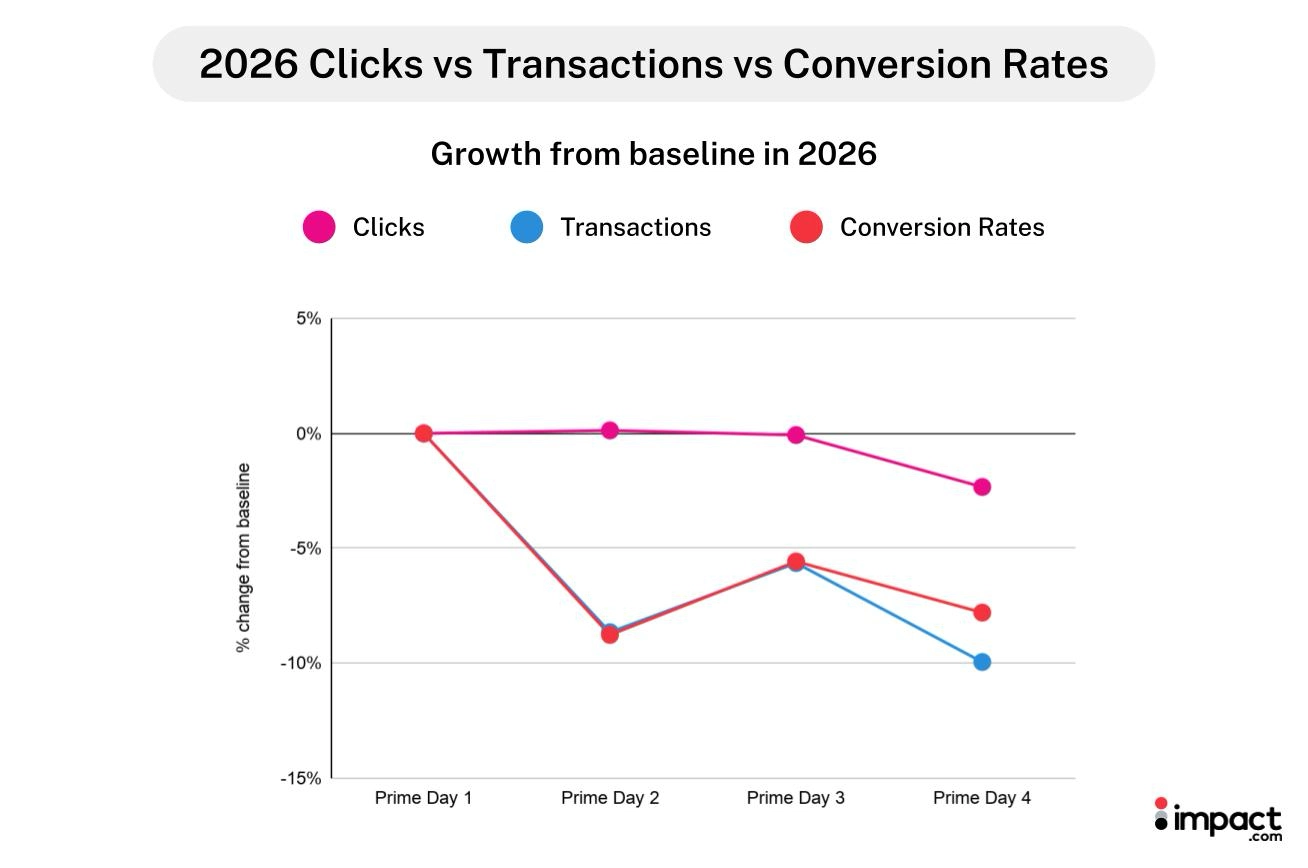
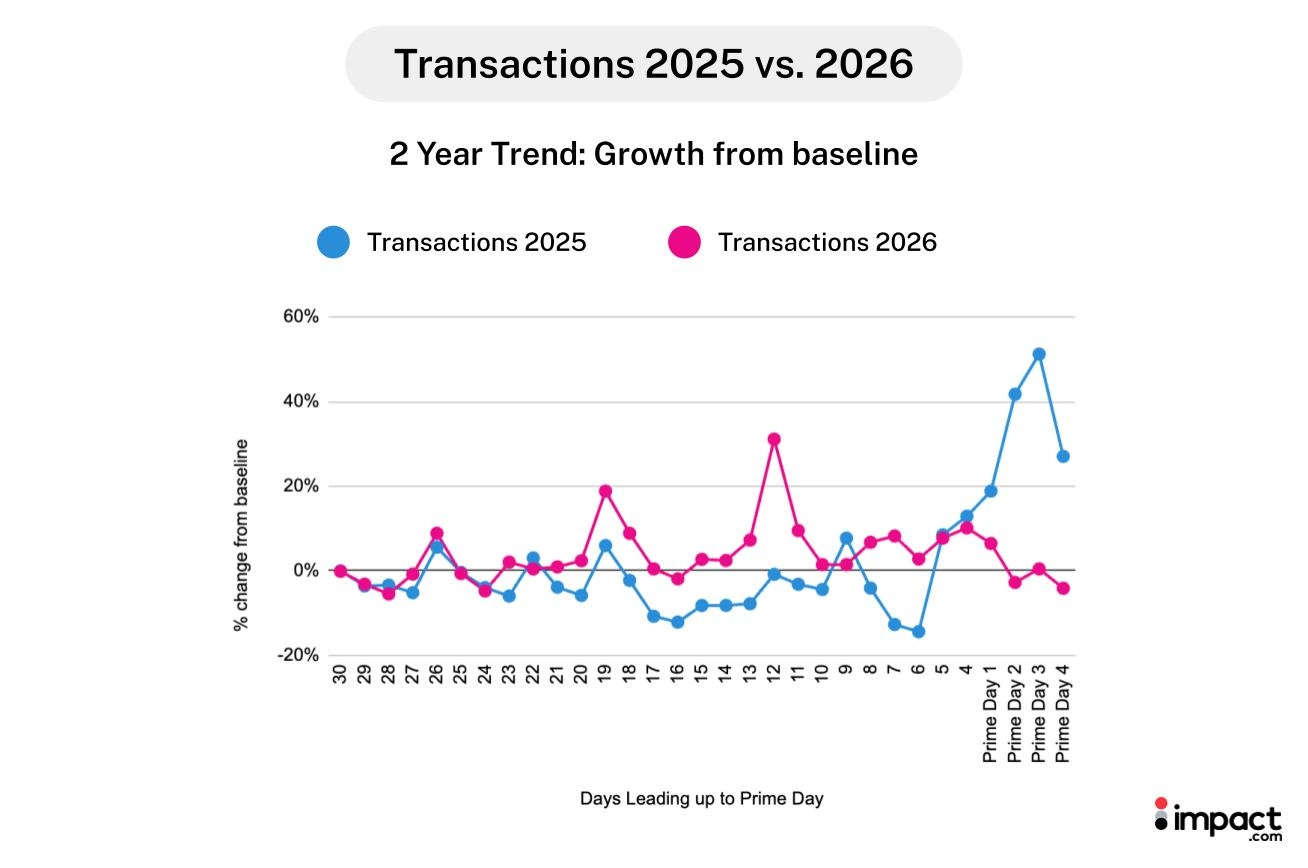
This graph has values calculated with Prime Day 1 as the baseline.
One reason for the spreading halo effect: shoppers front-loaded their purchases into the lead-up period rather than waiting until the event itself.
The average shopper journey lengthened YoY (9.37 days to 11.01 days)—almost two additional days of research, comparison, and deal-hunting before buying.
That extra time wasn’t idle browsing. Clicks rose 9% YoY across the full 31-day window, and click growth accelerated through the event while conversion rate declined 31% YoY.
Much of this time was likely spent researching and comparing prices. Numerator’s 2026 Prime Day tracker found that more than half of Prime Day shoppers compared prices across retailers before completing a purchase this year, confirming the longer window was spent shopping around, not just scrolling.
Shoppers kept browsing without converting: transactions fell 25% YoY as clicks kept climbing. Transactions also peaked earlier in 2026, with the single biggest jump landing 12 days before the event’s final day.
4. Smaller basket sizes drove down average order value
When brands see a falling AOV, they usually reach for pricing adjustments as the fix—in 2026, that’s only part of the answer. Shoppers weren’t just paying less per item. They were buying less, period.
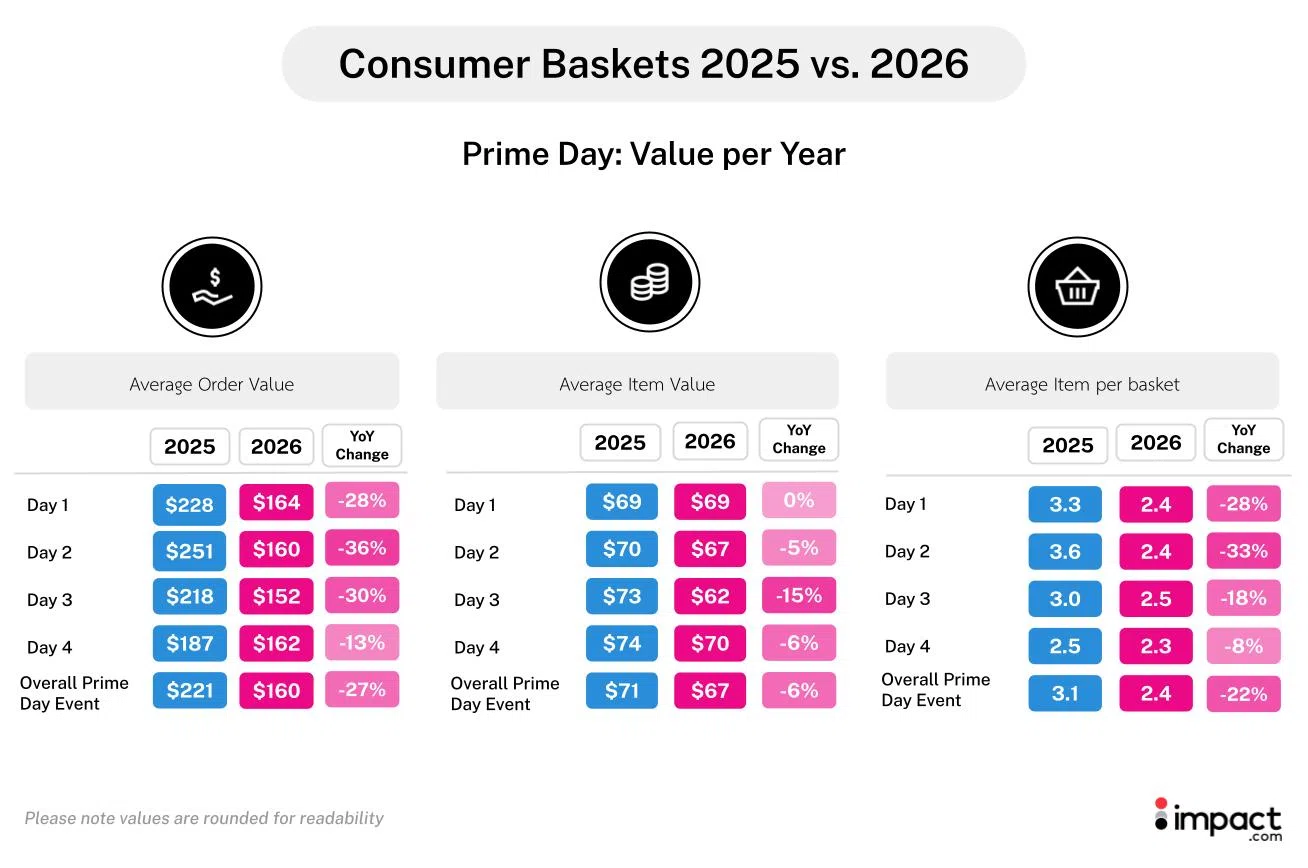
Shoppers put 22% fewer items in their basket, and the items they did buy were worth less too (-6%). The decline wasn’t even: basket size dropped nearly four times as much as item value did.
That gap between basket size and item value wasn’t constant across the event, either. Day 2 was the weakest day across the board: basket size fell hardest (-33% YoY), and the conversion-rate decline widened the most, from -15% YoY on Day 1 to -35% on Day 2.
Item value stayed close to flat through Day 2, then dipped 15% YoY on Day 3, closing most of the gap by the back half of the event. Days 2 and 3 were the weak point across conversions and AOV—pricing just caught up later than basket size did.
Treat this as a pricing problem alone, and you’ll fix the smaller issue while leaving the larger one untouched.
The basket size story played out differently by product category
Basket size drove the AOV decline in aggregate, but the pattern shifts by product type. Three specific product categories show how differently the same event can land.
| Product category | AOV change | Items per basket | Item value | Consumer spend |
|---|---|---|---|---|
| Apparel, Shoes, & Accessories | −41% | −26% | −20% | -65% |
| Arts & Entertainment | −25% | +42% | −47% | -15% |
| Sports, Outdoor, & Fitness | +13% | +3% | +10% | 7% |
To see consumer basket data for every product category, see Appendix D.
Apparel, Shoes & Accessories pulled back across every metric, with item value shrinking almost as much as basket size (−20% vs. −26%), and consumer spend in the category down 65% overall—the most notable decline of any category tracked. Transactions fell 40% YoY and conversion rate dropped 41%. Shoppers weren’t just buying smaller baskets, fewer were converting at all.
The category faced unusual cost pressure heading into the event: the average U.S. tariff rate on apparel imports jumped from 14.7% to 35.1% between January and December 2025, according to trade data compiled by University of Delaware’s Sheng Lu. Retailers absorbed that cost instead of raising prices—the same analysis found clothing retail prices rose just 0.3% over the same period. Margin pressure without price increases, plus 2026’s broader pullback in consumer confidence, may explain why apparel shoppers traded down to lower-value items rather than abandoning the category over higher prices.
Arts & Entertainment also saw AOV decline (-25%), but for a different reason: steep discounts and lower value items. Basket size actually jumped 42% (1.6 to 2.3 items)—the decrease came from item value (-47% YoY). Like Apparel, this category may also reflect weakening consumer confidence and pullback on non-essential spending.
Sports, Outdoor & Fitness had the biggest AOV gain of any tracked category, rising 13% YoY on fuller baskets (+3%) and higher-value items (+10%). AOV increased 13% YoY, driven by fuller baskets (+3%) and higher-value items (+10%). Fewer shoppers converted, but the ones who did spent more: consumer spending grew 7% YoY even as transactions and conversion rates dropped (-5% and -22%, respectively).
The category’s timing may be a factor: Prime Day 2026 overlapped with the 2026 FIFA World Cup, and landed closer to peak early-summer outdoor season than in 2025.
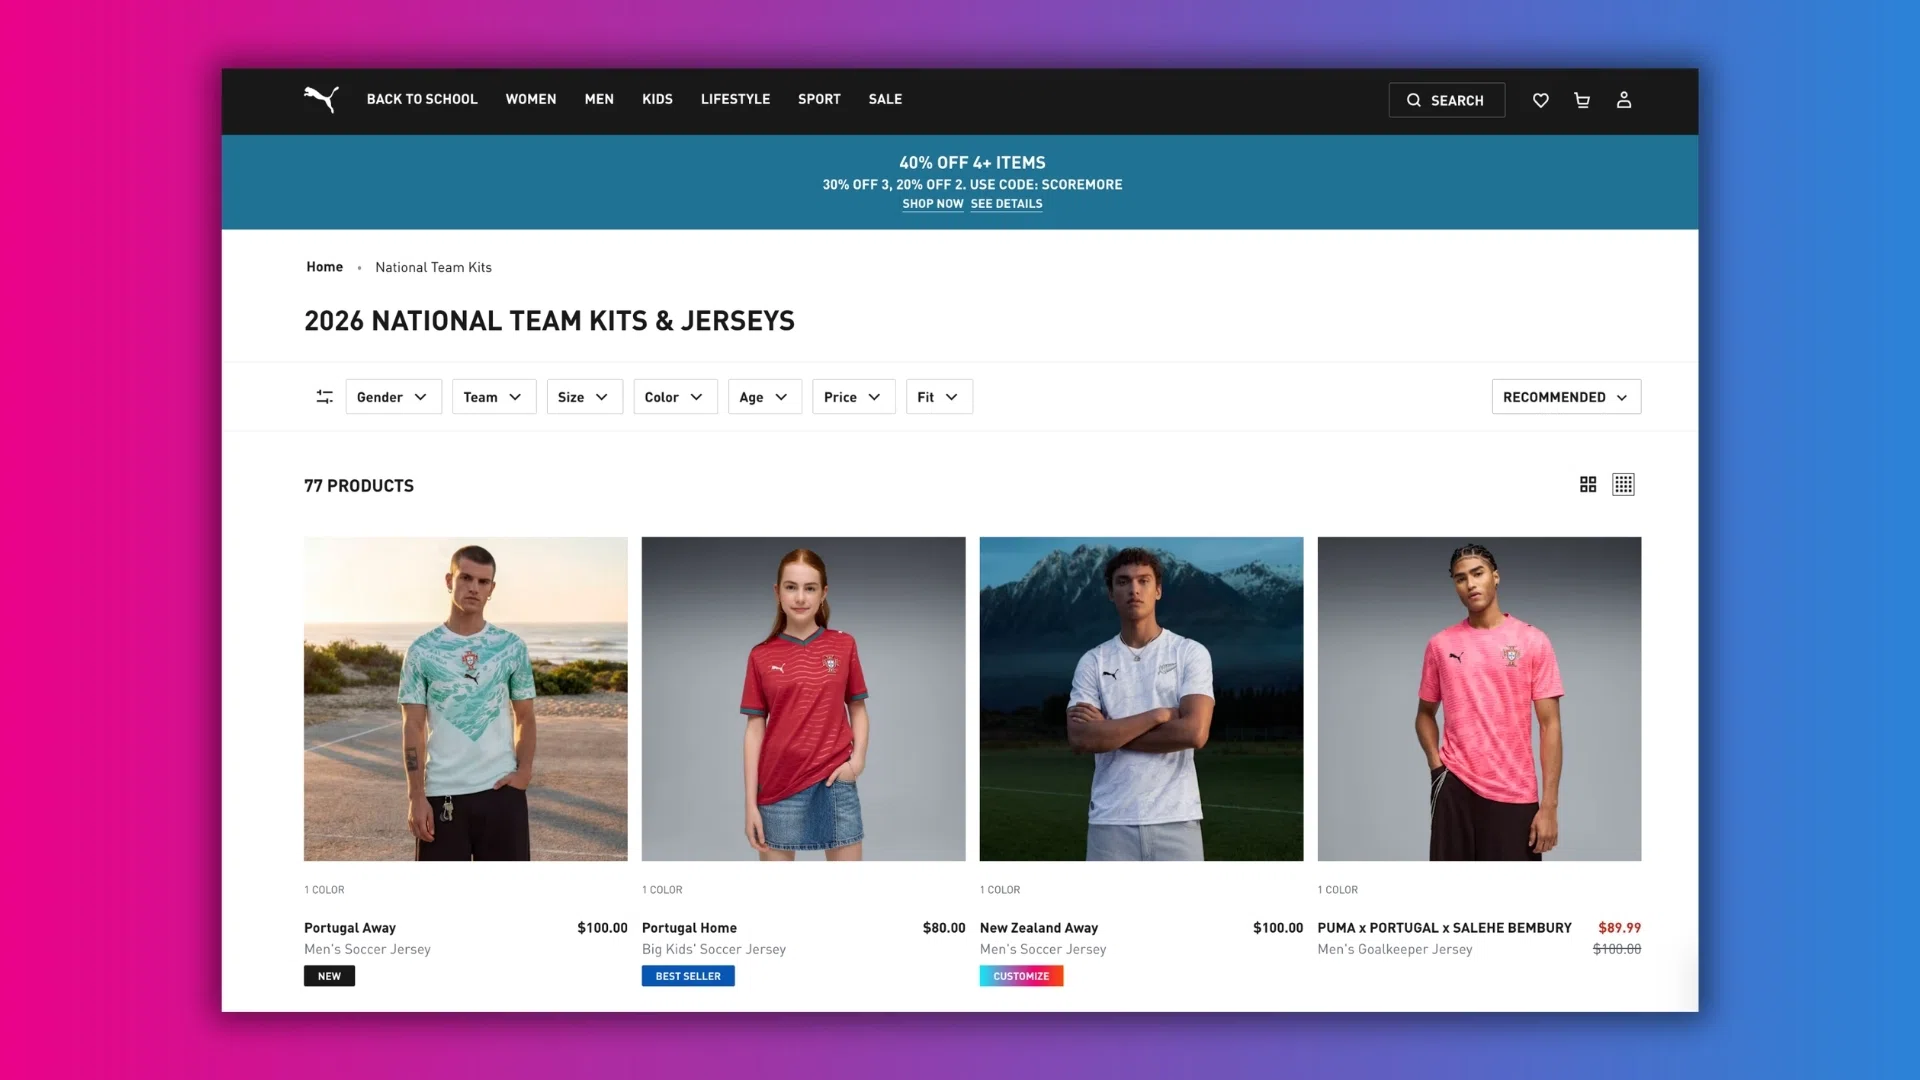
Many companies, such as PUMA, began selling 2026 FIFA World Cup jerseys and other merchandise around this period.
Why this happened: forces reshaping how people shopped the sale
Prime Day looked different in 2026 than it did in 2025—event-window spending decreased 45% YoY alone, with transactions, conversion rate, and brand spending all moving just as sharply.
That decline sits next to a record-breaking headline number. According to Adobe Analytics, U.S. shoppers spent $26.4 billion online during Amazon’s four-day event this year, up 9.3% YoY. That figure tracks total online spending across every retailer and platform.
Our analysis measures something narrower: partner-driven revenue on brands’ own owned channels. The two numbers are answering different questions: total online spending grew, and less of it moved through the partner-tracked channels this report covers.
Several market forces could explain why, and though many of them aren’t directly proven by this dataset, they’re worth considering:
- A broader pattern of research-heavy shopping. As consumers become savvier, they research more before buying. Our data showed that the buyer’s journey lengthened from 9.37 to 11.01 days for this shopping event alone.
- Prime Day’s earlier calendar slot. This year’s Prime Day lead-up window falls mostly in May and June, where 2025’s fell mostly in June and July. Some of this year’s changes could be seasonal rather than behavioral.
- The relatively new 4-day event format. This is only the second year Amazon has extended Prime Day into a 4-day event, meaning shoppers may simply be adjusting to the new timeline.
- Weakening consumer confidence. The University of Michigan’s Consumer Sentiment Index fell to its lowest level in the survey’s 74-year history in 2026, with one-year expectations running 7% below 2025 levels. That pattern may influence the heavy research and careful spending seen on Prime Day, and pullbacks in conversion rates and discretionary product categories.
- The 2026 FIFA World Cup. The tournament ran June 11 to July 19, 2026, overlapping Prime Day’s 2026 event window, possibly influencing certain category-level increases this year.
How to change your marketing approach for the reshaped Prime Day halo
Prime Day’s halo effect redistributed in 2026, spreading across the calendar and concentrating in fewer partner types. The longer research window behind that spread showed up in smaller, more deliberate baskets.
The consolidation favored partnerships anchored in existing shopper relationships and pulled back from channels built on broad reach—for brands, both the timing and partnership mix behind a Prime Day strategy need to change to keep pace.
Together, the four signals describe a shopper who’s harder to win in the moment. They research longer before buying, spend more deliberately once they do, and increasingly convert through partnerships they already trust rather than ones they’re discovering for the first time.
Prime Big Deal Days is the next test. Move budget earlier in the window. Find out which partners convert best for your brand, and fund them first. Stop measuring the event by the event days alone. The brands that adapt now write the Black Friday playbook everyone else will copy in December.
Discover more about the Prime Day Halo effect and how to implement sales event tactics:
- Prime Day 2025’s four-day format reveals the limits of extended sales events [blog]
- Beyond bargain bins: A guide to partnering with coupon partners and deal sites for growth [blog]
- How to find affiliate marketing partners at scale through AI-powered discovery [blog]
Appendix
Appendix A: Full methodology
We tracked and analyzed key performance metrics—clicks, transactions, average order value, consumer spending, and brand spending for 1,364 North American brands in the Retail and Shopping vertical.
These metrics were tracked during the Amazon Prime Day sale event on June 23–26, 2026, and compared to last year’s sale dates of July 8–11, 2025.
Both events ran for four days, but the 2026 event took place nearly three weeks earlier in the calendar than the 2025 event.
To help keep this comparison fair, metrics covering the lead-up period are measured as the month immediately preceding and including each year’s event, rather than fixed calendar dates. The lead-up window moves with the event each year, preserving a consistent relationship between the lead-up period and Prime Day itself.
However, this does not fully control for the underlying seasonal shift, since the 2026 lead-up window falls mostly in May/June rather than June/July. Some year-over-year differences observed in this report may still reflect seasonal shopping patterns tied to that earlier timing, rather than a change in event performance alone.
Appendix B: What the terminology means
| Term | Definition |
|---|---|
| Total brand spending | The sum of action-based (commission payouts) and non-action-based payments (bonuses, paid placement fees, etc). |
| Non-action based payment (Fixed expenses) | Brand expenditure that occurs when brands pay their partners, bonuses, paid placement fees, etc. |
| Action-based payment (commission) | Brand expenditure that occurs when brands pay their partners a commission for a specific, predefined action. |
| Network partners | Publisher platforms that broker access to brand campaigns and provide tracking, reporting, and payment services. This includes publishers categorized as network, syndication blog networks, or CPA networks. |
| Content review partners | Publishers that produce editorial content to promote, compare, and list products and services. This includes premium publishers, shopping comparisons, financial comparisons, content, bloggers, etc. |
| Loyalty and rewards partners | Publisher platforms that incentivize transactions from consumers, employees, or businesses through a membership or benefits reward program. |
| Voucher and coupon partners | Publishers who aggregate and classify coupons, vouchers and/or discounts for consumer savings. |
| Technology solutions (Commerce Solutions) | Innovative technological solutions that enhance the customer experience and drive conversions through various touchpoints, such as banking integrations, post-checkout offers, retargeting tools, or embedded software solutions |
| Media arbitrage | Search engine, social, or programmatic marketers that manage keyword campaigns for brands, often on a performance basis. |
| Cross-audience monetization | Businesses that publish offers, content, and complementary (non-competing) products to current customers or audiences (e.g., exit traffic, improved UX) to drive incremental revenue. |
| Analysis period | Prime Day Sales event: July 8-11, 2025 vs. June 23-26, 2026.The month leading up to and including Prime Day: June 11 to July 11, 2025 vs May 26 to June 26, 2026 |
Appendix C: How to interpret the graphs
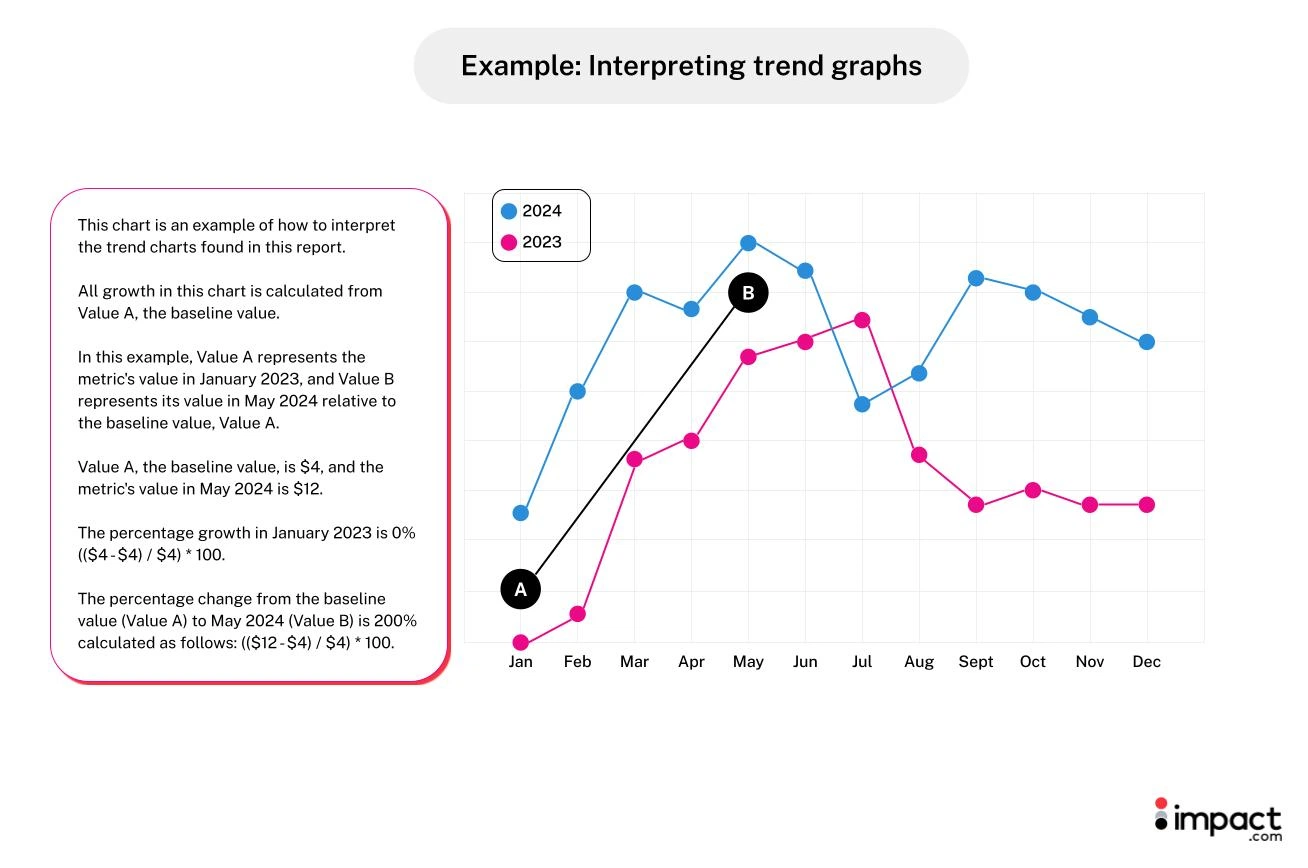
This chart is an example of how to interpret the trend charts found in this report.
All growth in this chart is calculated from Value A, the baseline value.
In this example, Value A represents the metric’s value in January 2026, and Value B represents its value in May 2026 relative to the baseline value, Value A.
Value A, the baseline value, is $4, and the metric’s value in May 2026 is $12.
The percentage growth in January 2025 is 0% (($4 – $4) / $4) * 100.
The percentage change from the baseline value (Value A) to May 2026 (Value B) is 200% calculated as follows: (($12 – $4) / $4) * 100.
Appendix D: Consumer baskets 2025 vs. 2026 by product category