

October Prime Day 2025 defied traditional retail math. Revenue climbed 5% YoY while average order value fell 6% YoY. This is an equation that, by conventional logic, shouldn’t produce growth at all.
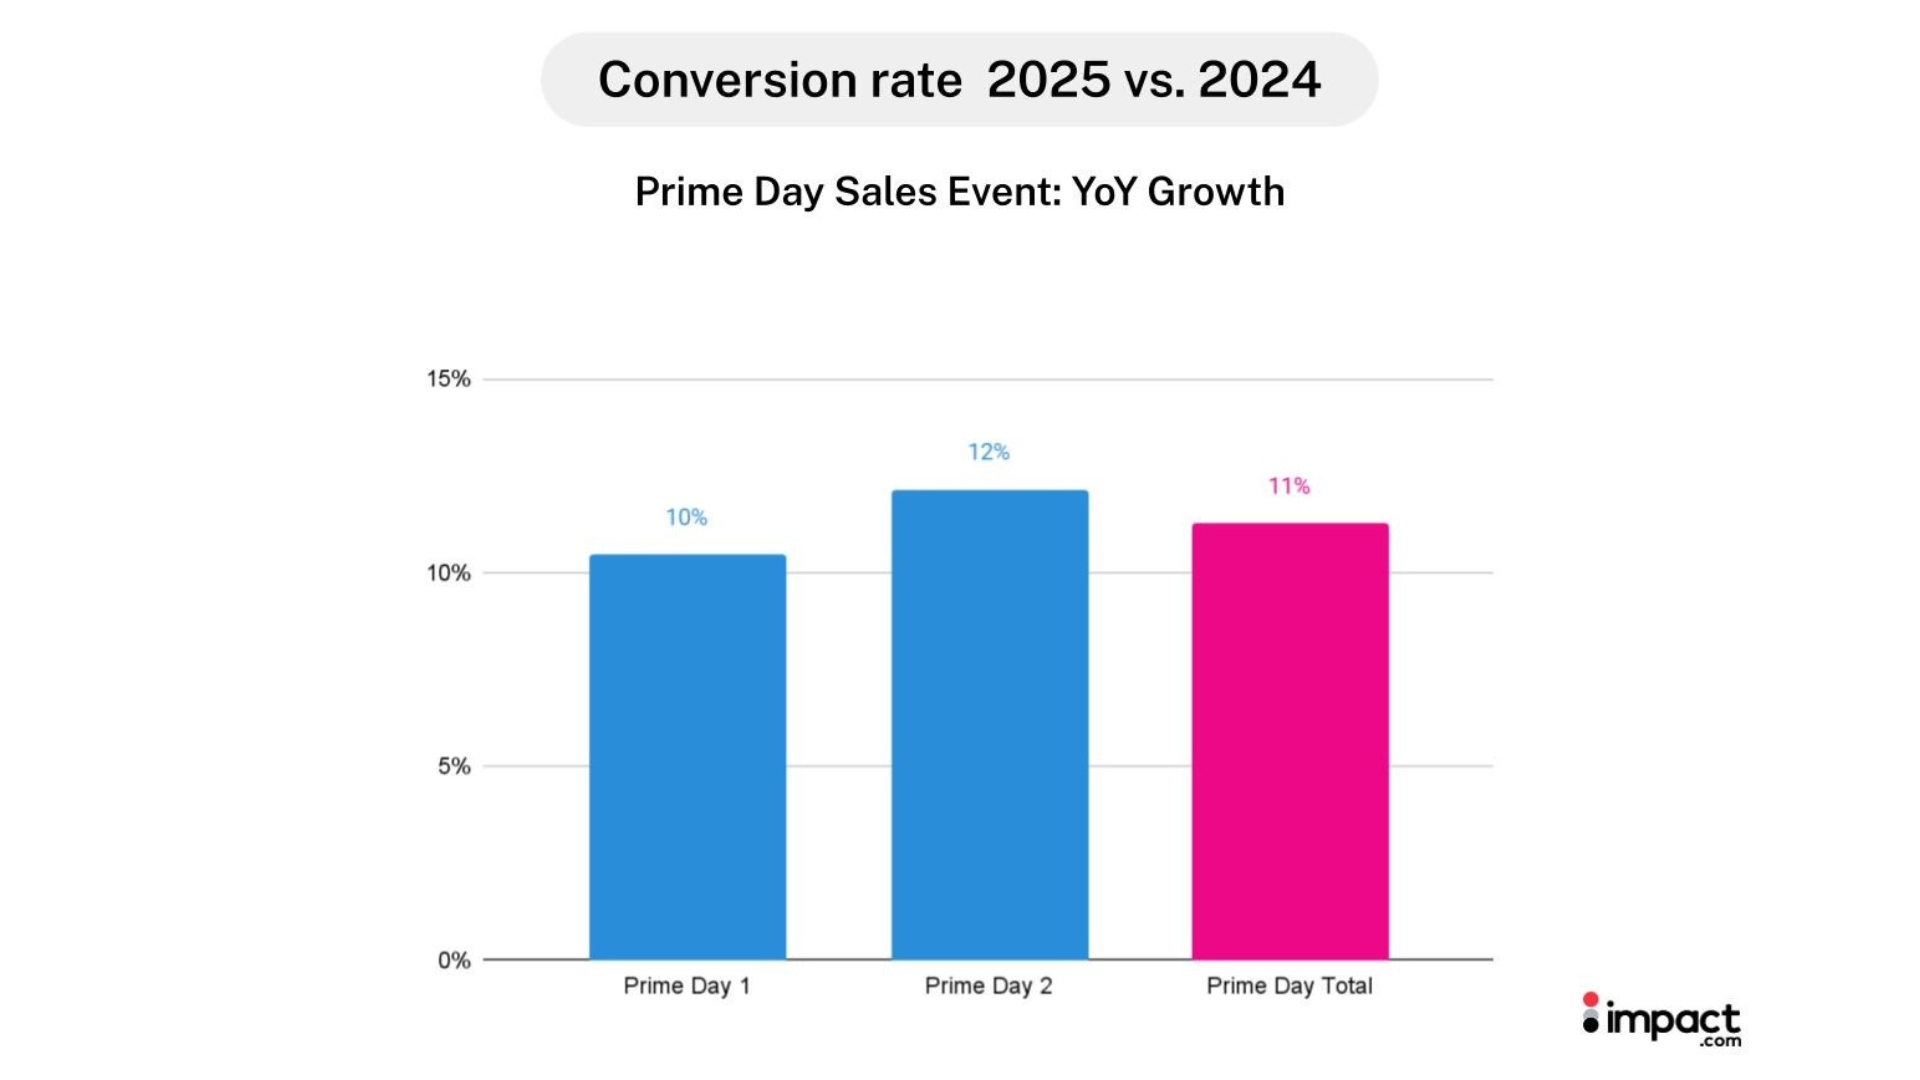
Yet orders surged 12% YoY, conversion rates jumped 11% YoY, and brands walked away with a fundamental lesson about how commerce works in compressed, high-urgency sales windows. Our data confirm that this volume-for-value trade-off during the sales event was successful.
So how do you deliberately engineer that trade-off, and what does it cost?
This year’s two-day October Prime Day event became a proving ground for that strategy. While Amazon’s extended four-day July Prime Day diluted urgency and saw average daily conversion rates decline 3% YoY, October’s compressed format maintained intensity. The result: efficient growth driven not by premium pricing, but by getting more people to buy more often.
The top-line performance:
- Orders: +12% YoY — transaction volume powered growth
- Clicks: +1% YoY — a modest increase in overall traffic
- Conversion rates: +11% YoY — traffic quality, not quantity, drove results
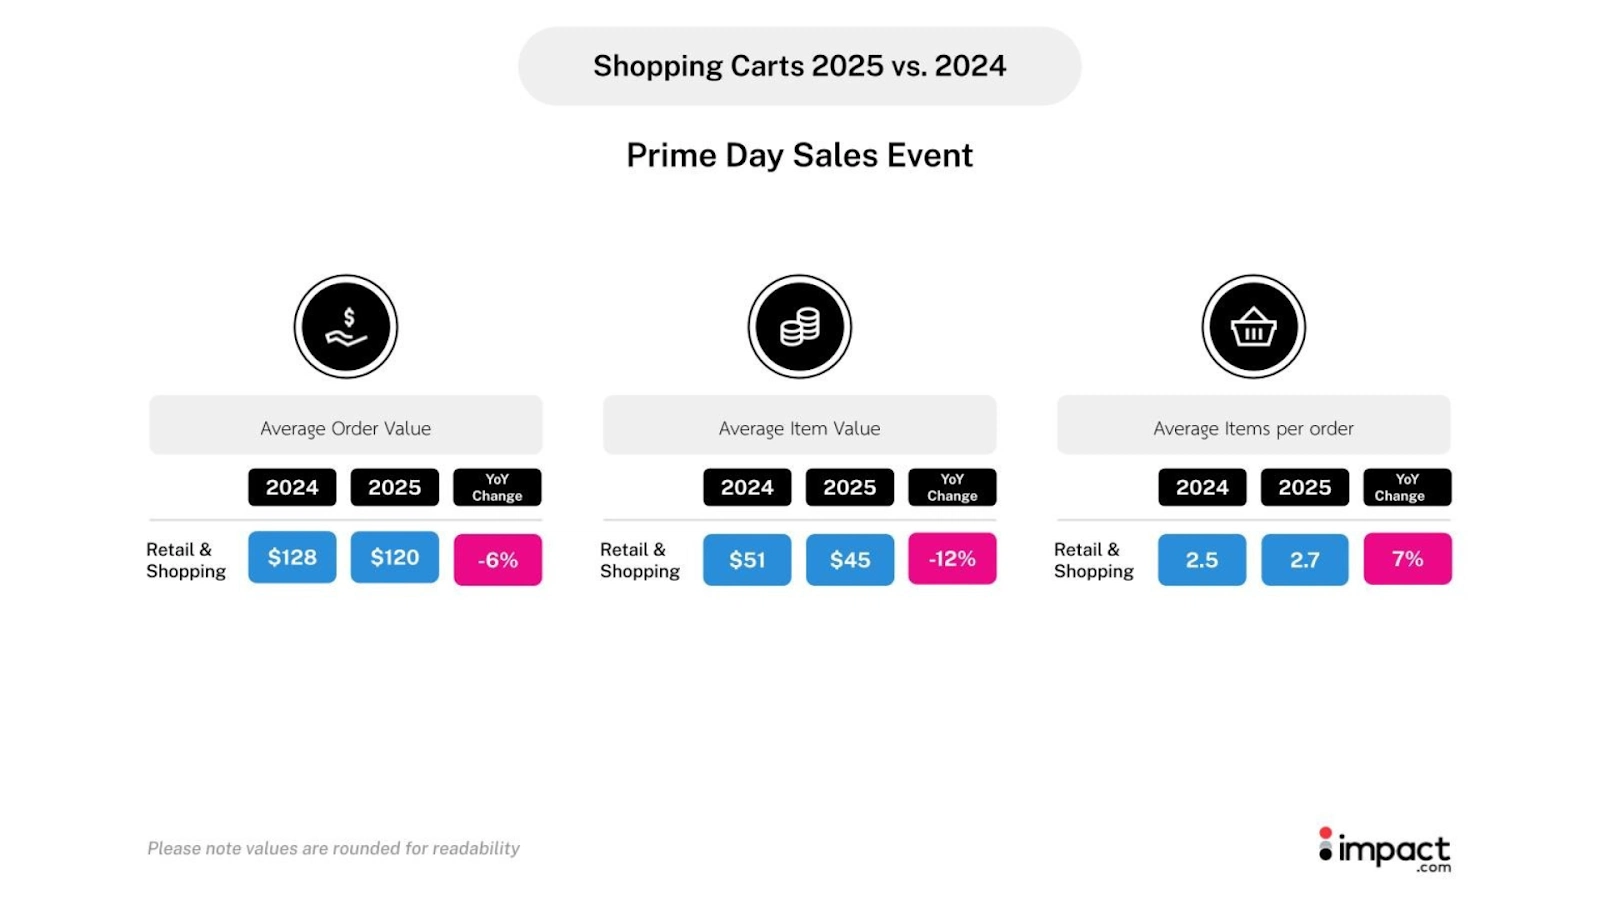
- Average order value: -6% YoY — from $128 to $120
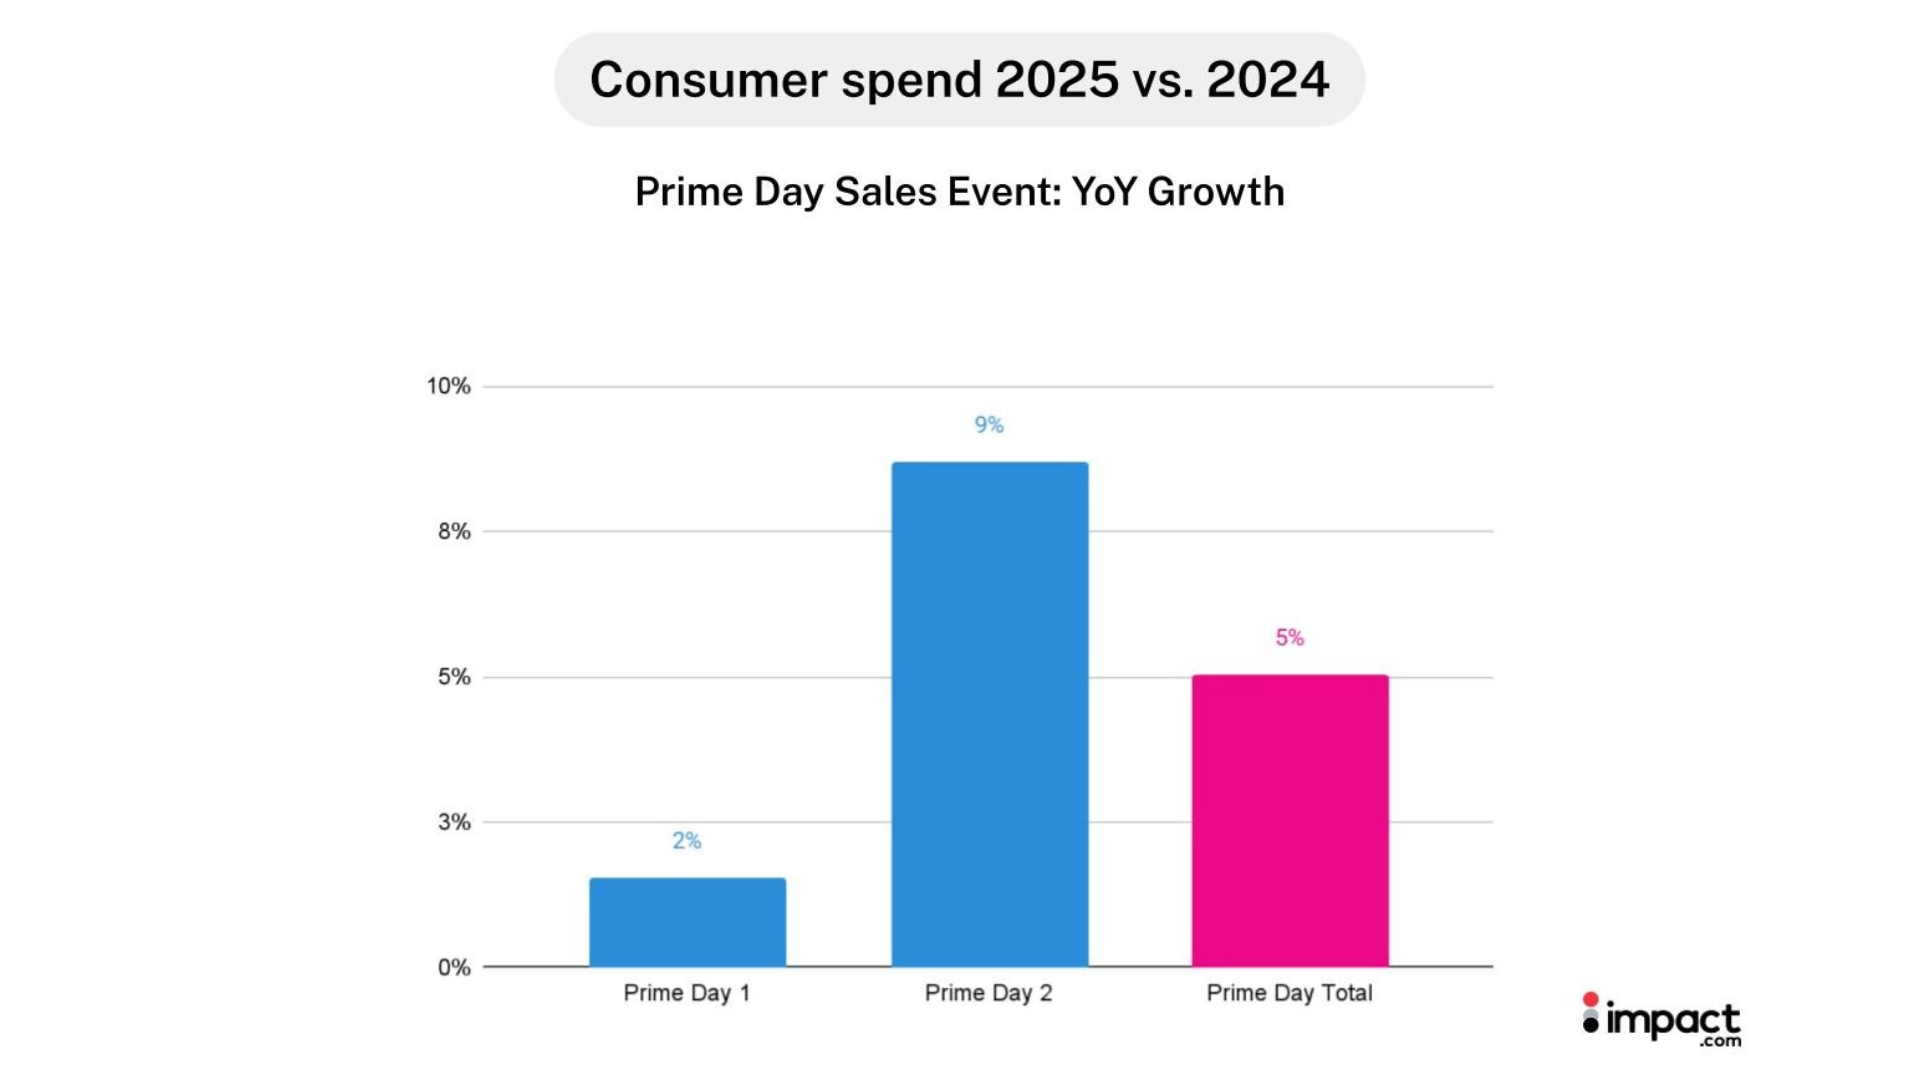
- Consumer spending: +5% YoY — revenue climbed despite lower AOV
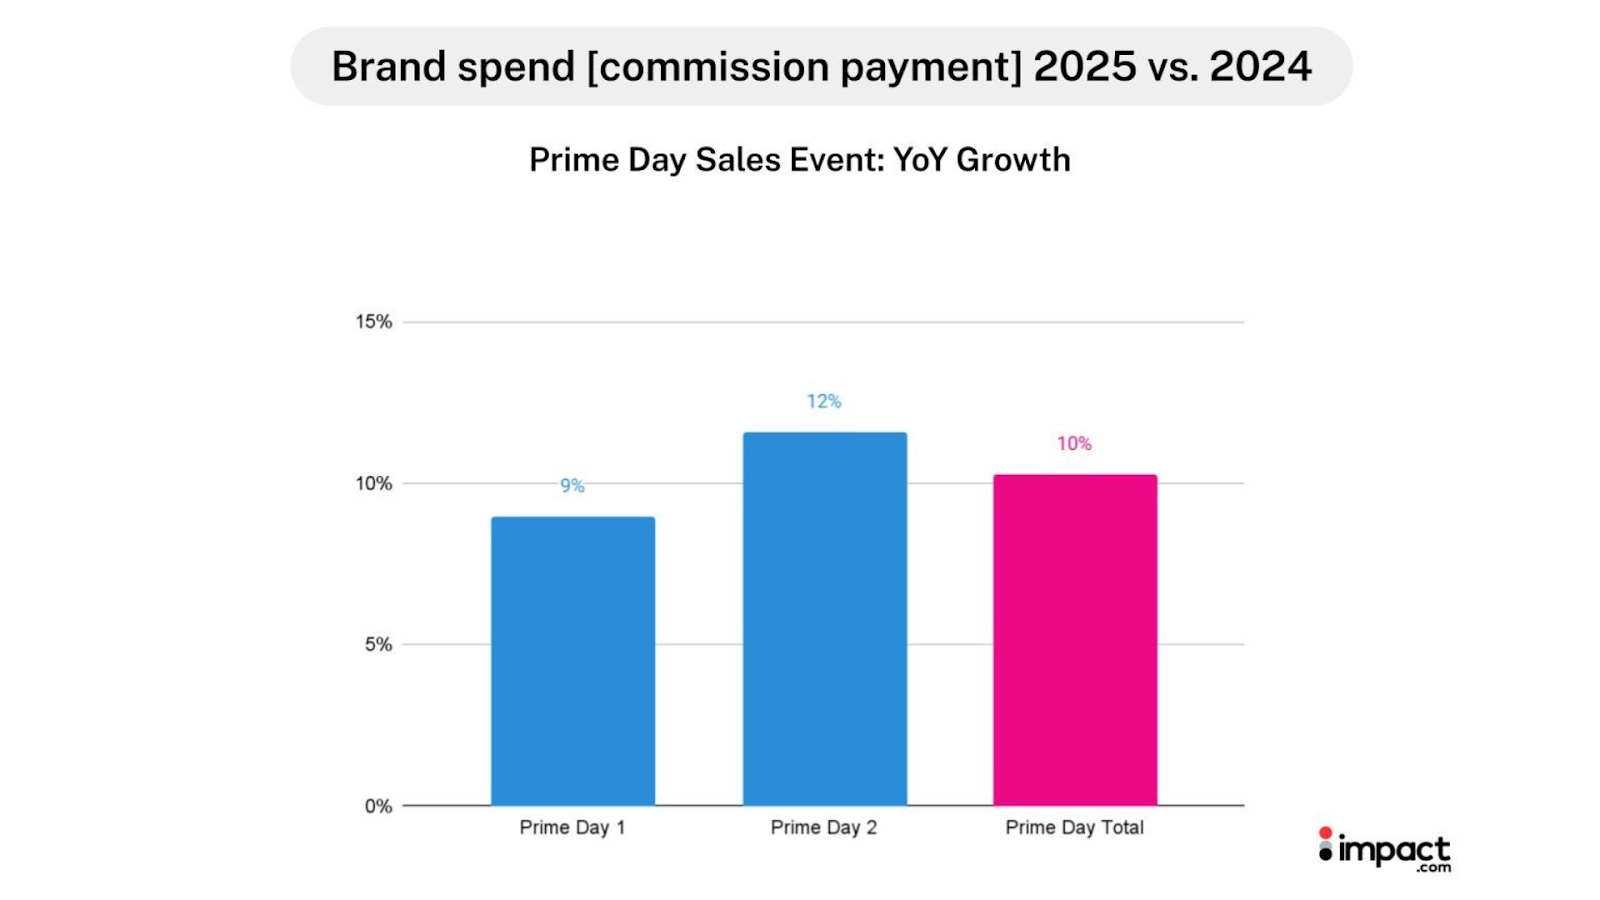
- Brand commission payouts: +10% YoY — double the revenue gain
That final metric, commission payouts, reveals the real story. Volume growth came at a cost. Brands paid premium rates to secure partner priority during the peak window. This cost-growth divergence defines the economics of a volume-first strategy: you’re not just selling more, you’re investing more per customer acquired.
This analysis examines how brands can engineer this trade-off—utilizing high-velocity channels, such as influencers, to capture customer volume at scale, while relying on loyalty programs and content review partners to anchor profitability.
Methodology: Data scope and metrics
The insights in this research blog are based on a large-scale analysis of performance during the two-day October Prime Day sale event.
- Scope and audience: The report tracked and analyzed performance for 1,098 same-store North American brands, specifically within the Retail and Shopping vertical.
- Timeframe: The analysis compares the event dates for 2025 (October 7-8) with those from the previous year, 2024 (October 8-9).
- Key metrics tracked: The analysis focused on core commerce metrics: clicks, orders, average order value (AOV), consumer spending (brand revenue), and brand spending (commission payouts).
The hidden math of growth: Trading price tags for bigger baskets
The 5% revenue growth didn’t come from premium pricing or high-ticket purchases. It came from a restructuring of the shopping basket itself—more items, more orders, lower individual prices. Understanding this basket-level shift reveals how brands can engineer volume-driven growth at a lower AOV.
Here’s the equation that powered October Prime Day: Revenue (+5%) = Orders (+12%) × AOV (-6%)
Note: AOV is calculated as (Average Items per basket [+7%] × Average Item value [-12%])
Each component tells part of the story. Together, they reveal the strategic trade-off brands made—and why it worked.
The main driver: More orders, lower spend
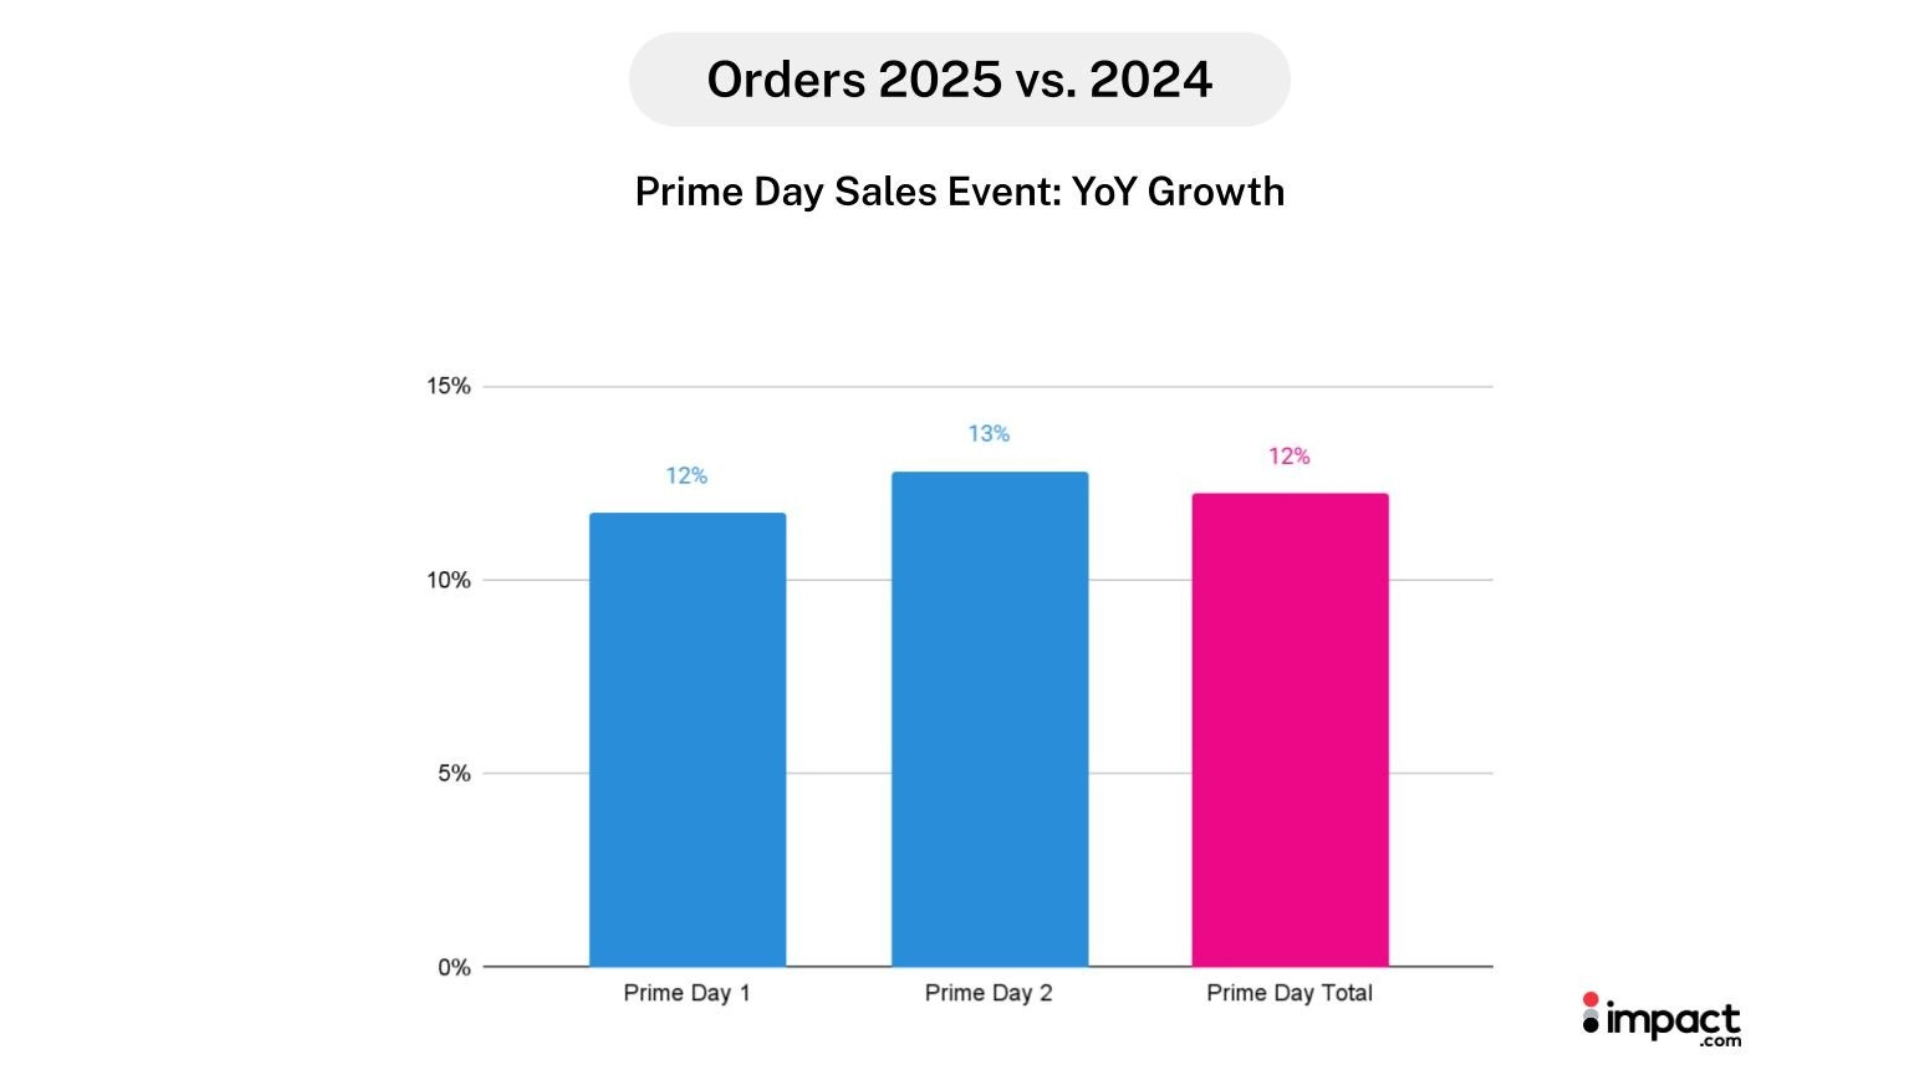
Order growth powered the event. Shoppers placed 12% more orders than last year and converted 11% more often, while AOV dropped 6%.
The result was a 5% lift in total consumer spending compared to the previous year. This proves that efficiency, not ticket size, can drive growth.
The numbers show a simple pattern: more carts, more items, lower prices. This strategy’s success, however, hinges on the increase in volume being substantial enough to compensate for the lower margins. The mix of lower per-item value and higher order volume produced steady revenue gains across categories.
How shopping behavior changed
| Metric | Change | What it means |
| Orders | +12% YoY | More transactions = primary growth engine |
| Conversion rate | +11% YoY | Increased traffic quality supported performance |
| Average order value (AOV) | -6% YoY ($128 → $120) | Shoppers spent less per transaction |
| Items per basket (AIB) | +7% YoY (2.5 → 2.7) | Shoppers added more products to each cart |
| Item value (AIV) | -12% YoY ($51 → $45) | Shoppers spent less per item |
| Consumer spending | +5% YoY | The growth in total orders successfully outweighed the drop in per-item value, driving an increase in overall consumer spending |
| Commission payouts | +10% YoY | Brands invested to secure volume |
Shoppers responded to promotions by building larger baskets filled with lower-priced items. They added 7% more products per order on average, but those products cost 12% less each.
The net effect was that more shopping carts (orders) carried more products (AIB), which was substantial enough to outweigh the lower prices (AIV), resulting in steady revenue growth without premium positioning.
Why this strategy succeeded
We can interpret that brands structured promotions to maximize transaction counts and basket sizes over ticket values. The approach worked because:
Conversion efficiency replaced traffic volume. Clicks grew only 1% YoY, yet orders surged 12%. Brands converted the traffic that arrived. An 11% increase in conversion rates demonstrates that the audience was qualified and ready to make a purchase.
Basket-building tactics outperformed premium positioning. Promotions incentivized multi-item purchases through tiered discounts, bundles, and threshold offers. Shoppers filled their carts with additional products, even at lower individual price points.
Order volume compounded the effect. The 12% increase in total transactions amplified the impact of slightly larger baskets, overcoming the -6% AOV decline to produce net revenue growth.
The takeaway: Growth came from engineering the basket—more items per order, more orders overall—not from chasing high-ticket purchases. Brands that succeeded understood this wasn’t about premium pricing. It was about growing cart sizes and scaling transactions.
Prime Day 2025: Analysis of two event formats
Amazon hosted two Prime Day events in 2025—a four-day event in July and a two-day event in October. These events occurred in different seasons (Summer vs. Fall) and under different market conditions, so a direct side-by-side comparison would not be fair. For instance, the October event was influenced by the start of the holiday shopping season, a factor not present in July’s summer travel and leisure-focused window. This analysis will highlight the main consumer behavior insights from each event’s unique format and duration.
Key learnings: July’s four-day experiment
Earlier in 2025, Amazon experimented with a four-day format. The elongated July format exposed the limits of extended sales windows: total volume increased, but urgency was diluted. Shoppers shifted from impulse buying to research-driven shopping, and the average purchase journey extended by over half a day (from 6.78 to 7.36 days). The “buy now” pressure evaporated.
Key learnings: October’s two-day success
October’s two-day sale succeeded by maintaining a high level of shopper urgency. Average daily conversion rates climb 11% YoY, and this pattern held for spending: average daily consumer spending rose 5% YoY in October. The compressed window preserved the fear of missing out (FOMO) that drives quick purchase decisions.
How format drove different behaviours
| Metric / factor | July 2025 (4 days) | October 2025 (2 days) | Key insight |
| Event duration | Extended (4 days) | Compressed (2 days) | Urgency is paramount. Shorter window amplified shoppers’ fear of missing out (FOMO). |
| Conversion rate | Declined 3% YoY (daily average) | Climbed 11% YoY (daily average) | The extended window eroded daily conversion efficiency. |
| Daily consumer spending | Decreased 5% YoY (daily average) | Rose 5% YoY (daily average) | Compressed format drove urgency and impulse buys. The extended format led to prolonged research |
| Consumer behavior | Research, comparison shopping, waiting for “better” deals | Impulse buying, quick decision-making, high intent/action | Length promotes rational, drawn-out purchasing; brevity drives action. |
| Seasonal timing | Vacation season (Lower focus, less urgency) | Pre-holiday planning (Higher intent, natural urgency) | Timing amplified the format factor, aligning a tight window with natural shopping momentum. |
| Brand implication | Maximizes total reach/volume; Extends the window for inventory clearout and customer engagement. | Most effective for promotional partner activation and converting “ready” customers. |
The seasonal context matters
Format wasn’t the only variable. Timing amplified the difference between July and October:
July’s challenge: The event coincided with the peak summer vacation season, when consumers were traveling, preoccupied, and less focused on major purchases. A low baseline intent, combined with an extended format, created a double dilution of urgency.
October’s advantage: The event aligned with the start of the holiday shopping season, when consumers actively plan purchases and seek deals. High baseline intent combined with a compressed format created maximum conversion pressure.
Seasonal psychology reinforced format effectiveness. October shoppers weren’t browsing—they were preparing for the holidays. The two-day window aligned with their mindset: make decisions quickly, secure deals now, and move on to the next shopping task.
The urgency equation
The data reveals that urgency drives conversion, and format controls the perception of urgency.
When you extend sales windows, shoppers shift from impulse to research, “buy now” pressure dissolves, and daily efficiency declines even as total volume increases. When you compress sales windows, urgency remains high, “last chance” psychology drives sustained engagement, and daily efficiency maximizes revenue per day.
The lesson for brands: For most brands, the compressed format is essential for maintaining the conversion pressure that makes promotional events profitable. Extended sales periods may seem appealing in terms of total volume, but they risk significant momentum decay and efficiency loss.
Unless your brand has strategic reasons to extend (like Amazon’s logistics benefits), the two-day model offers the best balance of scale and urgency for partnership marketing success.
The mandatory investment split: Volume partners vs. value partners
The most important finding from October Prime Day: no single partner type delivers both volume and margin. This is because some partners excel at driving high-volume acquisition of lower-value purchases, while others are essential for converting high-value sales that protect margins, even if they deliver lower overall transaction volume.
Brands that succeeded recognized this and split their partnership investments across three distinct roles—high-velocity acquisition, revenue anchoring, and conversion optimization. The volume-for-value strategy only works when you fund the full ecosystem.
October’s data reveals how the best performers allocated budgets:
- Volume engines: Influencers drove customer acquisition at scale, selling at lower AOV in exchange for transaction volume
- Value anchors: Commerce solutions and content review partners secured the highest AOV sales, protecting margins
- Conversion rate optimizers: Loyalty and rewards, influencers, and deal/coupon partners maximized efficiency across the funnel
Understanding which partners play which roles—and funding them accordingly—separates winners from those who apply a single, volume-based model to all partners..
The scale engine: Influencer volume paradox
Influencers have evolved from awareness drivers to full-funnel sales engines.
Creators such as Sarah Chetrit deliver insightful videos that help shoppers decide. An exclusive promo code provides the final incentive to buy..
You can’t ignore the growth numbers:
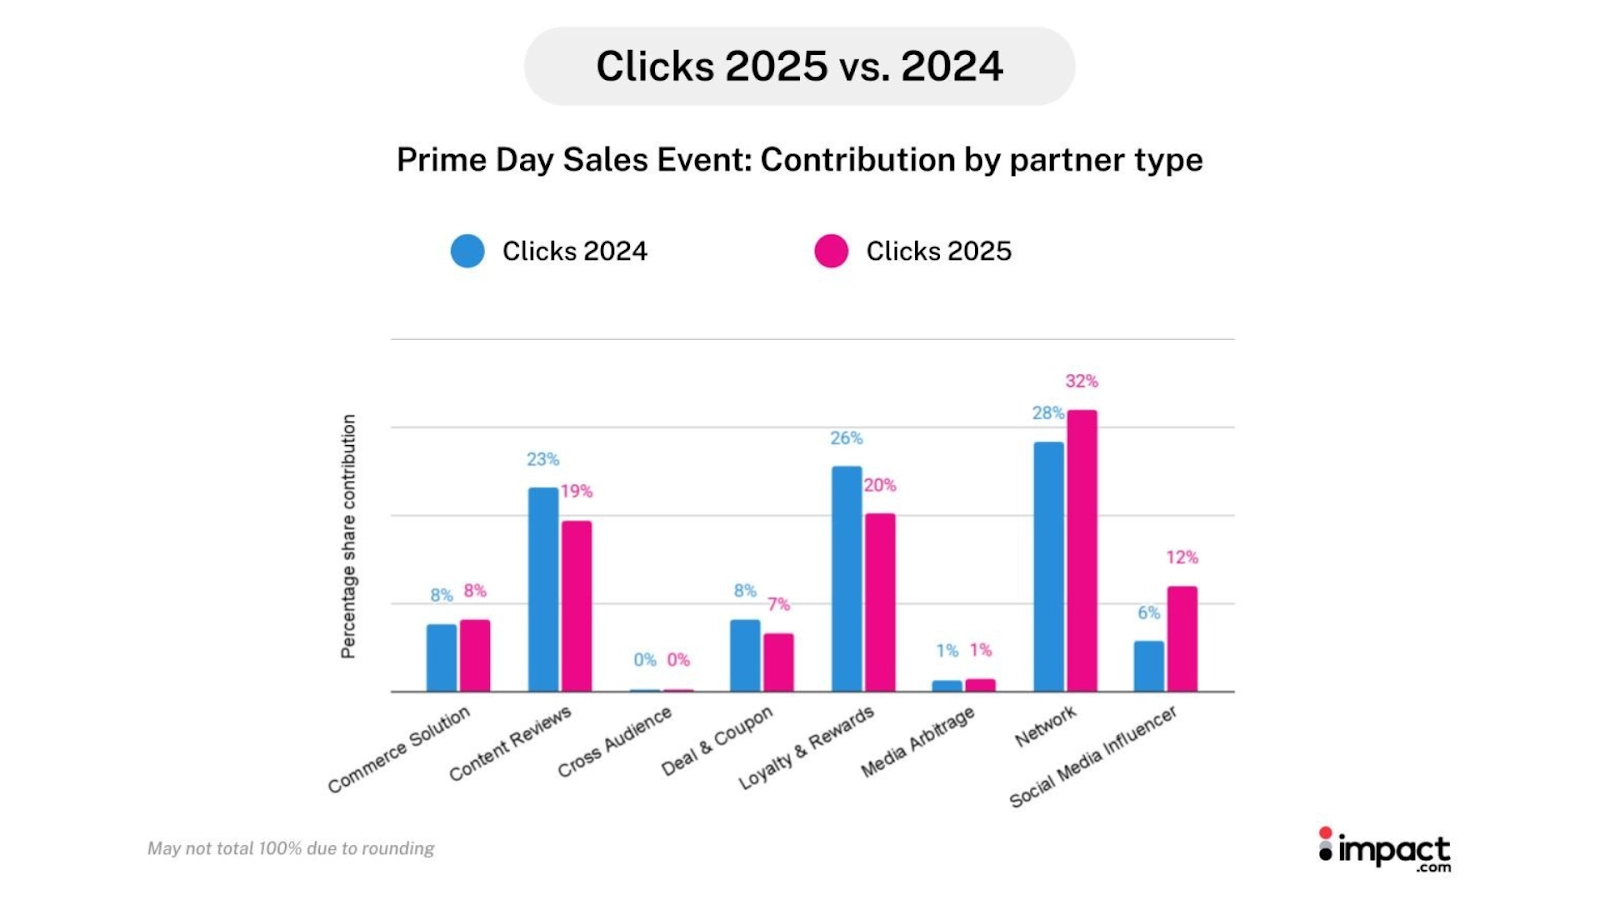
- Clicks: +114% YoY — doubling their contribution share of total clicks from 6% to 12%
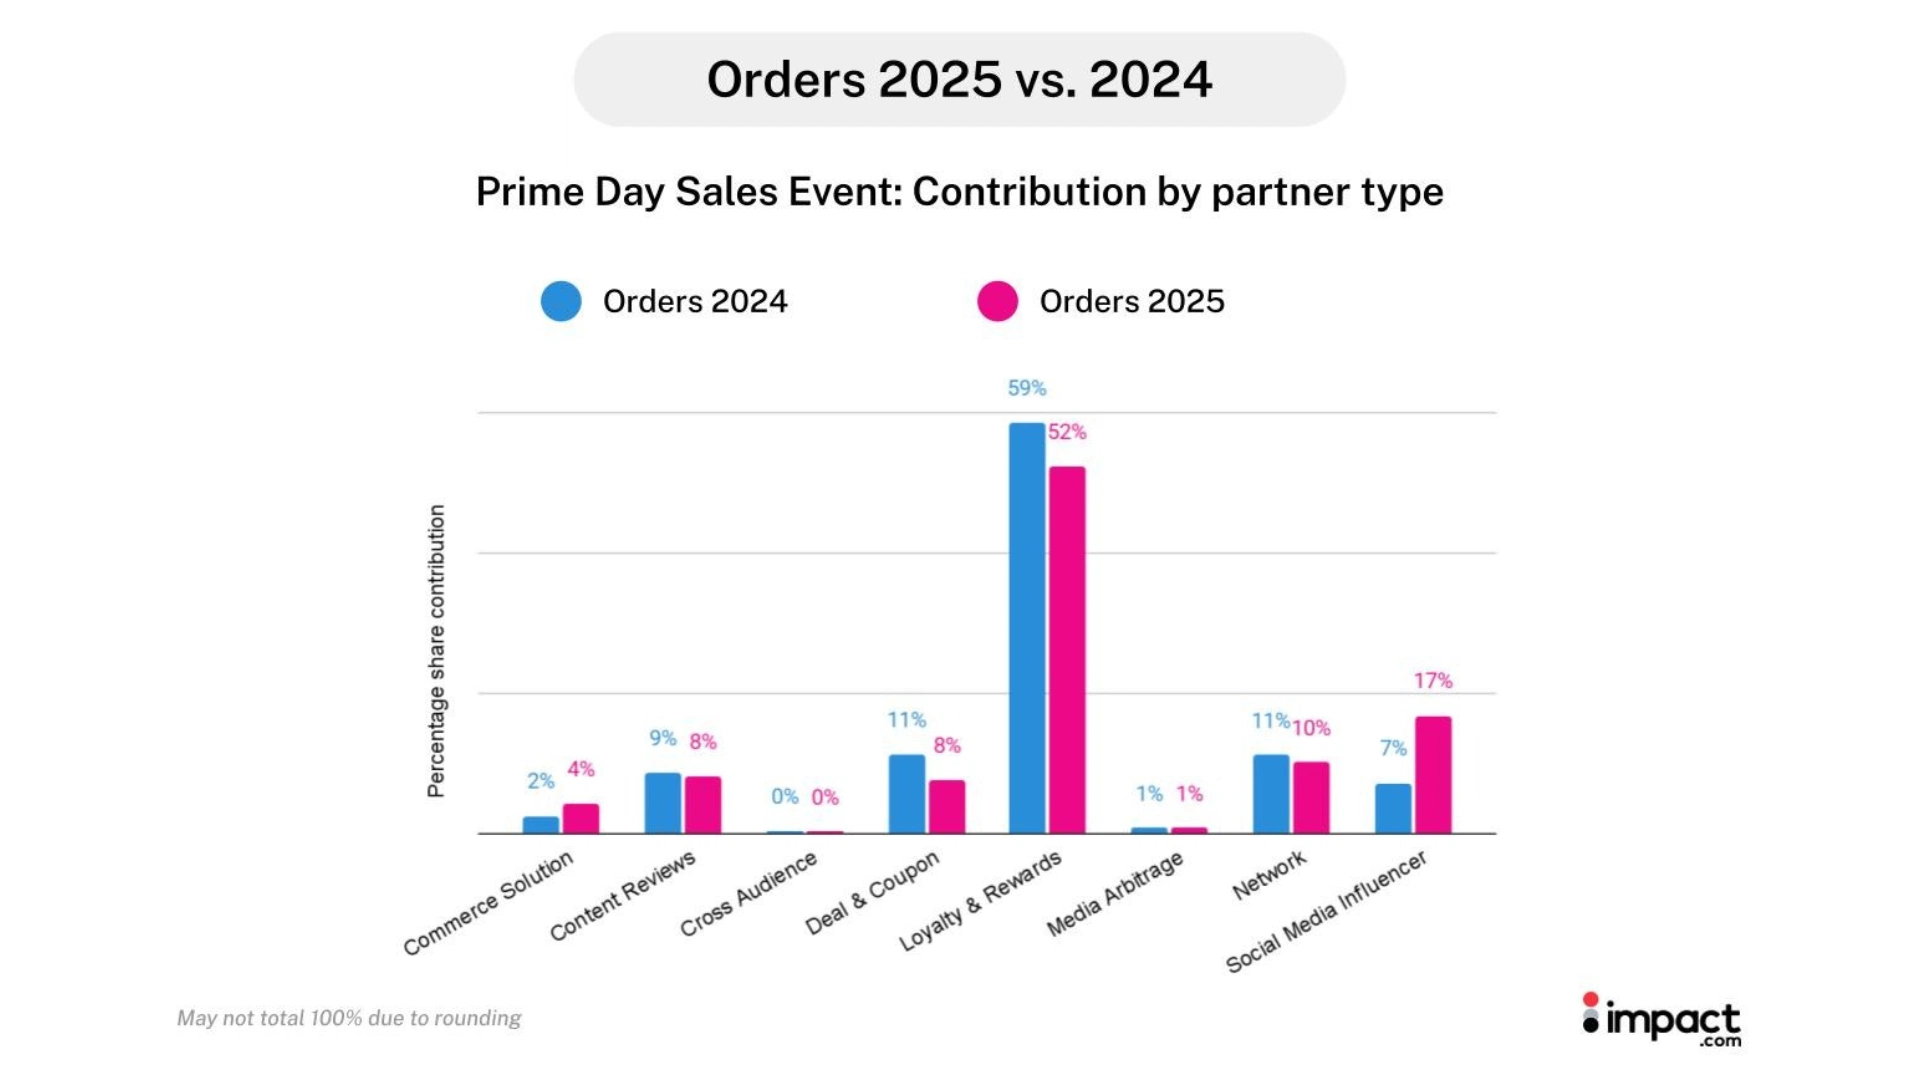
- Orders: +163% YoY — raising their contribution from 7% to 17% of all orders
- Conversion rate: +23% YoY — achieving the second-highest conversion rate among all partner types
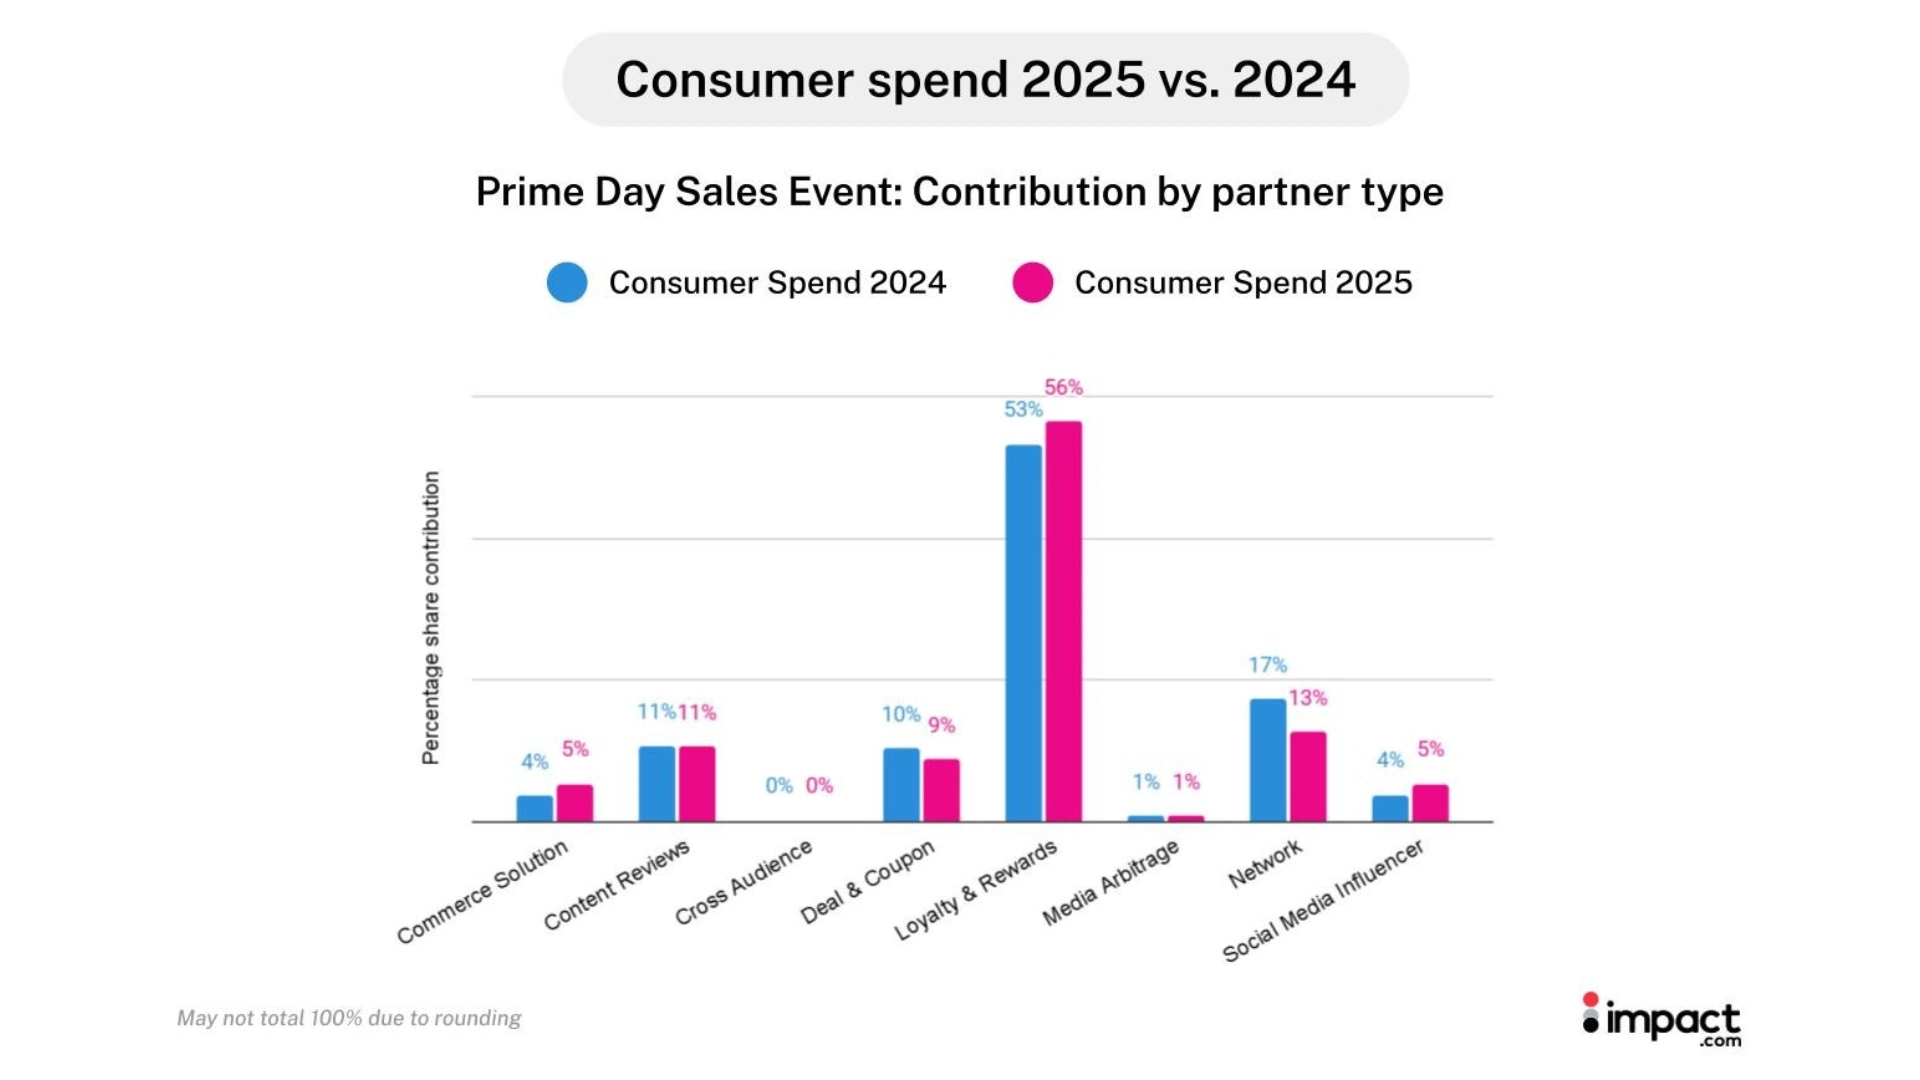
- Consumer spending: +47% YoY — increasing their contribution to brand revenue to 5%
Yet their AOV fell 44% YoY—the steepest decline among all channels. This is the paradox that defines influencer performance: exceptional conversion efficiency paired with the lowest order values. They move a massive volume of lower-priced items, converting audiences faster than any channel except loyalty programs.
Are influencer orders actually profitable?
The -44% YoY AOV decline raises an obvious question: if influencers drive such low-value orders, are they worth the investment? The data points to yes—but profitability works differently here:
The margin view: Influencer orders carried lower immediate margins during the event, primarily due to a lower average order value. This might appear to be a simple cost problem if evaluated solely on event-day revenue.
The growth view: However, this channel’s value is clearly in its growth. Influencer-driven consumer spending grew 47% YoY, and orders grew an incredible 163% YoY. This suggests that the channel is a powerful engine for acquiring new customers during the sales process. The strategic trade-off is clear: sacrificing immediate margin to win a massive volume of new customers during the event itself.
Strategic intentionality: The low AOV isn’t a sign of weakness, its a sign of a highly effective strategy. Many brands deliberately use influencers to promote lower-ticket items because they are highly efficient at converting audiences.
Despite a minor YoY dip, influencer baskets contain an average of 4.0 items, which is the most items per basket of any partner type
This proves influencers aren’t just driving single-item sales. Their value is in building high-volume “hauls” of low-cost items. They excel at curating “discovery baskets” or “stock-up” carts, giving audiences the confidence to buy multiple low-ticket items at once.
Treat influencers as a customer acquisition investment, not a margin play. The low AOV isn’t just the price of scale—it’s the result of a successful “haul-building” strategy that moves massive inventory

Action for marketers:
Structure influencer commissions to reward transaction count over AOV percentage. The goal is maximizing new customer flow, not individual cart value. Evaluate performance on volume metrics (orders, conversions), not event-day AOV.
The profit anchor: Value protection duo
While influencers drive acquisition at scale, loyalty programs and content review partners work together to protect margins and anchor profitability. These two channels function as a strategic duo.
Our data shows loyalty and rewards partners had the highest conversion rates during the sales event, and content review partners delivered the highest order value purchases. Together, they offset the low-AOV volume generated elsewhere.
Loyalty dominance
Loyalty and rewards partners remain the foundation of revenue stability:
- 52% of all orders — maintaining their position as the dominant sales channel
- 56% of total consumer spending — generating more revenue than any other partner type
- Highest conversion rates — Improved +26% YoY, this year. The strongest conversion rate across all channels during the 2024 and 2025 sales events.
- Higher item value contribution (13% YoY growth) — securing value by selling higher-priced products
Loyalty partners drive profitable volume. Their combination of high conversion rates and selling higher-ticket items makes them the revenue anchor that offsets low-AOV acquisition channels, such as influencers.
Kudos is a prime example of an effective loyalty and rewards partner for brands.
Content review as value protector
Content review partners—editorial sites and product reviewers—play a distinct but equally critical role:
- Highest AOV orders — delivering the highest value transactions, just slightly ahead of commerce solutions.
- Second-largest commission share — ranking just behind loyalty for total brand commission payouts.
- High-consideration purchase validation — providing the editorial trust that closes expensive purchases
When consumers research expensive products, they seek validation and reassurance. Content review partners are ideally positioned to provide in-depth analysis, expert opinions, and comparative data that high-value shoppers need before making a commitment. They don’t just drive orders—they make high-AOV orders possible.
Content partners, such as Fresh Off The Grid, offer shoppers expert tips and guides to make informed purchasing decisions with confidence and ease.
This makes content review partners a complement to loyalty programs. Loyalty converts existing customers efficiently. Content review partners validate high-value decisions made by new customers. Together, they anchor profitability while influencers scale acquisition.

Action for marketers:
Loyalty programs provide predictable, high-converting revenue, while content review partners secure high-AOV transactions. This duo offers a powerful model for protecting margins when balancing high-volume acquisition.
The conversion support crew: Maximizing traffic and high-value sales
A diversified group of partners plays critical supporting roles—generating scalable traffic, optimizing on-site experience, and closing high-intent buyers. These channels fill essential gaps in the customer journey.
Network partners (traffic scaler)
Network partners generate raw, scalable reach at the top of the funnel:
- Clicks: +14% YoY — increasing contribution share of total clicks from 28% to 32%
- Broadest reach — delivering the highest absolute click volume among all partner types
Network partners like My Guide are essential for boosting a brand’s overall reach and visibility.
Strategic role: Network partners feed the funnel. They drive the initial traffic that higher-converting partners (such as loyalty programs, influencers, and deal and coupon partners) turn into transactions. Without this foundational reach, even the best conversion channels run out of qualified visitors.
Action: For brands prioritizing scale, maintaining consistent funding is a crucial consideration for preserving top-of-funnel volume. Network partners aren’t your highest converters, but they are foundational to that strategy.
Commerce solutions (site optimizer)
Commerce solutions partners focus on improving the on-site shopping experience:
- Orders: +92% YoY — doubling their share of total orders from 2% to 4%
- Consumer spending: +55% YoY — indicating strong value contribution despite a small baseline
- Conversion utility — driving final purchase through cart optimization, product recommendations, and checkout tools
Strategic role: These partners convert traffic that’s already on-site but needs a final nudge. They reduce cart abandonment, suggest complementary products, and smooth the checkout process.
Action: These partners punch above their weight in conversion efficiency, suggesting that even a modest budget allocation can deliver a high impact.
Deal and coupon partners (final intent driver)
Deal and coupon partners capture high-intent traffic actively seeking savings:
- Third-highest conversion rates — behind only loyalty and influencers
- High-intent audience — shoppers arrive ready to buy, just looking for the best price
Strategic role: These partners close the deal for price-sensitive shoppers who are already committed to purchasing but are comparing final offers. They prevent cart abandonment and competitor switching at the moment of decision.
Action: Deal-seeking behavior spikes during major sales events, suggesting this is a key opportunity to leverage these partners.
Category-specific strategies: Where the volume-value trade-off succeeded and failed
A single AOV strategy is strategically unsound. The volume-for-value approach that worked overall masked dramatic divergences at the category level. Some verticals grew AOV through basket building. Others maintained premium pricing on singular purchases.
Still other categories saw basket collapse despite strong order growth—converting motivated shoppers while simultaneously destroying revenue.
These category-specific patterns reveal a critical truth: promotional tactics that drive volume in one vertical can erode profitability in another. Success requires understanding which categories need basket-building incentives, which need premium positioning, and which need minimum purchase thresholds to prevent revenue loss.
Category performance snapshot (YoY change)
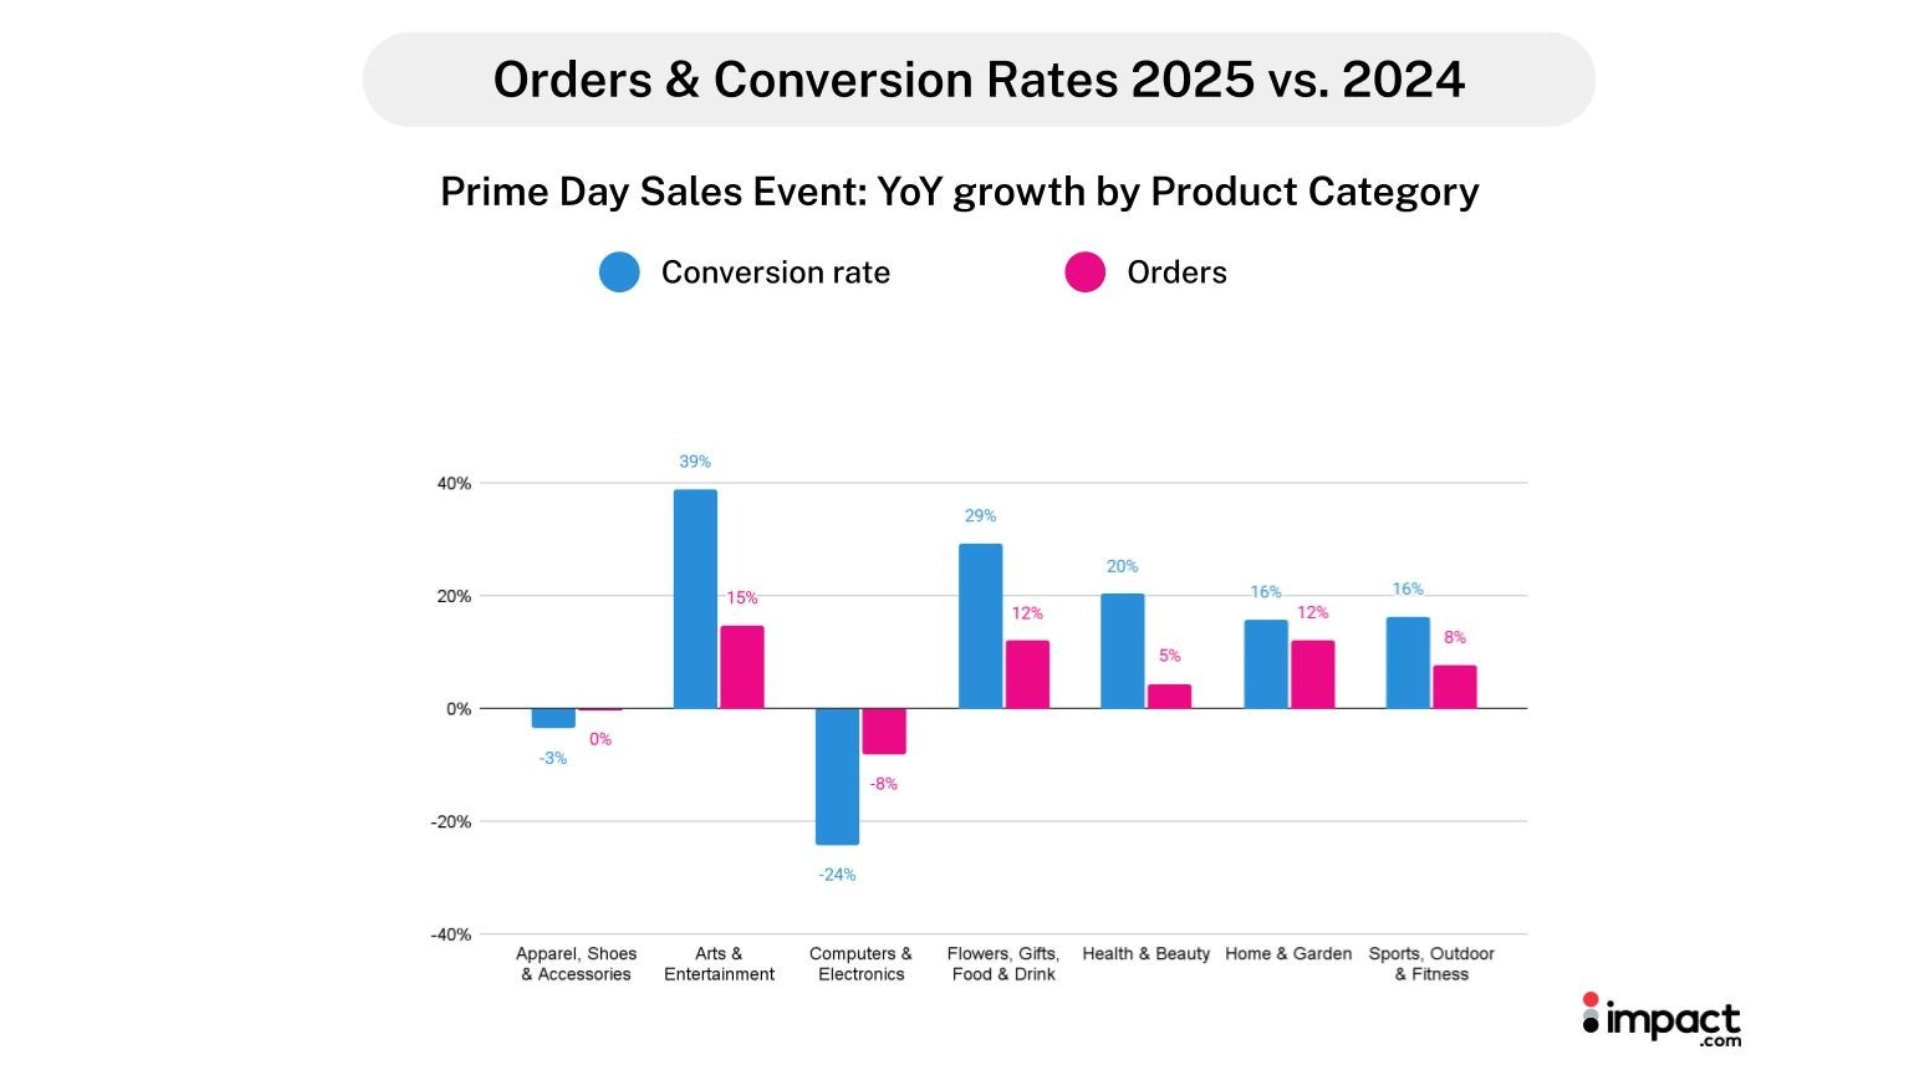
The table below shows how dramatically different categories responded to the same promotional environment:
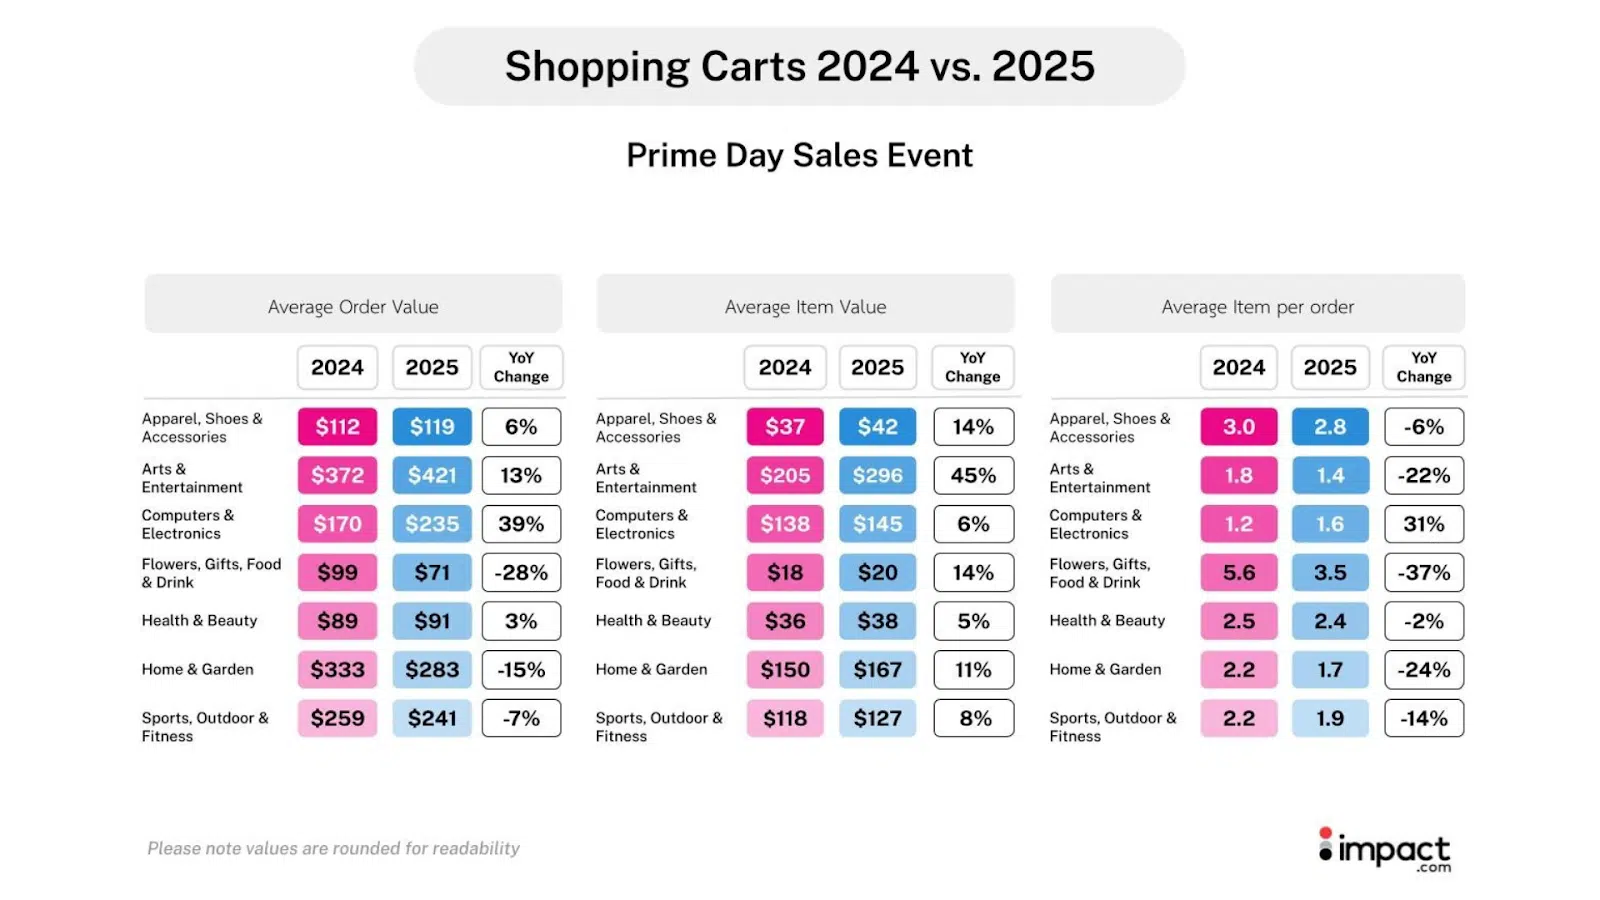
| Category | Orders | Consumer spend | Conversion rate | AOV | AIB | AIV |
| Apparel, Shoes & Accessories | -0% | +6% | -3% | +6% | -6% | +14% |
| Arts & Entertainment | +15% | +30% | +39% | +13% | -22% | +45% |
| Computers & Electronics | -8% | +27% | -24% | +39% | +31% | +6% |
| Flowers, Gifts, Food & Drink | +12% | -20% | +29% | -28% | -37% | +14% |
| Health & Beauty | +5% | =7% | +20% | +3% | -2% | +5% |
| Home & Garden | +12% | -5% | +16% | -15% | -24% | +11% |
| Sports, Outdoor & Fitness | +8% | +0% | +16% | -7% | -14% | +8% |
Note: values represent YoY growth
Not all categories responded equally to Prime Day promotions. Some, such as Apparel, Shoes, and Accessories, successfully increased AOV by using higher-priced items to offset a drop in basket size. Others saw their basket size collapse, as higher-priced items were not enough to offset the shrinking of the order size. While overall revenue growth was driven by higher order volume, the data reveals sharp contrasts across categories.
Segments, such as Computers & Electronics, used basket expansion to grow AOV, while others, like Arts & Entertainment, relied on premium pricing to grow AOV despite a basket collapse. This contrasts with Flowers, Gifts, Food & Drink, which saw its basket collapse, as premium pricing was insufficient to offset the decline in order size, resulting in a revenue decrease.
These disparities indicate that volume-based promotions don’t yield uniform results; each vertical requires its own optimal balance of basket size, item value, and promotional depth.
High-value successes (AOV growth)
Premium categories maintained or grew AOV through different paths—Arts & Entertainment via singular high-cost purchases, Computers & Electronics through successful basket building.
Arts & Entertainment
This category secured high-value transactions with AOV growing 13% from extremely motivated traffic that converted at 39% higher rates YoY. Consumer spending surged 30% YoY. Success here was rooted in high-intent buyers making singular, high-cost purchases—AIB fell 22%. These shoppers knew what they wanted and were willing to pay premium prices for it.
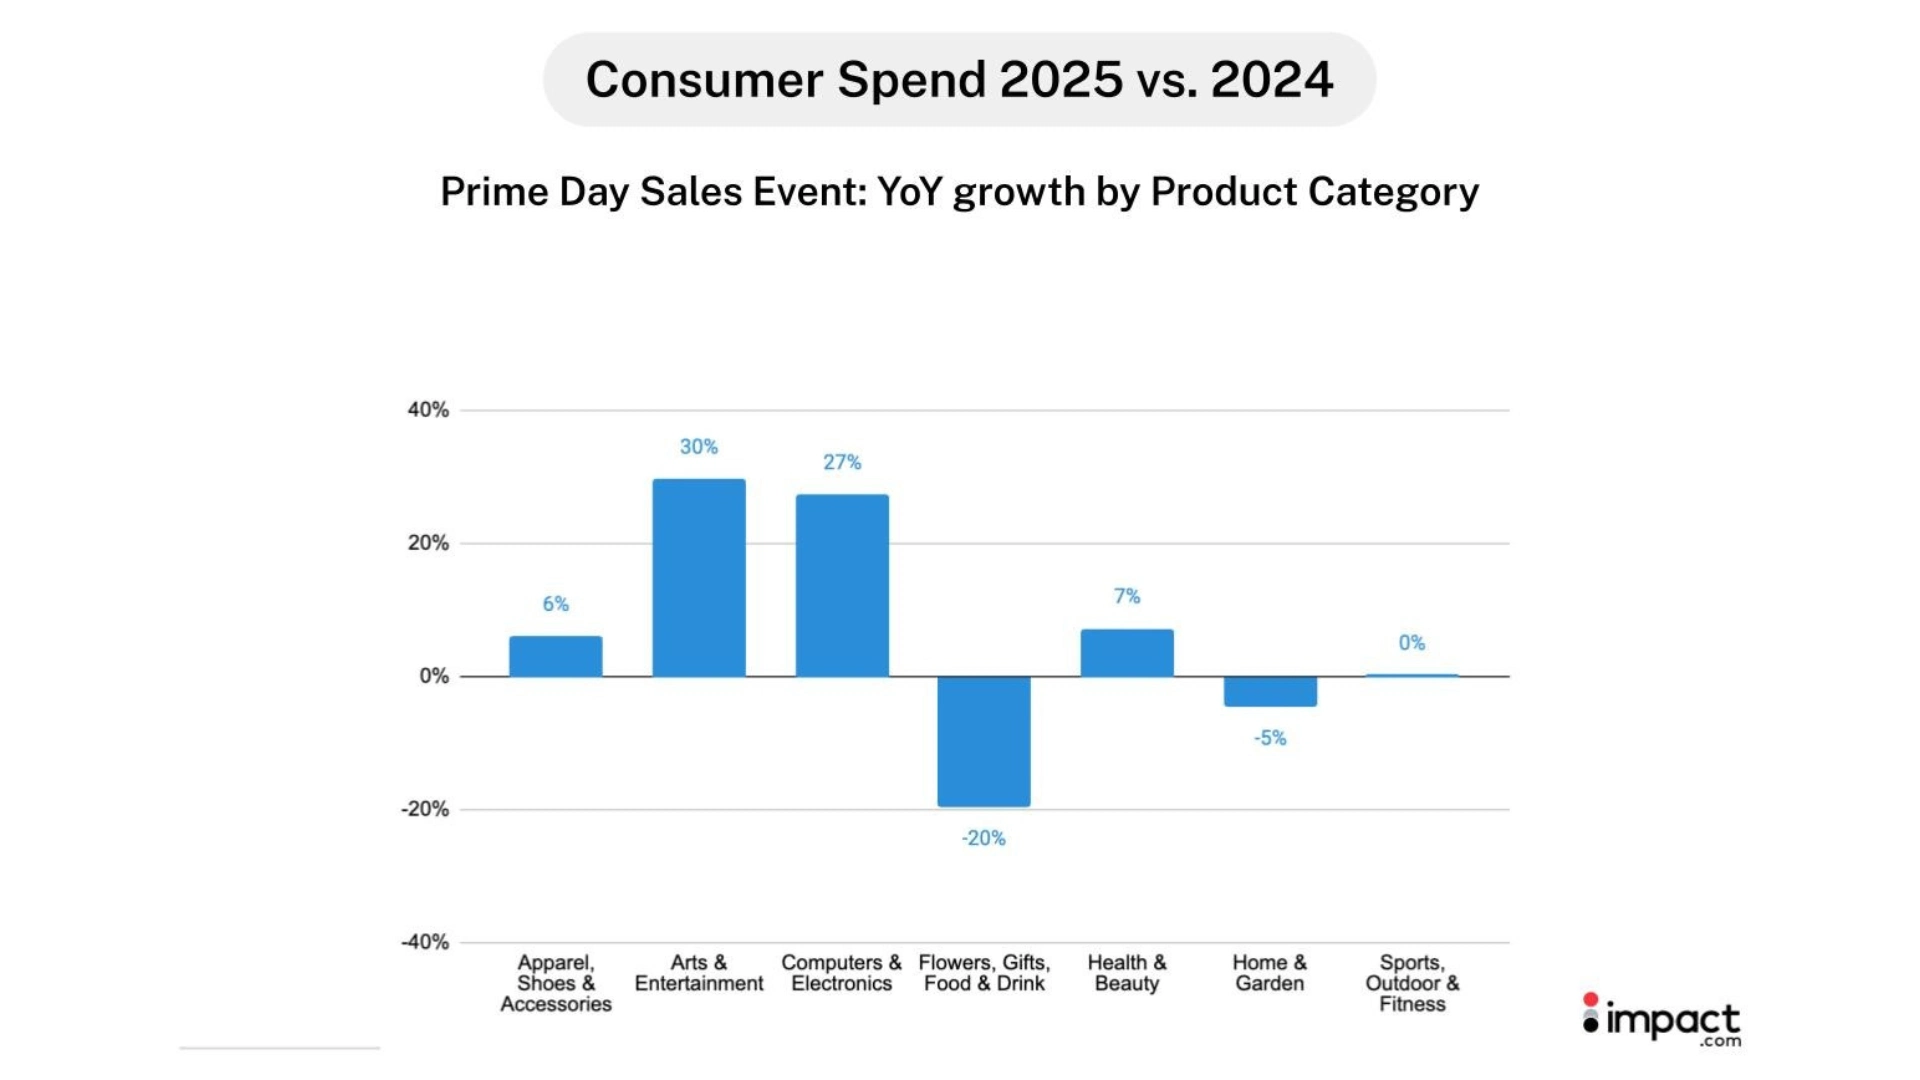
Computers & Electronics
While orders dropped 8% YoY and conversion rates plummeted 24% YoY, the strategy pivoted to a success model: high-AOV basket building. AOV surged 39%, driven by a massive 31% YoY increase in average items per order (AIB) and 6% increase in average item value (AIV), confirming successful upselling to the smaller pool of highly committed buyers. Brands effectively bundled accessories and add-ons to maximize value from each transaction.
Basket collapse (AOV decline)
The Flowers, Gifts, Food and Drink, and Home and Garden categories attracted more orders with strong conversion rates YoY, but failed to maintain a high basket size compared to last year. This failure to build larger baskets meant that, despite increased orders, overall revenue still declined.
Flowers, Gifts, Food & Drink
Orders were up 12% YoY, and conversion rate was strong at 29% YoY growth. However, AOV plummeted 28% because average items per order (AIB) decreased by 37%, and the increase in Average item value (14%) could not outweigh this decrease.
This drove a 20% decrease in consumer spending, demonstrating a promotional failure to maintain basket size despite converting highly motivated shoppers. Promotions attracted buyers but failed to encourage multi-item purchases.
Home & Garden
This category saw strong order volume growth of 12% YoY and solid conversion rate growth of 16% YoY, yet AOV dropped 15% due to a 24% decline in AIB, despite an increase in item value (11%).
This resulted in a 5% decrease in consumer spending YoY, signaling that promotions failed to incentivize the multi-item purchases necessary for this vertical. Discounts drove traffic, but didn’t build large enough baskets.
Action: Marketers must define category-specific strategies. High-cost categories, such as electronics, should prioritize basket building (AIB) through bundles and cross-sells to justify investment in acquisitions. Volume-focused categories, such as Flowers, Food, Gifts, and Drinks should maintain a minimum AIB through tiered discounts or basket incentives to prevent revenue loss despite strong order growth.
The Day 2 surprise: Why the best results hit at the finish line
Conventional wisdom says front-load budgets on Day 1 when traffic peaks. October Prime Day data reveals a more complex reality: while Day 1 drove the most individual orders, Day 2 delivered the highest total consumer spending.
Day 2 delivered 4.5x stronger year-over-year revenue growth than Day 1. Day 2’s revenue success was driven by higher-value carts proving that the final hours of compressed sales are a peak, not an afterthought—and most brands may be misallocating their budgets.
The efficiency gap
The data reveals a clear split in performance: Day 1 captured the highest volume, while Day 2 drove the strongest value.
| Metric | Day 1 (YoY) | Day 2 (YoY) | Advantage |
| Consumer spending | +2% | +9% | 51% of consumer spending was generated on Day 2 of the sale |
| Orders | +12% | +13% | Day 1 had 8% more total orders compared to Day 2, but Day 2 showed stronger YoY growth at +13%. |
| Conversion rate growth | 10% | 12% | Day 1 held the highest absolute rates, but Day 2 had the largest YoY growth at +12%. |
| Clicks | +1% | +1% | Sustained top-of-funnel interest across both days |
While Day 1 secured the highest volume of orders, Day 2 demonstrated stronger momentum, with its revenue and conversion rate growth dramatically outpacing those of Day 1.
The psychology of deadline urgency
This performance gap reveals how shopper urgency builds during a compressed sale
The “order” foundation: Day 1 locked in the highest traffic, the most orders, and the highest overall conversion rates. Shoppers were clearly ready to commit from the moment the sale started, securing the foundational volume for the event
The ‘FOMO’ momentum: The real story is the strength of Day 2. The looming deadline triggers loss aversion (FOMO), which drives not only transactions but also higher-value transactions. This resulted in Day 2 delivering the highest total consumer spending and becoming the biggest day for revenue..
The conversion data proves this. Day 2’s conversion rate grew 12% YoY compared to Day 1’s 10% YoY growth. This confirms that shoppers remained highly engaged, and the ‘final hour’ urgency is accelerating at a faster pace than on Day 1. While Day 1 remains the main event, the momentum and revenue growth (4.5 times Day 1’s) prove that Day 2 is a critical, highest-value period for brands.

3 actionable strategies from the October sale
Apply these three strategies to balance volume acquisition with high-value sales based on October Prime Day 2025 performance data.
The volume-first mandate: Engineer the basket
Performance stemmed from transaction volume, rather than high-ticket purchases. Total revenue grew 5% YoY, driven by a 12% increase in orders despite a 6% drop in AOV. Growth resulted from selling more units at lower price points rather than chasing premium purchases.
Actionable takeaways for your brand:
Stop chasing high AOV: Accept that the event is a high-volume, low-margin play and design all promotions to explicitly drive AIB (item count) and Orders (transaction volume).
Use tiered thresholds to mandate AIB: Implement tiered discounts based on quantity, not just price. For example, instead of “10% off your order,” consider offering “Buy 3 items for 15% off” to ensure a minimum basket size is met, thereby directly preventing the revenue loss seen in the Gifts and Home categories.
Prioritize bundles over discounts: For complex, high-cost products (such as Electronics), mandate bundling of necessary add-ons and accessories to guarantee the AIB increase that drives AOV growth.
Optimize event pacing: Capture the Day 2 peak
The compressed two-day format preserved conversion rate momentum, while the highest growth occurred late in the event. Day 2 delivered 9% YoY growth in consumer spending compared to 2% YoY on Day 1, proving that buyer intent peaks near the close.
By contrast, the extended four-day July event diluted urgency— daily average conversion rates fell 3% YoY as research behavior replaced impulse buying.
Actionable takeaways for your brands:
Reverse the budget split: Allocate a significant portion of your marketing budget, inventory, and commission spend (e.g., 55–60%) for the final 12–24 hours of the event.
Schedule a creative refresh: Avoid running the same creative for both days. Prepare Day 2 creative that explicitly signals urgency and finality (“Offer ends at midnight,” “Last Chance”) to capture the momentum of high-intent buyers.
Maintain real-time tracking: Use dynamic performance tracking to monitor for late-stage surges and be prepared to quickly adjust spending to meet the spike in Day 2 demand.
3. Integrate a full-funnel partner ecosystem for balance
Success requires funding partners across the entire customer journey. No single channel delivers both scale and profitability—you need a diversified mix that balances high-velocity acquisition with revenue-anchoring partners.
Acquisition/Discovery:
Influencers drove 163% order growth—fund them for Day 2 “last-hour flash deals” to capture final intent surges. Accept low AOV (44% lower YoY) as customer acquisition cost.
Network partners scale top-of-funnel traffic—use them for real-time price testing to optimize discount tiers before feeding higher-converting channels.
From the satisfying unboxing moment to exclusive promos, creators like @yourstrulyyinka deliver captivating, full-funnel impact.
Research/Validation:
Content review partners generated the highest AOV orders by providing editorial trust. Leverage their credibility to reassure high-value buyers during the research phase and counterbalance low-AOV acquisition channels.
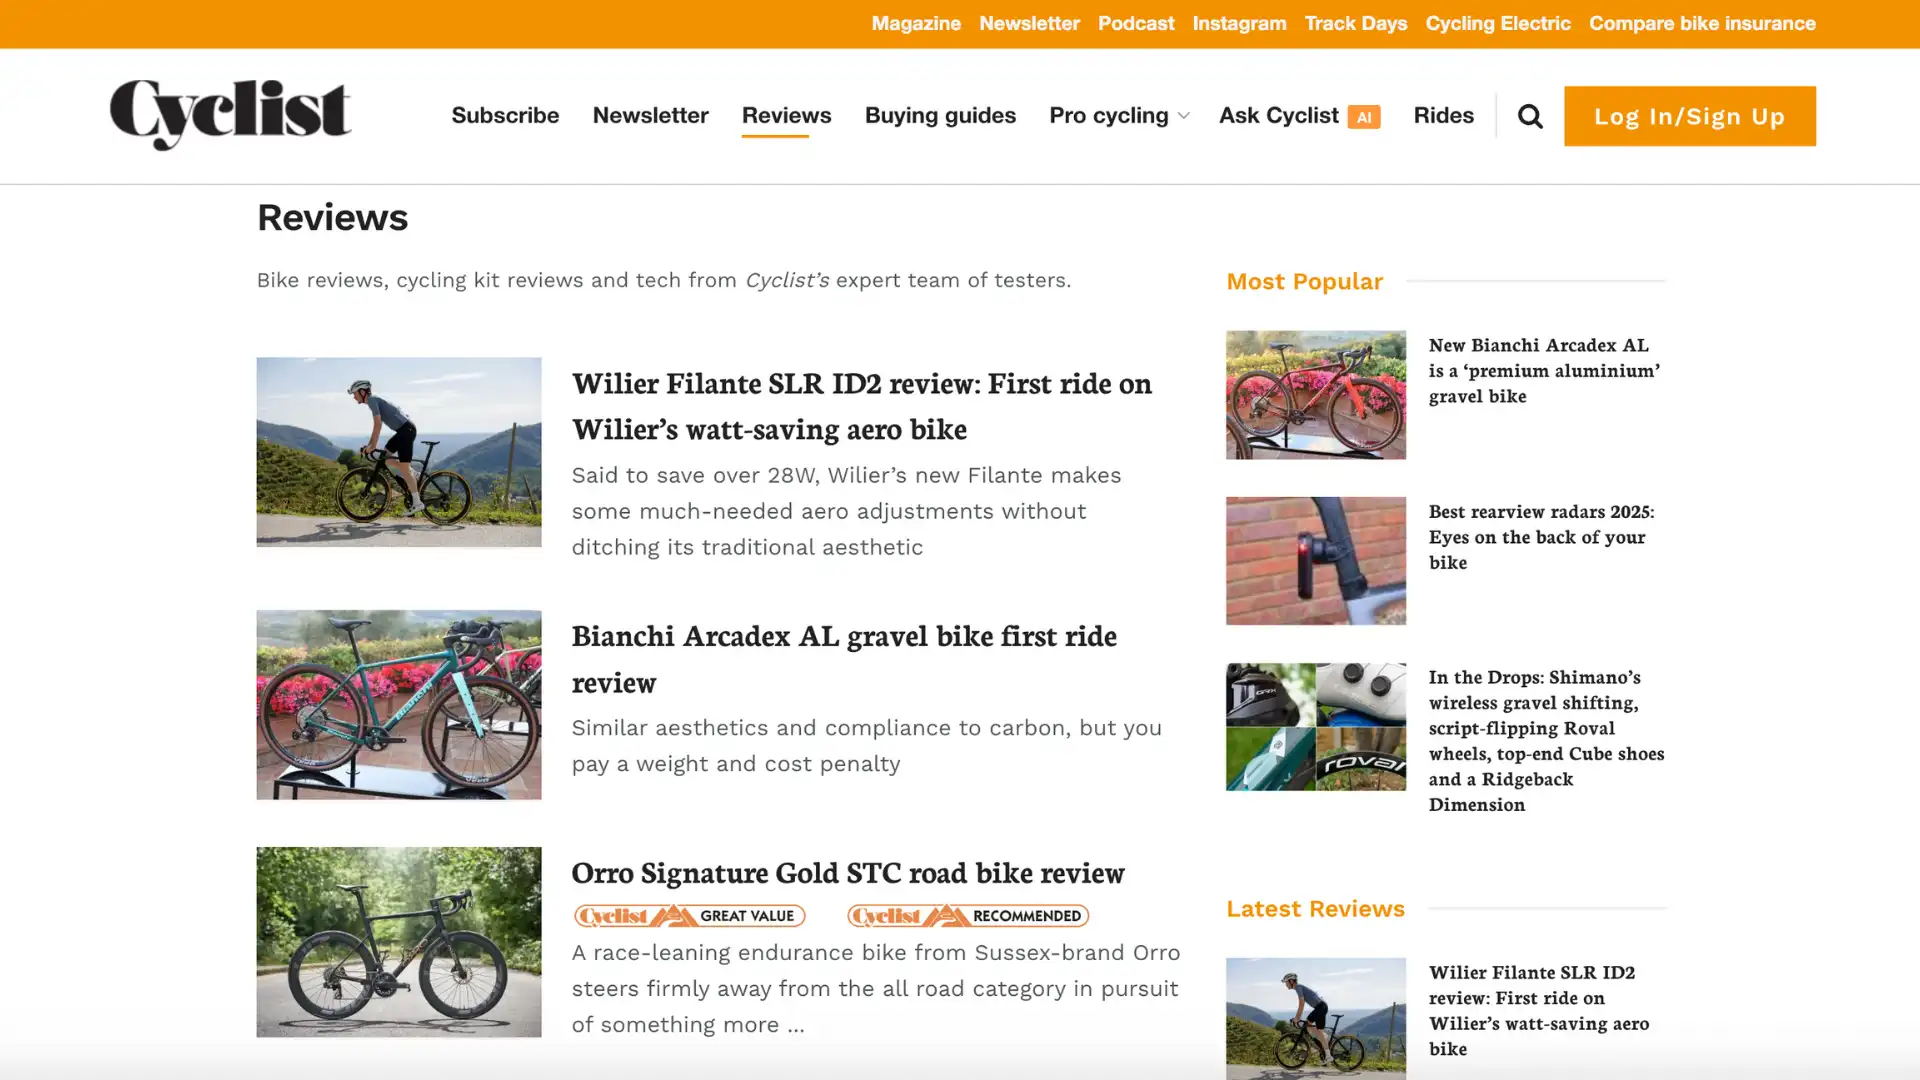
Content sites like Cyclist provide expert, in-depth reviews that are an essential resource for the crucial research phase
Final Conversion/Retention:
Loyalty partners secured 56% of consumer spending—give members exclusive Day 2 access and points incentives for multi-item purchases to maintain basket size.
Commerce solutions doubled their order contribution to 4%—use their cart optimization tools to present real-time tiered incentives: “Add one more item to unlock 20% off.”
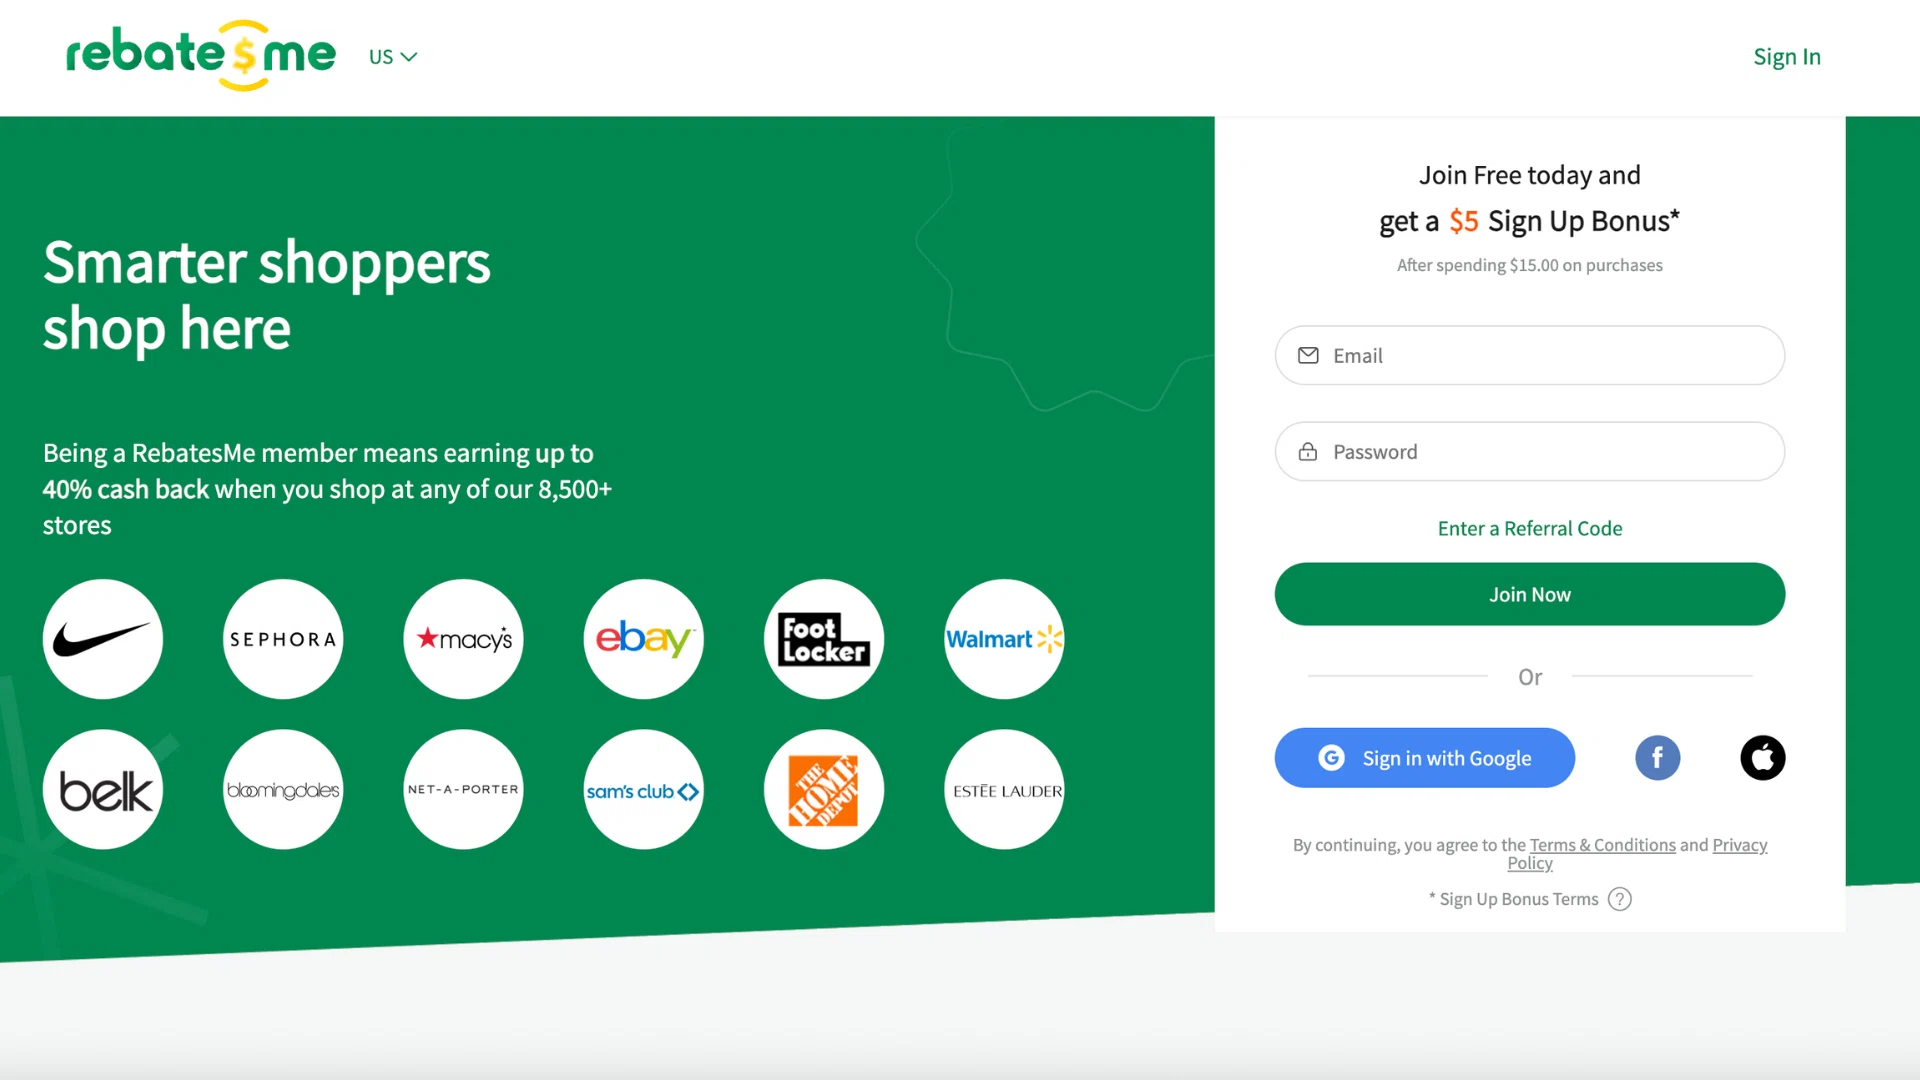
Rebatesme is an example of a rewards partner, that supply the extra motivation that turns browsing customers into buyers
Action: Map your partner budget to the customer journey—acquisition engines (influencers, network) for volume, validation partners (content review) for high-AOV sales, and conversion rate anchors (loyalty, commerce solutions) for efficiency.
The ROI reality check: Economics of volume growth
Brand commission spending increased 10% YoY while revenue grew 5% YoY. At first glance, that appears to be declining efficiency—you’re paying twice as much for half the revenue gain. But this cost-growth divergence isn’t a failure. It’s the price of customer acquisition in a volume-first strategy. The question isn’t whether you should accept higher costs. It’s whether the customers you acquired will be profitable over time.
The marginal cost of acquiring each additional customer exceeded the short-term revenue return during the event itself. This is intentional. Brands competed aggressively for partner priority during the peak sales window, paying premium commission rates to secure placement. The economics only work if the lifetime value (LTV) justifies the upfront investment.
The cost of growth
Brand commission spending increased 10% YoY, double the 5% YoY rise in consumer spending. Brands deliberately spent more—through higher commission rates and increased order volume—to acquire customers at scale.
This short-term margin sacrifice is best viewed as a customer acquisition investment, rather than a cost overrun. When evaluated through the lens of Lifetime Value (LTV), particularly from high-velocity channels like influencers, this higher Cost Per Order (CPO) is justified. You are paying a premium to acquire a customer during a peak window, with the expectation that loyalty programs and future purchases will make that customer profitable in the long run.
Action: Reframe event-day commission spending as a Customer Acquisition Cost (CAC). Justify the higher investment by tracking the Lifetime Value (LTV) of the customer cohorts acquired during the sale.
The commission rate factor
The 10% YoY commission payout increase wasn’t driven solely by 12% YoY increase in order volume. Commission rates themselves climbed as brands bid for partner attention during the two-day sales window.
This rate inflation reflects competitive pressure—when every brand wants influencer placement and loyalty program priority simultaneously, rates rise. Brands that paid premium rates secured the surge in volume. The 10% YoY commission payout increase represents not just more orders, but more expensive orders.
This is normal during peak events. The question isn’t whether to pay premium rates, but whether the customers acquired at those rates deliver long-term value.
The LTV calculation: When higher costs pay off
The volume-first strategy is economically sound only if customers acquired through high-volume, low-AOV channels generate strong lifetime value. Consider influencers—they delivered 163% YoY order growth at 44% YoY lower AOV. Event-day margins look terrible. But if those customers return and repurchase, the upfront sacrifice pays dividends.
The profitability test:
- Track repeat purchase rates for customers acquired during October Prime Day
- Segment by acquisition channel (influencer vs. loyalty vs. content review)
- Measure order frequency and spend velocity over the next 90-180 days
- Calculate true CPO by channel, factoring in LTV, not just event-day revenue
Frame the 10%YoY commission payout increase as a customer acquisition investment, not a cost overrun. The brands that succeeded didn’t optimize for event-day margins—they optimized for customer portfolio value over time.
Margin pressure from fulfillment
Volume growth creates operational pressure beyond commission costs. Orders increased by 12% YoY, and the average number of items per basket rose by 7% YoY, resulting in higher demands for packaging, warehouse labor, and shipping.
Combined with a 12% YoY decline in average item value (AIV), the economics tighten further: you’re fulfilling more orders, with more items per order, at lower per-item values. The operational cost per order rises while revenue per order falls.
Mitigation strategies:
- Negotiate carrier rates before peak season based on projected volume increases
- Position inventory closer to customers to reduce shipping costs and delivery times
- Implement threshold-based free shipping to increase basket size and reduce per-order fulfillment costs
- Optimize packaging efficiency to handle higher item counts without proportional cost increases
Operational efficiency becomes a competitive advantage when volume-first strategies squeeze margins. The brands that planned for 12% YoY order growth and adjusted logistics accordingly protected profitability. Those who didn’t absorb the cost.
Defining acceptable cost per order (CPO)
Not all channels should be evaluated the same way. Your acceptable CPO should vary based on the channel’s strategic role:
Acquisition channels (influencers, network partners):
Evaluate on customer acquisition cost + projected LTV. Accept a higher CPO if repeat purchase data supports long-term profitability. These channels sacrifice event-day margins for portfolio growth.
Value anchors (loyalty, content review):
Evaluate on immediate profitability and retention impact. These channels should be margin-positive during the event itself while also driving long-term retention.
Conversion rate optimizers (commerce solutions, deals/coupons):
Evaluate on conversion rate efficiency and cart optimization. An effective CPO should demonstrate their ability to drive existing traffic, rather than solely generating new customers.
Action: Conduct a post-event channel audit. Calculate true CPO by channel, factoring in both event-day revenue and projected 180-day LTV. Identify which channels delivered profitable customer acquisition and which need commission restructuring or reduced allocation for future events. The 10% YoY commission payout increase is justified only if channel-level ROI supports it.
Looking ahead: Your strategic blueprint for volume-value success
October Prime Day 2025 proved that growth doesn’t depend on premium pricing or high-ticket purchases. In a compressed, high-urgency format, shoppers responded by placing 12% more orders YoY and building larger baskets—even as AOV fell 6% YoY. This volume-for-value trade-off isn’t exclusive to Prime Day. It’s the new blueprint for peak event performance as the holiday shopping season intensifies.
As you prepare for Black Friday, Cyber Monday, and the extended holiday calendar, these findings provide a roadmap for converting volume-driven behavior into sustainable profitability. The brands that succeeded didn’t chase bigger baskets or premium positioning—they engineered the right mix of partners, tactics, and timing to maximize transaction count while protecting margins.
Volume-value strategic blueprint
| Strategic focus | Key action | Supporting data |
| Basket strategy | Prioritize Item count, not just price. Structure promotions to drive more items into the cart. | AIB grew 7% YoY (2.5 to 2.7 items), successfully offsetting the -12% drop in Average Item Value YoY. |
| Partner mix | Fund a full-funnel ecosystem. Ensure partners cover acquisition (volume), retention (value), and research (AOV support). | Acquisition Volume: Social Media Influencers drove 163% YoY order growth. Value Anchor: Loyalty Partners generated 52% of orders and had the highest conversion rate (+26% YoY). |
| Timing & urgency | Maximize Day 1 volume, but strategically shift focus and investment to capture Day 2 growth. | Day 2 delivered +9% YoY growth in consumer spending compared to Day 1 (+2% YoY), demonstrating buyer intent remains until the last sales day. |
| Format efficiency | Maintain compressed windows. Use the two-day structure to maximize conversion pressure. | The compressed two-day format maintains conversion pressure, while extended formats risk momentum decay (as seen in the July sale’s 3% daily average conversion rate drop). |
By segmenting partner investments, analyzing category dynamics, and strategically pacing budgets, brands can convert volume-driven behavior into long-term profitability.
Sustainable growth in partnership marketing requires embracing short-term AOV decline in exchange for higher customer lifetime value (LTV). Brands that increased commission spending 10% YoY while revenue rose 5% YoY made a smart trade: acquiring new customers through influencers, retaining them through loyalty programs, and diversifying their partner mix to sustain future performance.
Final action: Every marketing dollar must serve a clear purpose—either fueling high-volume acquisition or reinforcing high-value sales. Treat partnership budgets as precision instruments to achieve both objectives simultaneously.
As the retail calendar fills with back-to-back events, this dual strategy—balancing scale and value while tracking ROI by partner type—will define the next era of partnership marketing.
Your brand’s success in the next peak sales season hinges on your ability to deploy and manage a diverse partner portfolio, from high-volume influencers to high-AOV content sites, with precision and speed. Request a Demo and see how impact.com can help you build a profitable, full-funnel partnership program that balances volume and value for sustained growth.
Dive deeper into the world of strategic partnership management with these additional impact.com resources: