
Consumer shopping trends in the first half of 2026 show that shoppers pulled back, but they didn’t stop spending. Across 2,319 North American brands and retailers, transactions fell 7% year-over-year (YoY) while average order value (AOV) climbed 16% and consumer spending grew 8%. Shoppers became more selective, spending more on the purchases they did make.
The pressure behind that shift was real. Gas prices climbed from $2.80 a gallon in January to $4.50 by May, according to the US Energy Information Administration, after strikes on Iran triggered what the International Energy Agency called the largest supply disruption in the history of the global oil market. Grocery prices kept climbing too, according to USDA’s Economic Research Service—a fourth straight year of increases layered on top of a record-breaking 11% jump in 2021-2022.
Brands had a choice: protect margin by cutting partner spending, or invest more in the right partners to reach a buyer who now took longer to commit. They chose the latter—raising total partnership spending 10%, reducing fixed placement fees, and investing in performance-based commissions instead.
For brands planning the second half of the year into the holiday season, the number to watch isn’t transaction volume. Shoppers bought less often in H1, but spent more—and only because they trusted a purchase enough to commit. The data below shows that confidence, not raw traffic, decided who won the sale.
- About the data
- A pickier shopper moved brand spending toward performance
- What this means for performance marketers
- 5 consumer shopping trends that defined retail in H1 2026
- 3 trends that could affect your holiday campaign plans
- A more selective shopper means that brands need the partnership channel more than ever
- Appendix
About the data
We analyzed impact.com data from 2,319 same-store North American brands and retailers in the Retail and Shopping vertical across two periods:
- January 1-June 30, 2026
- January 1-June 30, 2025
The same brands appear in both periods, so YoY changes reflect performance rather than brands joining or leaving the platform. All figures track activity on those brands’ owned channels only.
The metrics we focused on were chosen for their value to performance marketing teams: clicks, transactions, conversion rates, average order value, average item value, items per order, consumer spending, commission payouts, and total brand spending.
See report terminology in Appendix A.
A pickier shopper moved brand spending toward performance
- Shoppers took longer to decide. Clicks rose 6% YoY while conversion rate fell 12% YoY.
- They bought less often. Transactions declined 7% YoY.
- They spent more when they committed. AOV climbed 16%, from $111 to $130.
- Brands paid partners more per sale rather than chasing volume that wasn’t there anymore. Commission rates rose 5% YoY, lifting commission payments 14% YoY while non-action-based payments fell 19% YoY.
Brands paired with partners who gave shoppers a reason to spend more came out ahead. The ones still leaning on partners whose main pitch was a lower price paid for it.
What this means for performance marketers
Fewer, larger transactions change what a partner program should be measured on.
- Reset volume targets. Programs measured against 2025 transaction counts will incorrectly read as a failure in a year when the same programs returned more revenue per order.
- Credit the research phase. Shoppers who take longer to decide pass through more partner touchpoints before they buy, giving the partners positioned in that window more influence over the final basket than they had a year ago.
Measuring the old way—pure volume, with last-click credit—could misread a program that’s already working well.
5 consumer shopping trends that defined retail in H1 2026, and what it means for your program
Here’s the story behind each trend, and what it means for how you approach your program for the rest of the year.
1. Shoppers bought less frequently, but spent $19 more YoY per order
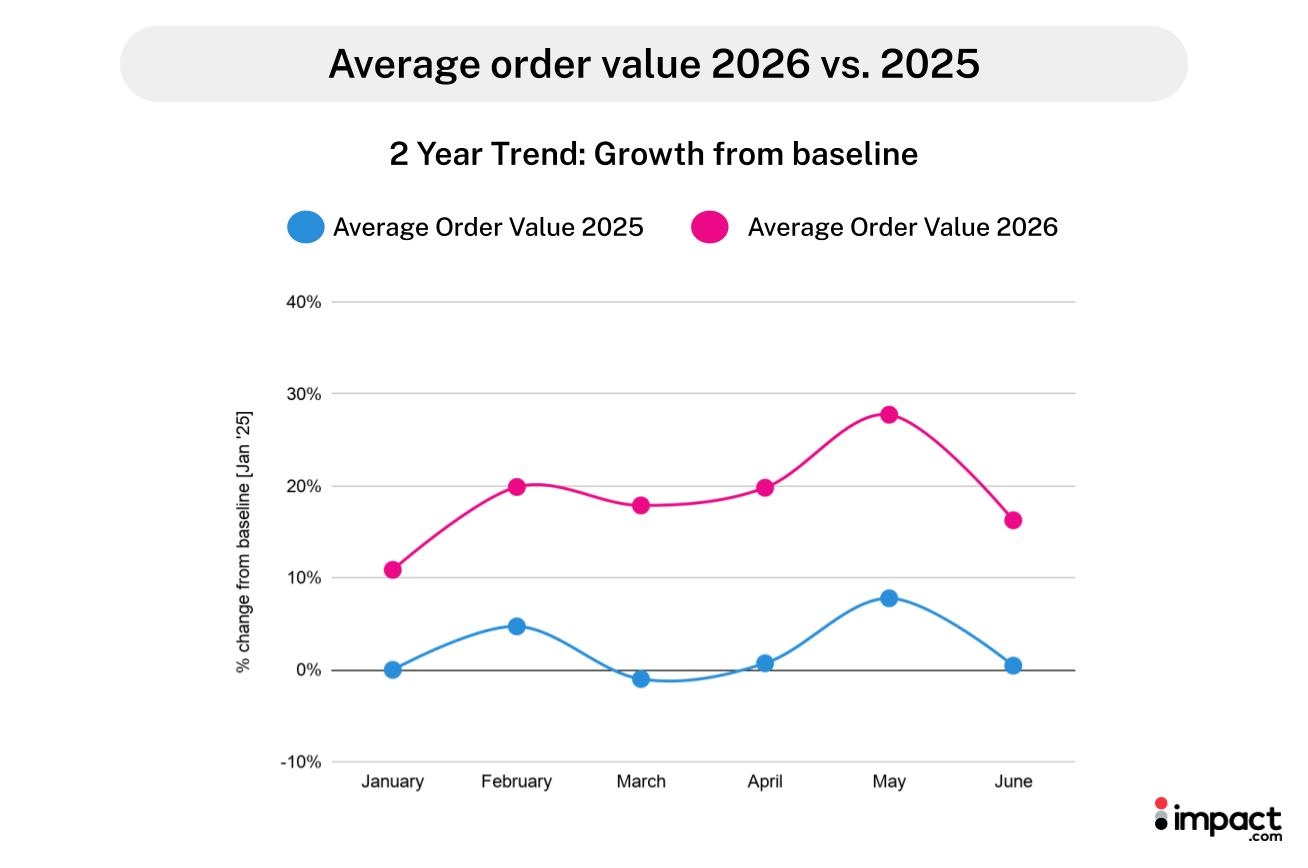
For guidance on how to interpret the graphs, see Appendix B.
The average order came to $130 in the first half of 2026 (+16% YoY). With fuel costs pushing inflation to 4.2% by May, according to the US Bureau of Labor Statistics’ May 2026 Consumer Price Index, the obvious read is that shoppers paid more for the same goods.
Yet shoppers gravitated to higher-priced items (+13% YoY), with transactions falling (-7% YoY) while consumer spending grew (+8% YoY). Completed sales were worth $19 more on average YoY—enough to carry consumer spending past the drop in volume.
Rising prices explain only part of the AOV increase
Two things can lift an order value: shoppers buy more items, or they buy more expensive ones. In the first half of 2026, item choice (average item value +13%) did about four times as much work as items per order (+3%).
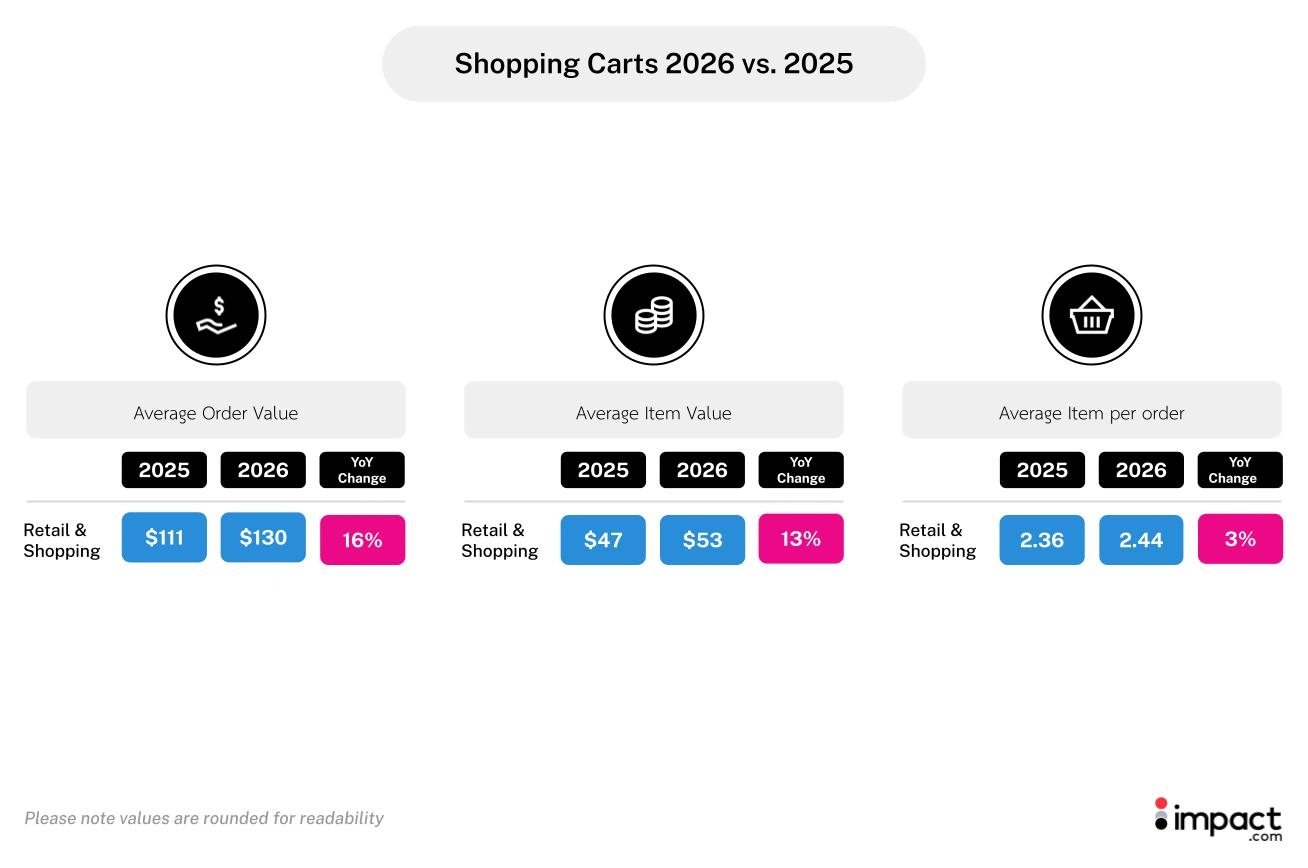
- Average item value climbed 13%, from $47 to $53. Shoppers purchased higher-priced products.
- Items per order moved from 2.36 to 2.44. Baskets grew, but only slightly.
Online prices climbed 2%-3% YoY through late May, according to Adobe Digital Insights. Price movement that small accounts for only a fraction of a 13% hike in item value—the rest could have come from trading up to more expensive products.
2. Conversion rate was down 12% despite rising traffic
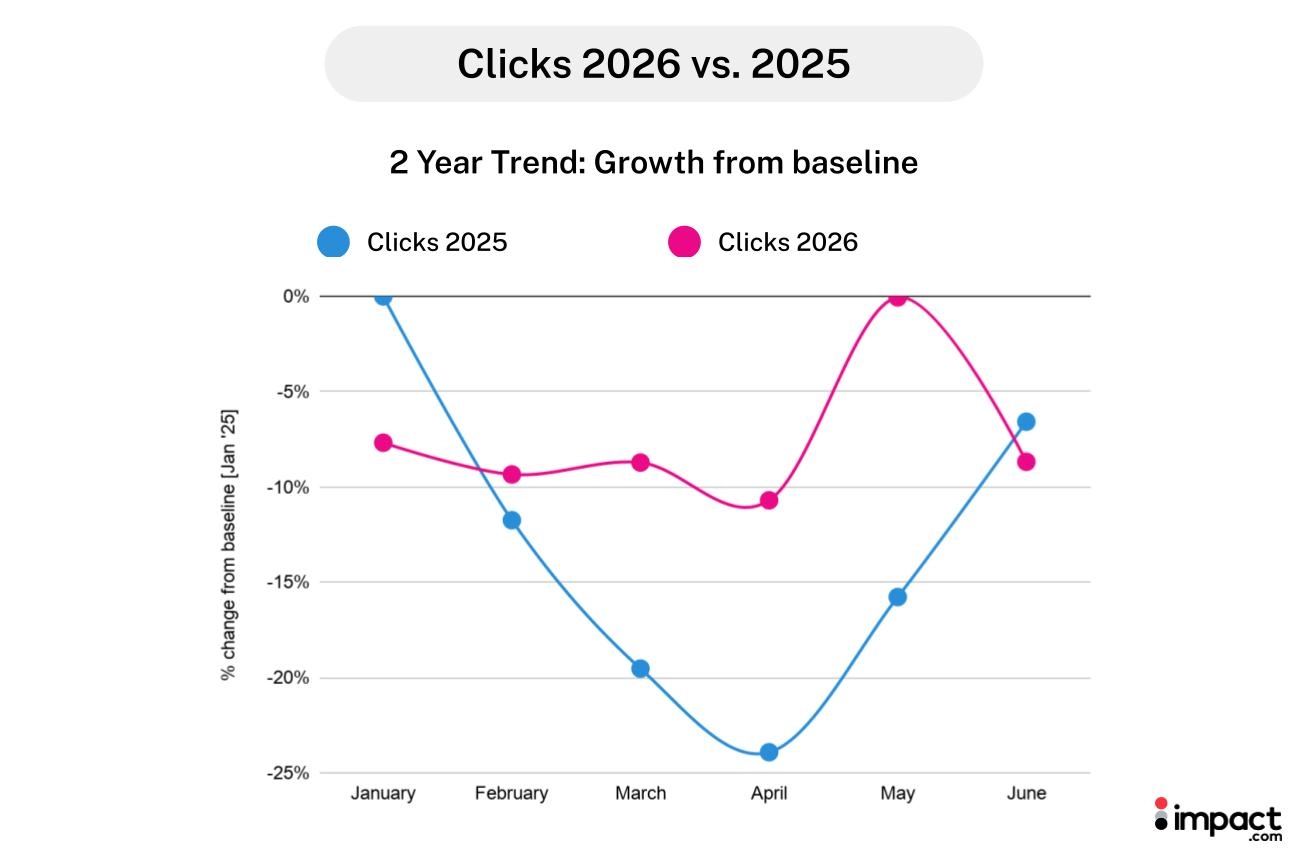
Conversion rate fell 12% in the first half of 2026, a slip that, on its own, looks like shoppers losing interest in buying. Yet clicks rose over the same period (+6%).
That growth held for most of the half, with click volumes topping 2025 levels in every month except January and June, with March through May up 13%-19% YoY.
More shoppers were arriving and browsing, they just weren’t converting at the same rate. That combination suggests more window-shopping rather than less interest overall.
The slowdown tracked with rising costs, with one exception
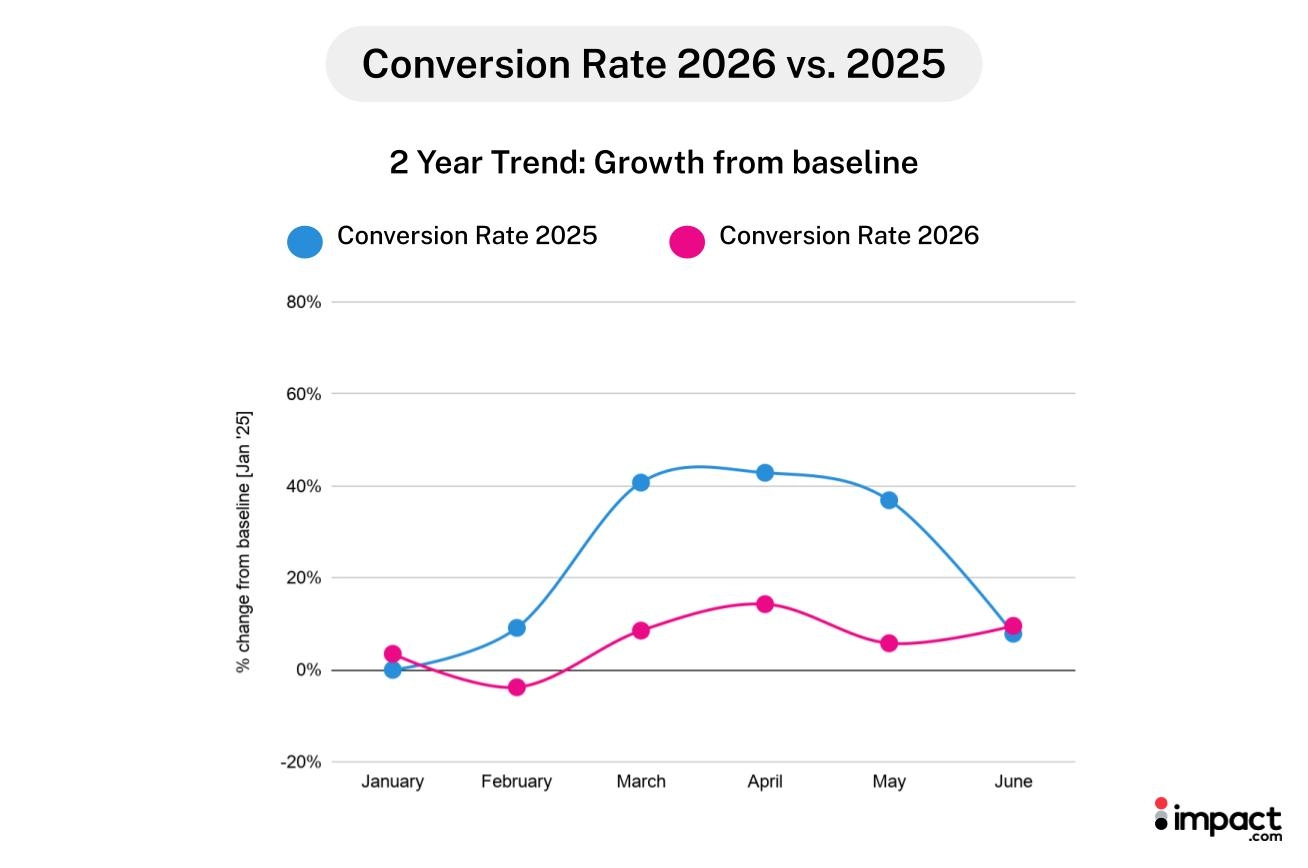
Conversion rates increased YoY in only two months, January and June, and declined most in March through May. That pattern tracks inflation, which climbed from 2.4% in January to a peak of 4.2% in May before easing to 3.5% in June, according to the Bureau of Labor Statistics’ Consumer Price Index.
Yet February breaks the trend outright: the Bureau of Labor Statistics’ February Consumer Price Index reported inflation unchanged from January’s 2.4%, but conversion rates fell 7% from January to February 2026.
Partnership managers whose own numbers dipped hardest in this window may want to weigh the broader cost squeeze as a contributing factor before assuming their program is underperforming. That longer decision window also shapes how much credit different partners get for the sale.
3. Categories split between trading up and trading down
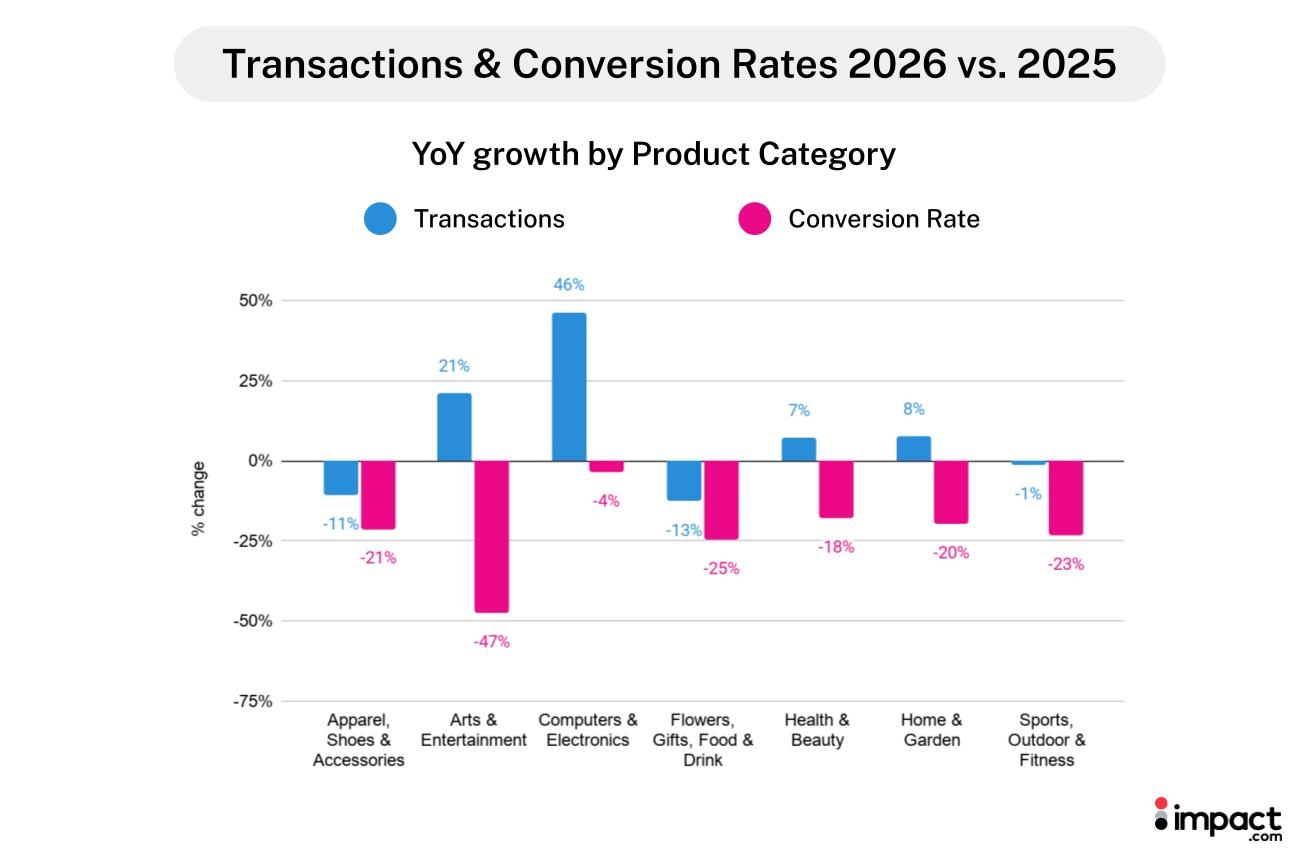
Conversion rate fell in every tracked product category, consistent with the squeeze on consumer budgets. But shopper behavior diverged sharply per product type, suggesting category-specific pressures were also at play.
Apparel, Shoes, & Accessories: fewer transactions, pricier items
In Apparel, Shoes & Accessories, shoppers bought less often but chose pricier items:
- Transactions fell 11% YoY
- AOV rose 17% YoY
- Average item value rose 11% YoY, despite flat online apparel prices, according to Adobe Digital Insights
One possible driver: Executive Order 14324 suspended duty-free treatment for imports below $800 from all countries, according to the Federal Register. That removed the price advantage of ultra-low-cost, direct-from-China apparel. If shoppers priced out of that tier shifted spending toward other, more expensive retailers, that could account for an overall rise in average item value.
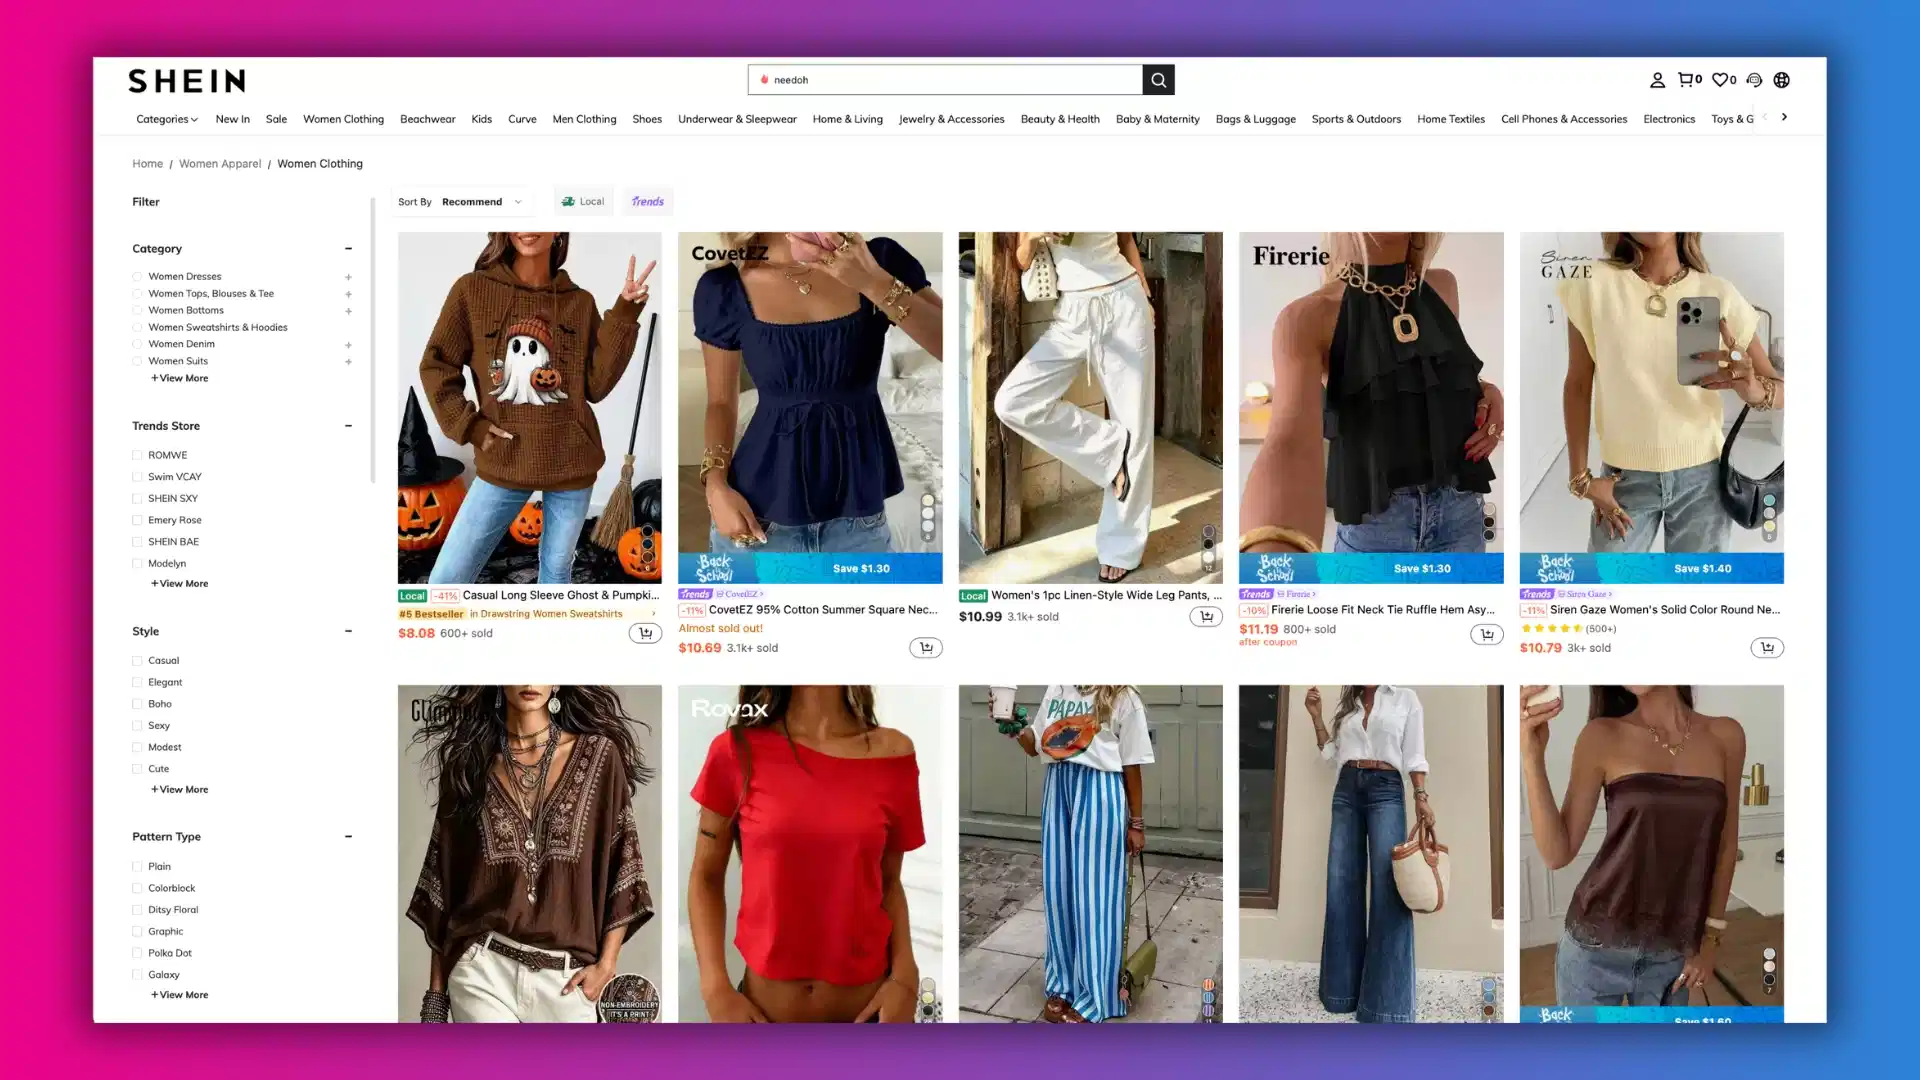
Executive Order 14324 drove up import costs for direct-from-China apparel retailers like Shein, removing the price advantage for consumers.
Computers & Electronics: more transactions, cheaper items
Computers & Electronics is the largest driver of consumer spending growth of any category (38%), driven almost entirely by more transactions rather than higher order values:
- Transactions rose 46% YoY
- AOV fell 6% YoY, the only category where AOV declined this half
- Average item value also declined 7% YoY—even as online electronics prices rose 2%-3%, per Adobe Digital Insights
AI demand drove memory and storage costs to surge, reshaping electronics prices by the time H1 closed. Federal Reserve officials were watching the same dynamic: New York Fed President John Williams said sustained AI-driven demand outpacing supply isn’t something the Fed would simply look past, according to the Associated Press.
Apple felt the pressure, raising MacBook and iPad prices up to 25% on some models and saying, “we have never seen a component price increase this much, this quickly,” the Associated Press reported. Sony, Dell, and HP also raised prices on PlayStation consoles and laptops.
Against that backdrop, rising costs may have made premium options less attractive or unaffordable—pushing more shoppers toward lower-priced items.
Source: The Associated Press
Arts & Entertainment: buying more, cheaper items
Arts & Entertainment posted the steepest conversion rate decline of all tracked product categories (-47% YoY), as shoppers clicked through far more options before buying and chose smaller-ticket items when they did:
- Transactions still rose 21% YoY
- AOV increased 4% YoY
- Average item value fell 15% YoY
- Items per order climbed 22% YoY, offsetting the drop in item value
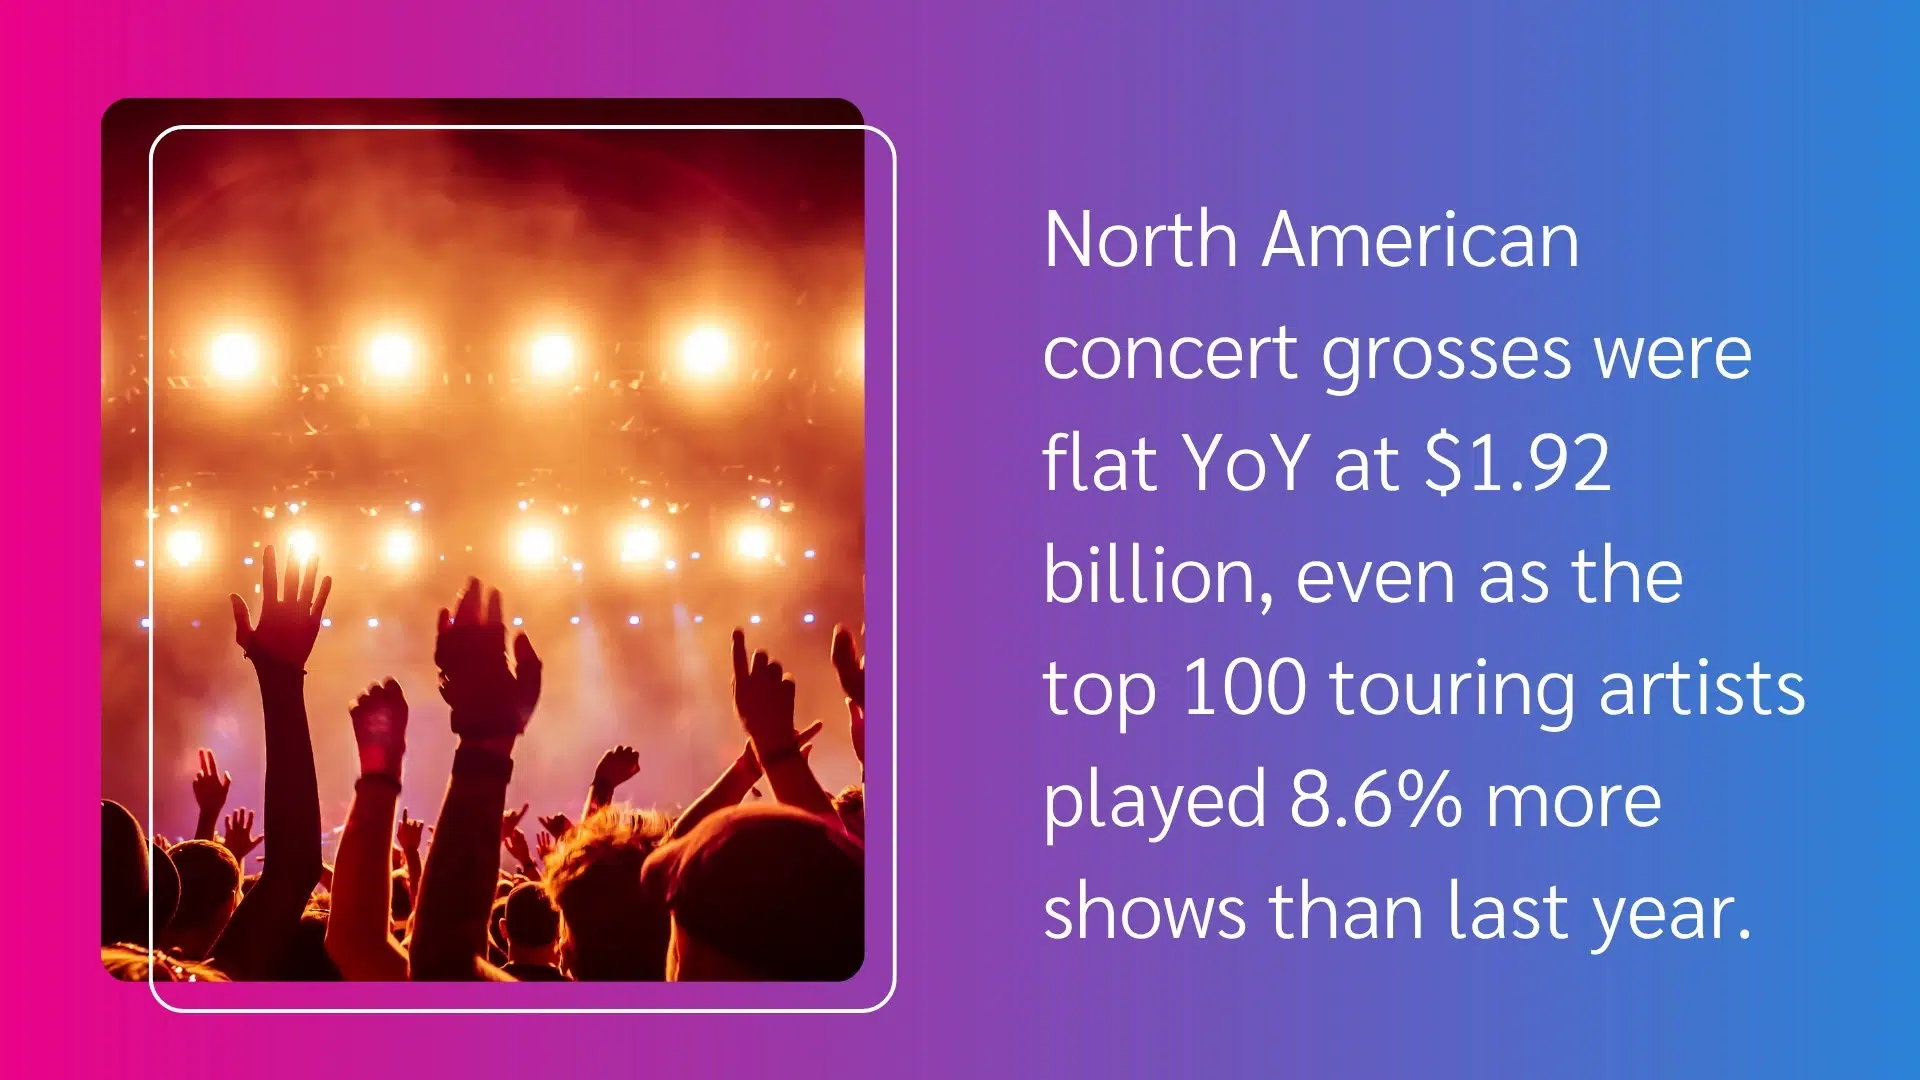
Per Pollstar’s 2026 Mid-Year Business Analysis, North American concert grosses were flat YoY at $1.92 billion, even as the top 100 touring artists played 8.6% more shows than last year. Shoppers could be spreading spend across more, smaller events at more affordable prices rather than pulling back from live entertainment altogether.
Source: Pollstar’s 2026 Mid-Year Business Analysis
Flowers, Gifts, Food, & Drink: the one category where spending fell
Flowers, Gifts, Food & Drink was the only category where consumer spending declined YoY (-9%):
- Clicks rose 16% YoY while conversion rate fell 25% YoY—shoppers browsed in greater numbers, but bought less often
- AOV rose 4% YoY, but the modest trade-up didn’t offset the transaction drop (-13% YoY)
According to the Bureau of Labor Statistics’ Consumer Price Index, prices for flowers and indoor plants averaged 6.1% higher YoY in 2026 than in 2025. This sustained cost pressure could indicate that price, not fading interest, is what kept these shoppers from buying.
4. Brands cut back on fixed fees and doubled down on commissions
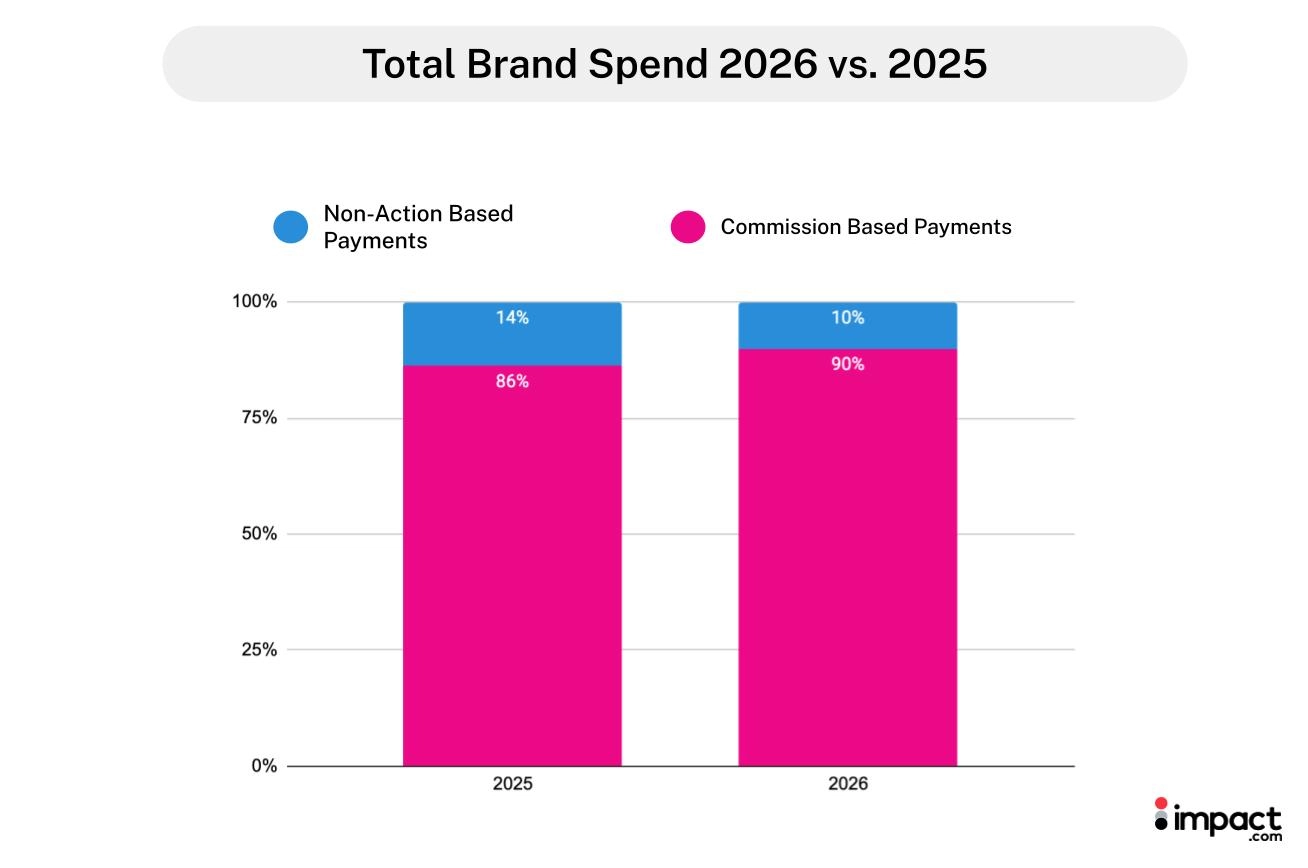
Total brand spending rose 10% in the year’s first half, and that spending funneled less into guaranteed placement and more into completed sales:
- Commission payments, the brand spend share tied to a specific completed action, rose 14% YoY
- Non-action-based payments, covering expenses such as bonuses and fixed placement fees, fell 19% YoY
Commissions made up 90% of brand spending in H1 2026, up from 86% in 2025.
The commission increase reflects a lengthening consumer journey
Brand spending grew faster than consumer spending (+8% YoY), and brands seemed to understand that this was the cost of holding partners’ attention through a slower sale.
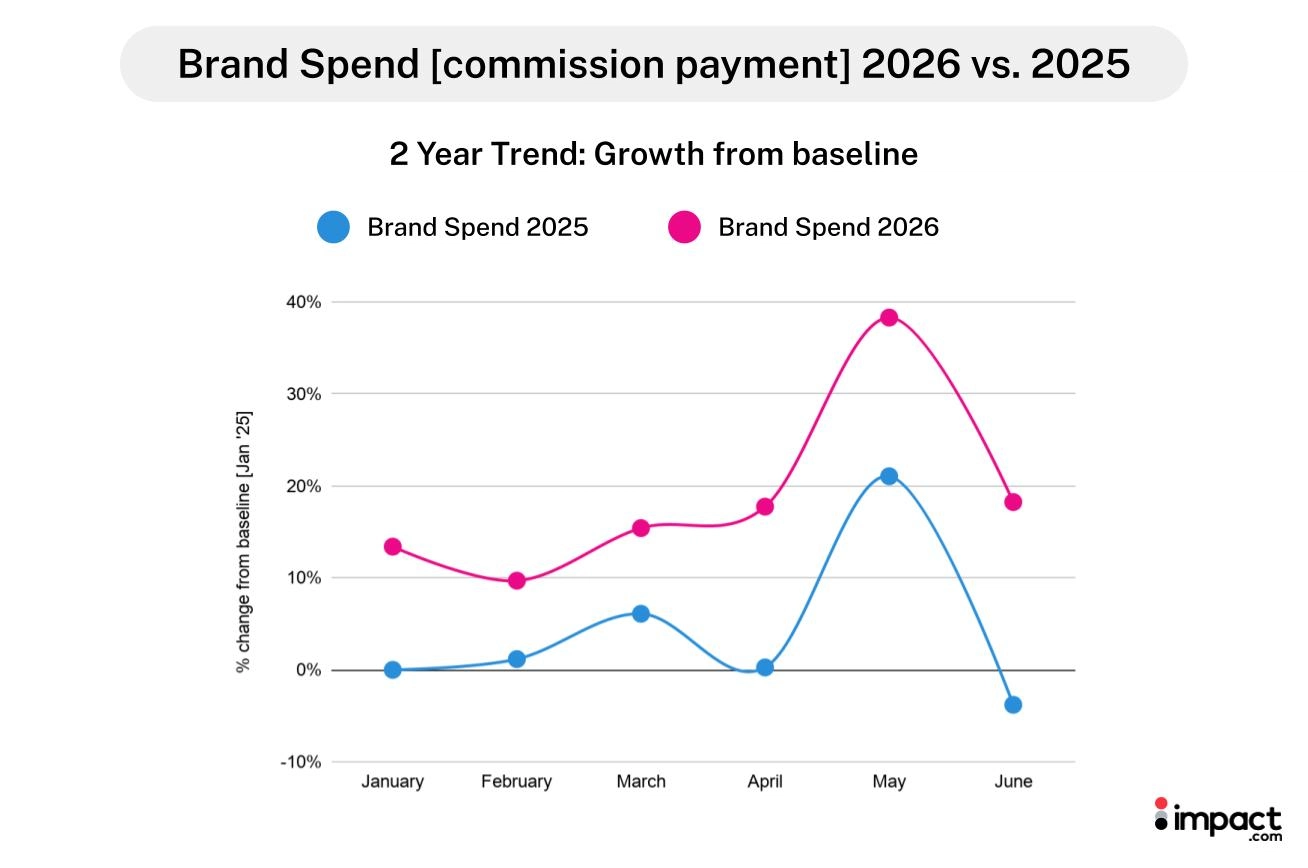
Commission rates grew 5% YoY as brands tried to keep partners incentivized through a longer, more deliberate purchase journey, with conversion rates down (-12% YoY) and transactions falling (-7% YoY).
That increase wasn’t spread evenly across the half:
- April: H1’s second-largest jump in commission payouts (+17% YoY)—tracks the broader rate increase already in play across H1.
- May: highest monthly commission payouts in both years
- June: the half’s largest jump in commission payouts (+23% YoY)—may also reflect Prime Day’s halo effect landing in June this year instead of July, as it did in 2025.
5. As the shopping journey stretched, partner roles specialized
As shoppers took longer to decide, partner types split by role: some carried more of the clicks that open the funnel, others carried more of the transactions that close it.
| Partner type | Share of clicks | Share of transactions | Share of consumer spend | Conversion rate change (YoY) |
|---|---|---|---|---|
| Network Partners | 50% (up from 44%) | 20% (up from 19%) | 20% (up from 17%) | −18% |
| Content Review | 17% (flat) | 9% (down from 10%) | 12% (flat) | −27% |
| Loyalty & Rewards | 15% (up from 14%) | 55% (up from 48%) | 54% (up from 51%) | −5% |
| Technology Solutions | 7% (down from 10%) | 5% (up from 4%) | 5% (flat) | +42% (largest gain) |
| Voucher & Coupon | 3% (down from 6%) | 5% (down from 9%) | 5% (down from 11%) | −11% |
| Social Media Influencers | 4% (down from 6%) | 4% (down from 5%) | 3% (flat) | +2% |
| Media Arbitrage | 3% (flat) | 1% (down from 3%) | 1% (flat) | −69% |
“Other” not shown in the tables.
Network Partners remained the largest source of traffic this half, with clicks up from 44% to 50%. Their share of transactions moved less, from 19% to 20%. They’re the opening act in the funnel, not the close.
Content Review Partners inform shoppers during the research process rather than closing the sale, with 26% of brand spending outpacing their 9% share of transactions and 17% of clicks.
Only two partner types grew transaction volume this year, indicating that they both excel at closing the sale after shoppers have already decided: Loyalty and Rewards Partners rose 7% YoY and drove 55% of transactions. Technology Solutions Partners gained 15% YoY and posted the largest conversion rate gain of any partner type (+42% YoY), still a small share of the total but the fastest-improving.
Voucher & Coupon Partners’ lost share on both fronts: clicks (6% to 3%) and consumer spending (11% to 5%), moving toward partner types that reach shoppers earlier or close the sale directly.
Social Media Influencers held a small, steady position—4% of clicks and transactions on 2% of brand spending—growing more efficient as its reach narrowed: click share eased from 6% to 4%, while conversion rate rose 2% YoY.
Looking ahead: 3 trends that could affect your holiday campaign plans
The shopper who bought less often but spent more per order is the one that you’ll be planning your holiday program around this year.
Past data can’t predict future behavior, but three trends are already visible across H1 2026, 2026’s summer Prime Day event, and 2025’s shopping trends.
1. Prime Day’s decision window lengthened, too
According to our July Prime Day 2026 benchmark report, the sales event repeated a pattern documented throughout H1 2026: shoppers are converting less because they’re taking longer to decide before buying.
- Shoppers took almost two more days to research before buying (9.37 days to 11.01)
- Loyalty & Rewards Partners, built on relationships shoppers already have, carried more of the event’s transactions than Network and Voucher & Coupon Partners, which provide access to a broader audience—the same split seen across the full half
Holiday shopping follows a similar structure: a short buying window that follows weeks of research. If Black Friday and Cyber Week show the same lengthening, brands present during that research window are more likely to capture sales than those waiting until day 1 of the event.
Prime Day gives us a live preview of 2026. The next two trends look further out, using last year’s second half as a lens for what H2 2026 could bring. Because each year’s analysis draws on a different set of active brands, treat these as seasonal patterns worth watching rather than direct forecasts.
2. A one-month spike in 2025 could become a full season in 2026
Our 2025 full-year affiliate benchmark report found commission spend drifting upward throughout 2025, spiking sharply in November as commission payments and rates jumped beyond their already elevated baseline. That one-month intensity is now a sustained pattern across H1 2026.
- Commission payments rose modestly for most of 2025, but November was an outlier— commission payments and commission rates both spiked well above trend.
- H1 2026 commission payments rose 14% YoY, holding an elevated share of total brand spend (90%) across nearly the whole half.
A commission rate increase used during one competitive month is now the baseline price of partner performance so far in 2026. If this pattern carries into the holiday season, “elevated” commission rates may not look like a spike at all. It will just be the going rate.
3. Research traffic outpaced purchases in 2025—see whether that gap widens
The 2025 full-year affiliate benchmark report saw research activity concentrate during the month that also saw the year’s sharpest gap between clicks and completed purchases:
- November 2025 saw a sharp surge in clicks YoY, while transactions stayed nearly flat YoY.
- That research-heavy behavior also concentrated in Q4, which claimed a bigger click share than it had in 2024.
H1 2026 already shows the same pattern. If it continues into Q4, this year’s click-to-purchase gap could stretch even wider than November 2025’s, meaning a rise in traffic alone doesn’t guarantee that sales are close behind.
A more selective shopper means that brands need the partnership channel more than ever
Brands met that shopper by moving budget out of fixed fees and into commissions, paying more per completed sale to stay in front of a longer, more deliberate path. Different partner types carried different parts of that path, from the clicks that opened it to the transactions that closed it.
Together, the five signals point to a shopper who converts through research and trust—exactly the kind of shopper the partnership channel exists to reach. That budget shift is a bet that pay tied to the sale will pay off, no matter how long the path to purchase takes.
The research window has lengthened for the second straight year. Brands have reason to keep making the same bet.
Appendix
Appendix A: Terminology
| Term | Definition |
|---|---|
| Total brand spending | The sum of action-based (commission payouts) and non-action-based payments (bonuses, paid placement fees, etc). |
| Non-action based payment (Fixed expenses) | Brand expenditure that occurs when brands pay their partners, bonuses, paid placement fees, etc. |
| Action-based payment (commission) | Brand expenditure that occurs when brands pay their partners a commission for a specific, predefined action. |
| Network partners | Publisher platforms that broker access to brand campaigns and provide tracking, reporting, and payment services. This includes publishers categorized as network, syndication blog networks, or CPA networks. |
| Content review partners | Publishers that produce editorial content to promote, compare, and list products and services. This includes premium publishers, shopping comparisons, financial comparisons, content, bloggers, etc. |
| Loyalty and rewards partners | Publisher platforms that incentivize transactions from consumers, employees, or businesses through a membership or benefits reward program. |
| Voucher and coupon partners | Publishers who aggregate and classify coupons, vouchers and/or discounts for consumer savings. |
| Technology solutions (Commerce Solutions) | Innovative technological solutions that enhance the customer experience and drive conversions through various touchpoints, such as banking integrations, post-checkout offers, retargeting tools, or embedded software solutions |
| Media arbitrage | Search engine, social, or programmatic marketers that manage keyword campaigns for brands, often on a performance basis. |
| Cross-audience monetization | Businesses that publish offers, content, and complementary (non-competing) products to current customers or audiences (e.g., exit traffic, improved UX) to drive incremental revenue. |
| Analysis period | 2025: January 1, – June 302026: January 1, – June 30 |
Appendix B: How to interpret the graphs
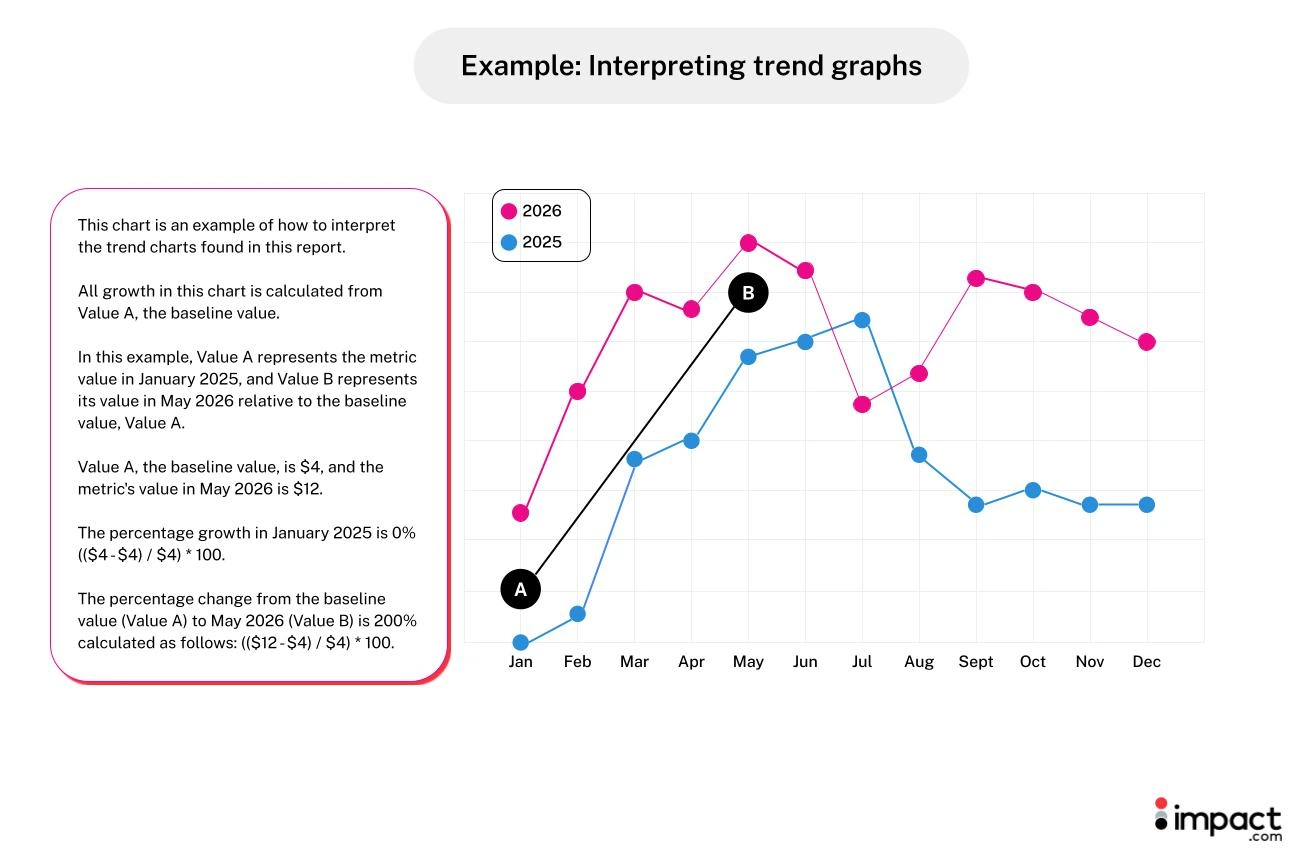
This chart illustrates how to interpret the trend charts in this report.
All growth in this chart is calculated from Value A, the baseline value.
In this example, Value A represents the metric’s value in January 2026, and Value B represents its value in May 2026 relative to the baseline value, Value A.
Value A, the baseline value, is $4, and the metric’s value in May 2026 is $12.
The percentage growth in January 2026 is 0% (($4 – $4) / $4) * 100.
The percentage change from the baseline value (Value A) to May 2026 (Value B) is 200% calculated as follows: ($12 – $4) / $4) * 100.