
Brands are planning for a holiday season in which the National Retail Federation forecasts retail sales will rise 4.2% over last year.
Amazon’s Prime Big Deal Days (October 6–7, 2026) gave brands an early lead on how holiday shopping is taking shape. The Prime Day halo effect is the lift in shopping activity at brands and retailers other than Amazon around the event. This analysis shows what happened alongside Prime Day. It can’t isolate how much of it Prime Day caused.
impact.com data on partner-driven activity among 1,286 North American brands and retailers in Retail and Shopping shows that shopper activity built in the weeks before the event. Clicks typically ran ahead of 2025 in the lead-up, with two exceptions (September 11th and 13th). The average consumer journey also ran just under half a day longer than last year, at 8.44 days vs. 8.07. During the event, partner-attributed consumer spending rose 8% YoY.
Shoppers clicked more, took longer to decide, and converted less often—yet transactions still grew 3% YoY.
Here’s what the October Prime Day halo effect looks like, and what it could mean for your Black Friday and Cyber Monday marketing strategy.
The data behind the insights
We analyzed impact.com data from 1,286 North American brands and retailers within the Retail and Shopping vertical during:
- October Prime Day 2026 (Oct. 6–7, 2026)
- October Prime Day 2025 (Oct. 7–8, 2025)
- The full month leading up to and including each Prime Day event
This doesn’t include any data from Amazon. It covers partner-attributed activity on the brands’ and retailer’s owned channels only. It doesn’t capture their total sales or traffic from other channels.
The metrics we focused on were chosen for their value to performance marketing teams: clicks, transactions, conversion rates, average order value (AOV), consumer spending, and commission payouts across different partner types.*
*See the full methodology in Appendix A and the terminology in Appendix B.
4 ways built-up demand fueled October’s Prime Day halo—and how to meet it this holiday season
Each of our findings from this Prime Day points to smart moves you can make before your next sales event.
1. The two days split the event almost evenly, but only Day 1 grew transactions YoY
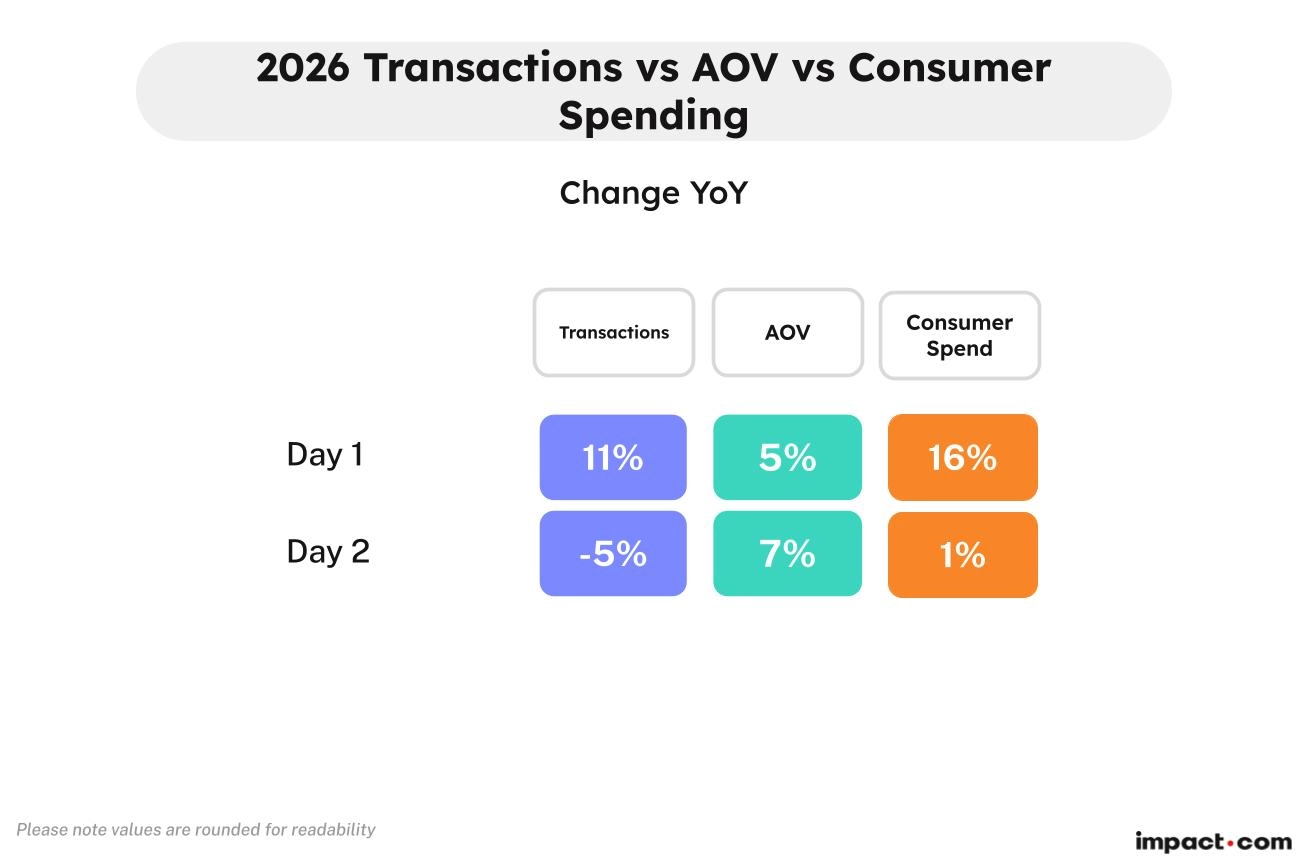
Across the Prime Day window, transactions rose 3% YoY and consumer spending rose 8% YoY.
The two days performed similarly in 2026, with Day 1 accounting for slightly more transactions (53%) and consumer spending (52%). In 2025, Day 2 had a slight edge, at 51% of transactions and consumer spending.
Consumer spending increased YoY on both days, but Day 1 had both order and AOV growth:
- Day 1: transactions increased 11% YoY and AOV increased 5% YoY, which together put consumer spending up 16% YoY.
- Day 2: transactions decreased 5% YoY while AOV increased 7% YoY, leaving consumer spending 1% above 2025.
Day 1 showed increased YoY transaction growth, while Day 2 showed higher YoY AOV growth (7% vs. 5%), which suggests the two days may have drawn different buying behavior.
2. Shoppers researched longer and bought more carefully
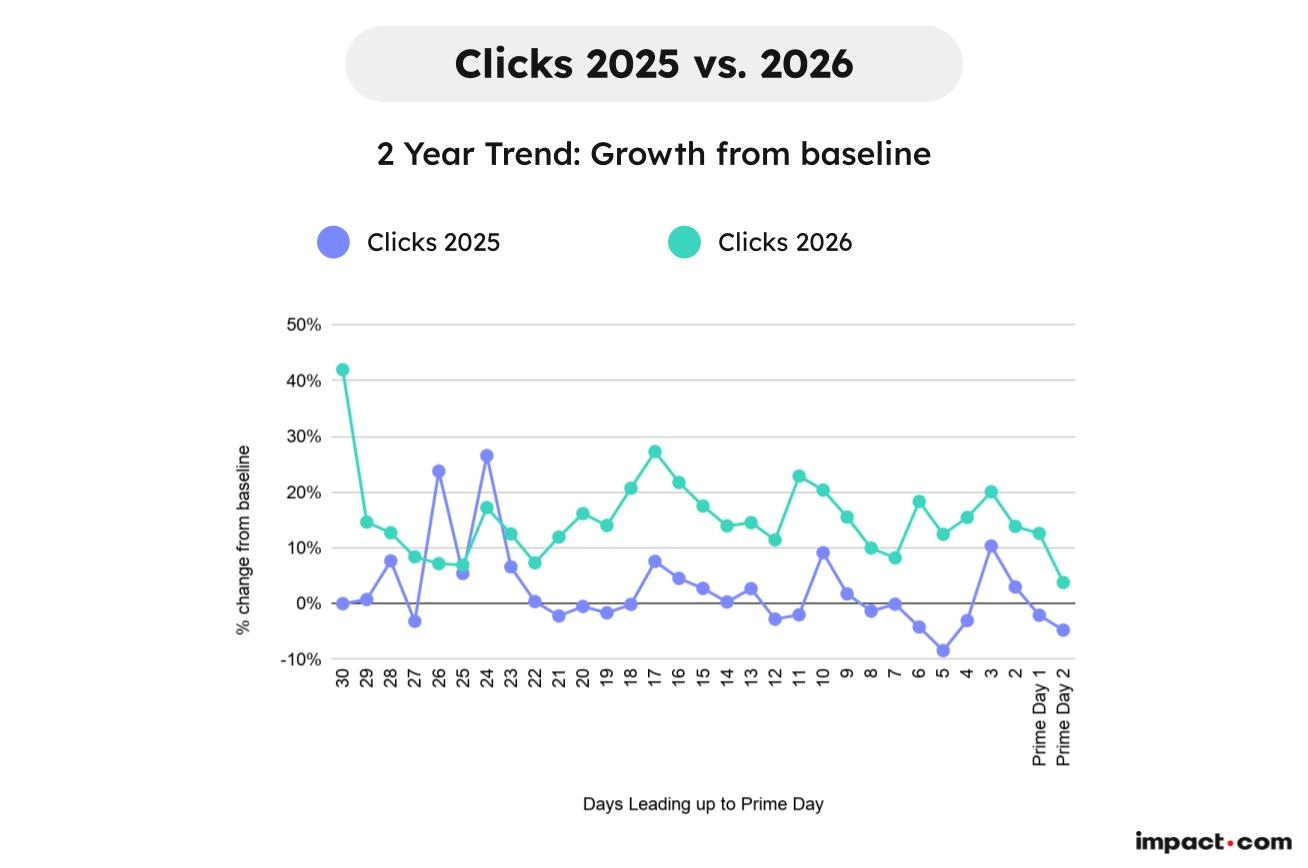
Shopping started before the Prime Day window did, with demand already active in the weeks beforehand.
In 2026, clicks typically ran 8% to 27% above baseline on every lead-up day except days 26 and 24.*
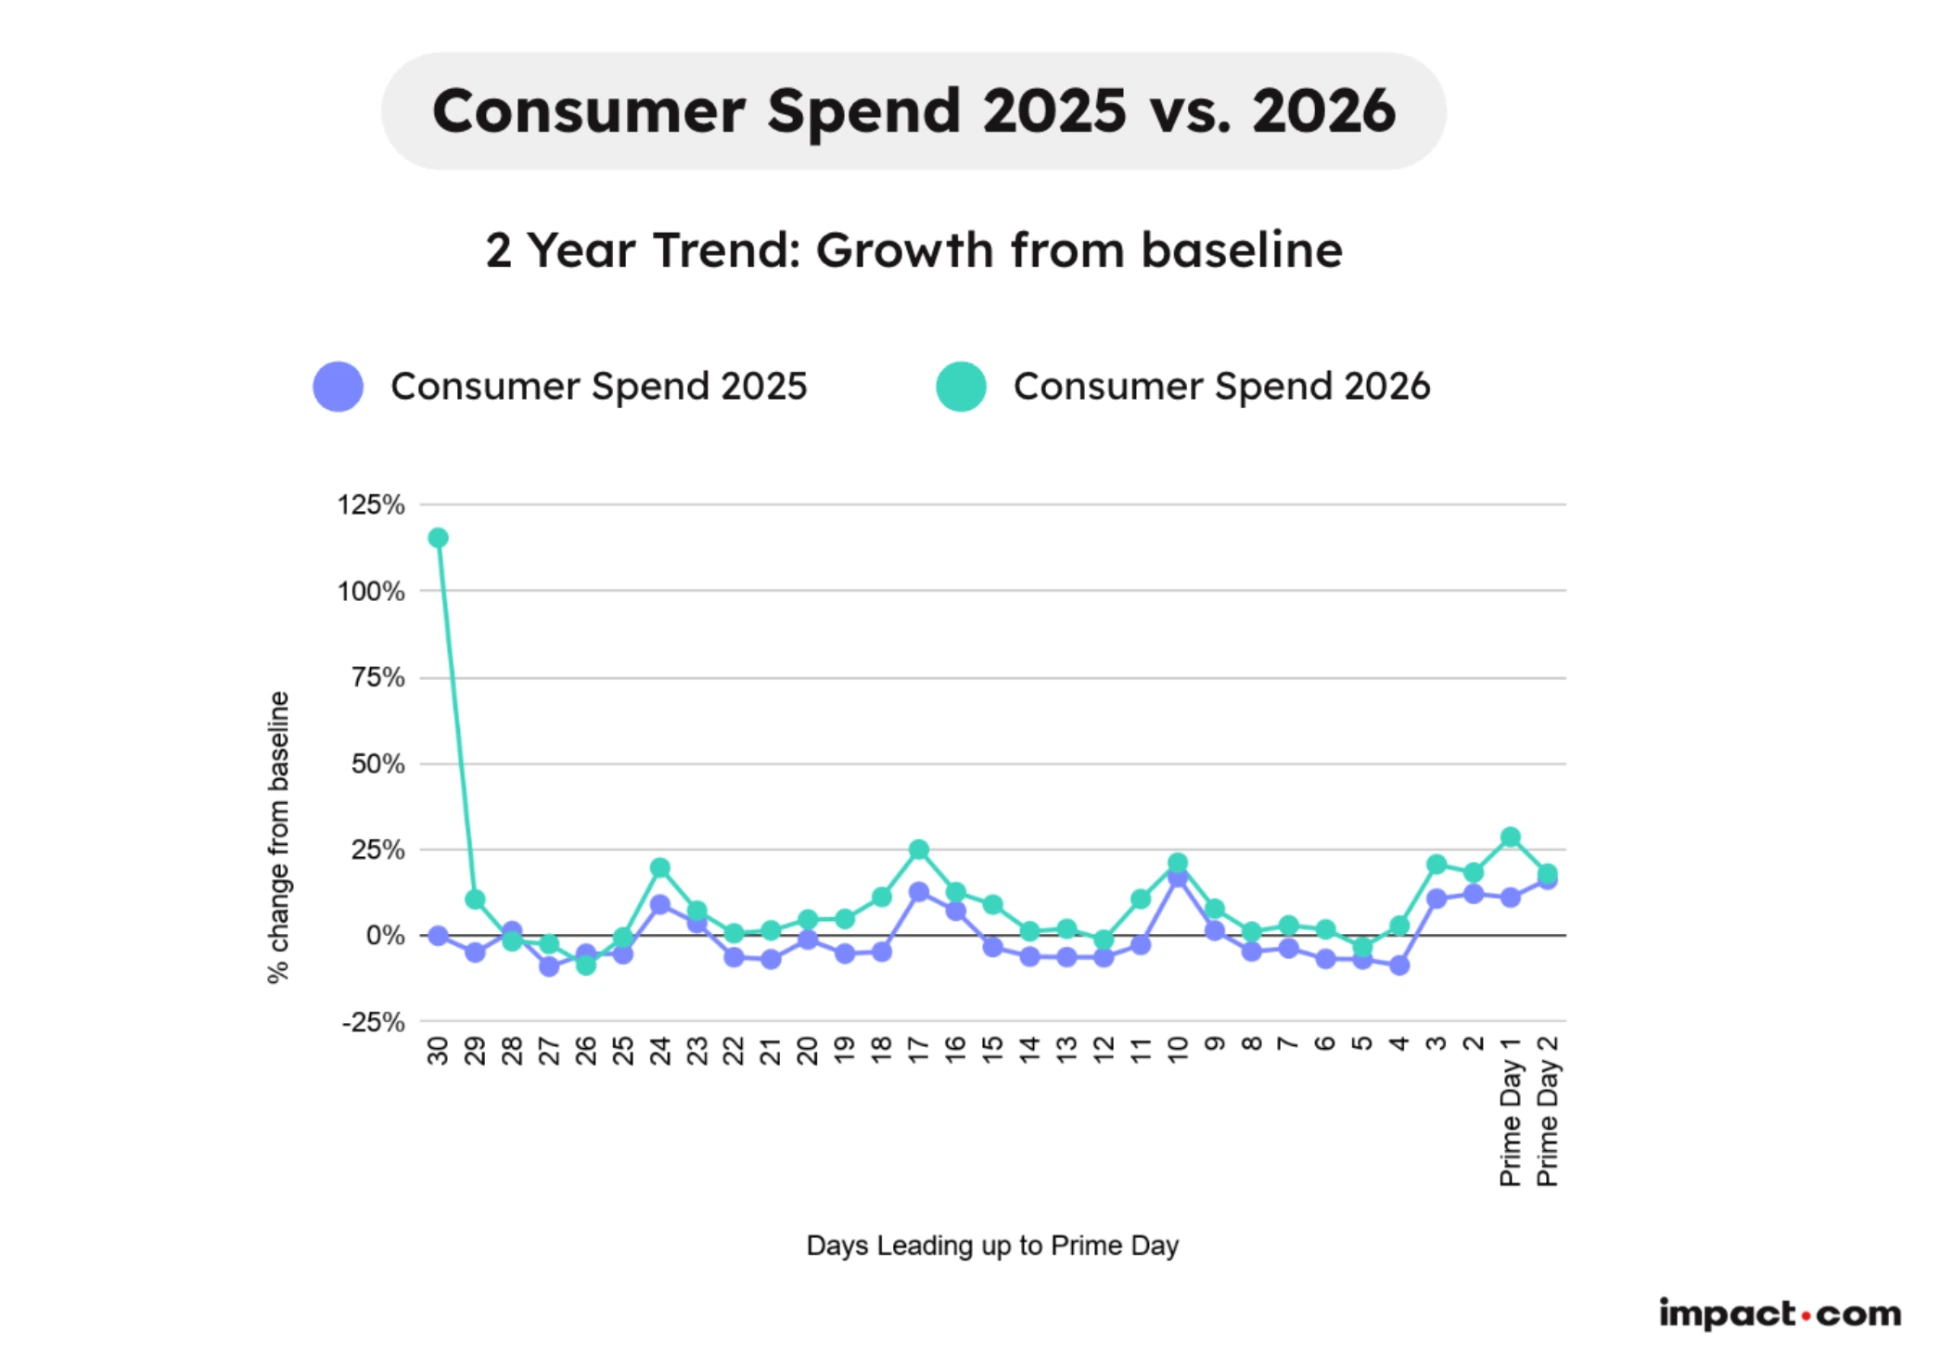
Consumer spending ran above 2025 on most lead-up days, with spikes around days 24 and 17. High-profile Apple product launches may have played a part. Apple opened iPhone 18 Pro pre-transactions on September 12, a day before spending spiked. The iPhone 18 Pro, Apple Watch Series 12 and Ultra 4, and AirPods 5 then became generally available on September 18, two days before transactions peaked.
A strong Day 1 and a flat Day 2 can look like a failed second day, but the data could indicate something else: shoppers who had spent weeks comparing options bought when the window opened, which left less for Day 2 to collect.
Shoppers had also been taking longer to decide. The average consumer journey ran just under a half a day longer than last year—8.44 days in the month leading up to and including the window, compared with 8.07 days.
*Labor Day was in the 2026 lead-up, but not in 2025, so it’s excluded from these comparisons. See Appendix A.
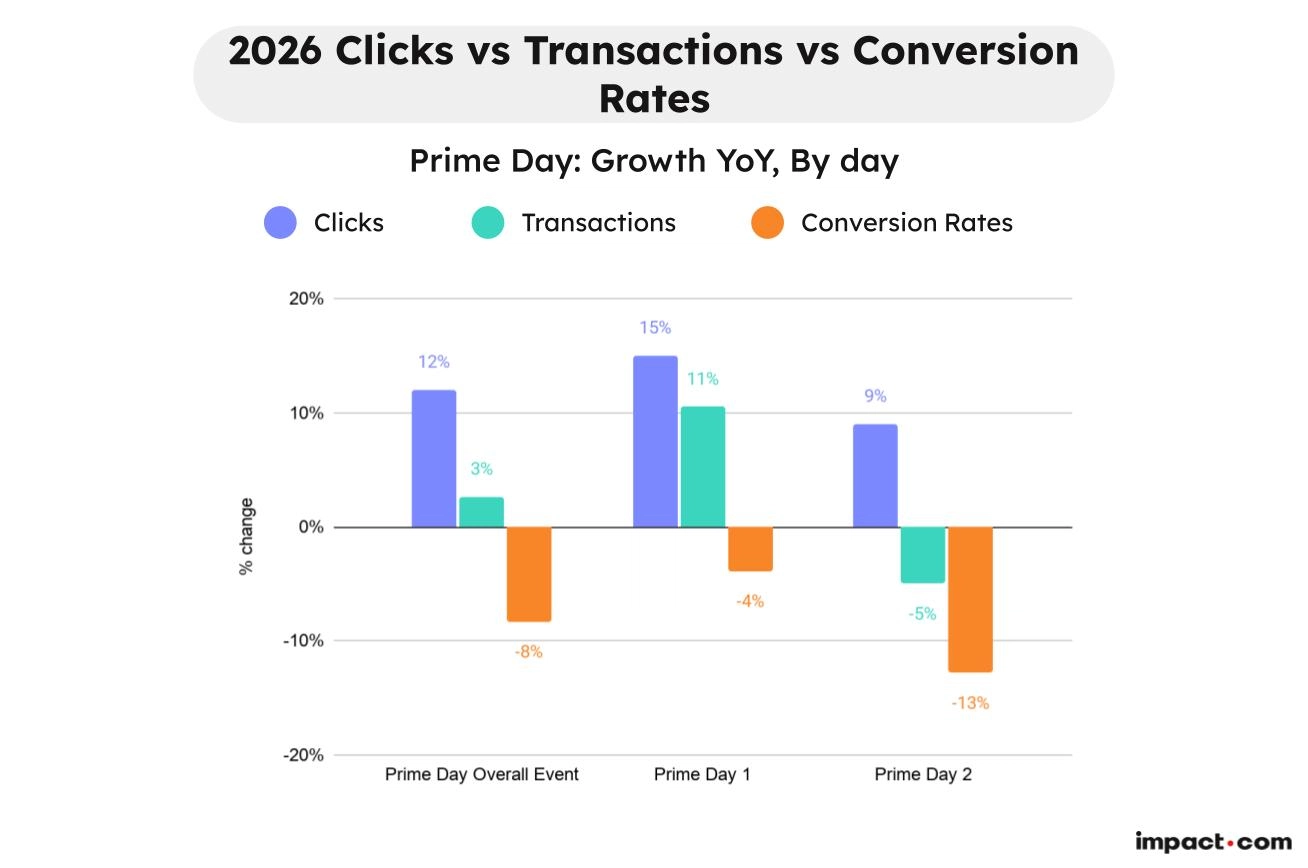
Shoppers who had spent weeks comparing arrived in the window clicking more but converting less often. Clicks rose 12% YoY, but conversion rate fell -8% YoY and transactions grew just 3% YoY.
Performance varied across both days of the event:
- Day 1: clicks increased 15% and conversion rate decreased only -4% YoY, and transactions grew 11% YoY.
- Day 2: click growth eased to 9% YoY while conversion rate declined more dramatically (-13%), and transactions also declined (-5% YoY).
Day 1’s slightly stronger conversion rate fits shoppers who had already made up their minds. Those who hadn’t may have still been browsing on Day 2, when conversion rate fell further. Earlier promotions may also have pulled some transactions and consumer spending ahead of the window.
*Labor Day was in the 2026 lead-up, but not in 2025, so it’s excluded from these comparisons. See Appendix A.
Conversion rate fell in almost all product categories, even where consumer spending grew
| Product category | Transactions (YoY change) | Conversion rate (YoY change) | Consumer spending (YoY change) |
|---|---|---|---|
| Apparel, Shoes & Accessories | +7% | −10% | +14% |
| Arts & Entertainment | −18% | −37% | −9% |
| Computers & Electronics | −3% | +16% | +20% |
| Flowers, Gifts, Food & Drink | −22% | −23% | 0% |
| Health & Beauty | +1% | −13% | +1% |
| Home & Garden | −1% | −24% | +11% |
| Sports, Outdoor & Fitness | −9% | −25% | −2% |
To see commission payouts by category, see Appendix D.
Arts & Entertainment saw the largest conversion rate decline (-37% YoY), followed by Sports, Outdoor & Fitness (-25% YoY) and Home & Garden (-24% YoY). Computers & Electronics was the exception, with conversion rate up 16% YoY.
Lower conversion rates didn’t mean lower consumer spending everywhere. Apparel, Shoes & Accessories (14%) and Home & Garden (11%) both grew consumer spending YoY despite the conversion rate declines. Home & Garden’s gain came from higher A, while Apparel’s came from both more transactions and higher AOV.
Several outside forces could help explain how shoppers approached each category:
- Cautious consumer sentiment: The University of Michigan’s October 2026 consumer sentiment index came in at 48.0, down -10.4% from October 2025. The Conference Board’s confidence index stood at 84.2 in September before rising to 91.7 in October, a rebound the Board tied to easing gasoline prices.
- Rising category prices: According to the Bureau of Labor Statistics’ (BLS) September 2026 Consumer Price Index for All Urban Consumers, apparel prices increased 3.4% over the 12 months through September and computers, peripherals, and smart home assistants 9.7%, while household furnishings rose just 0.2%. Higher electronics prices align with higher item value in Computers & Electronics.
3. Shoppers chose pricier items and kept their carts the same size
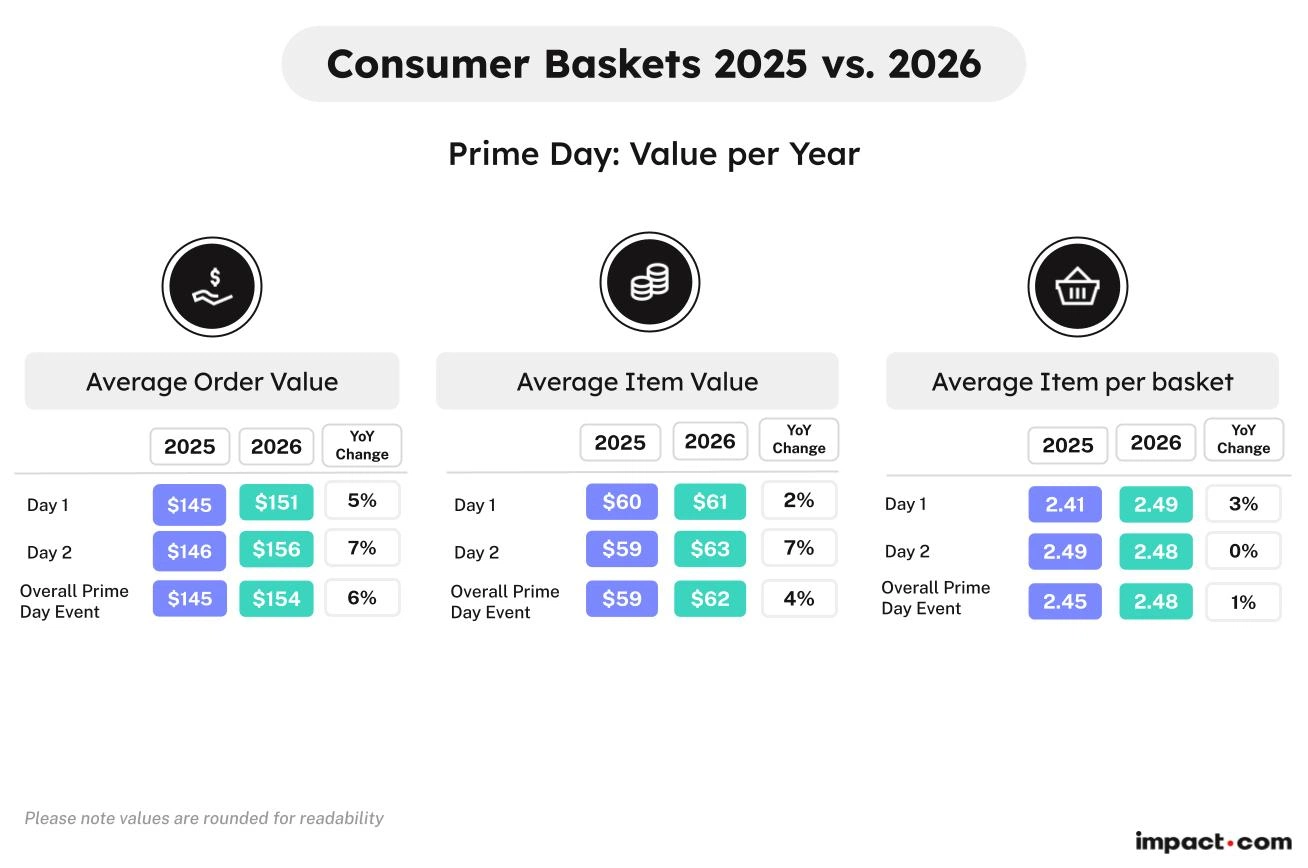
A higher AOV can mean one of two things: shoppers paid more per item, or they put more items in the cart. During October 2026’s Prime Day, it was mostly the first.
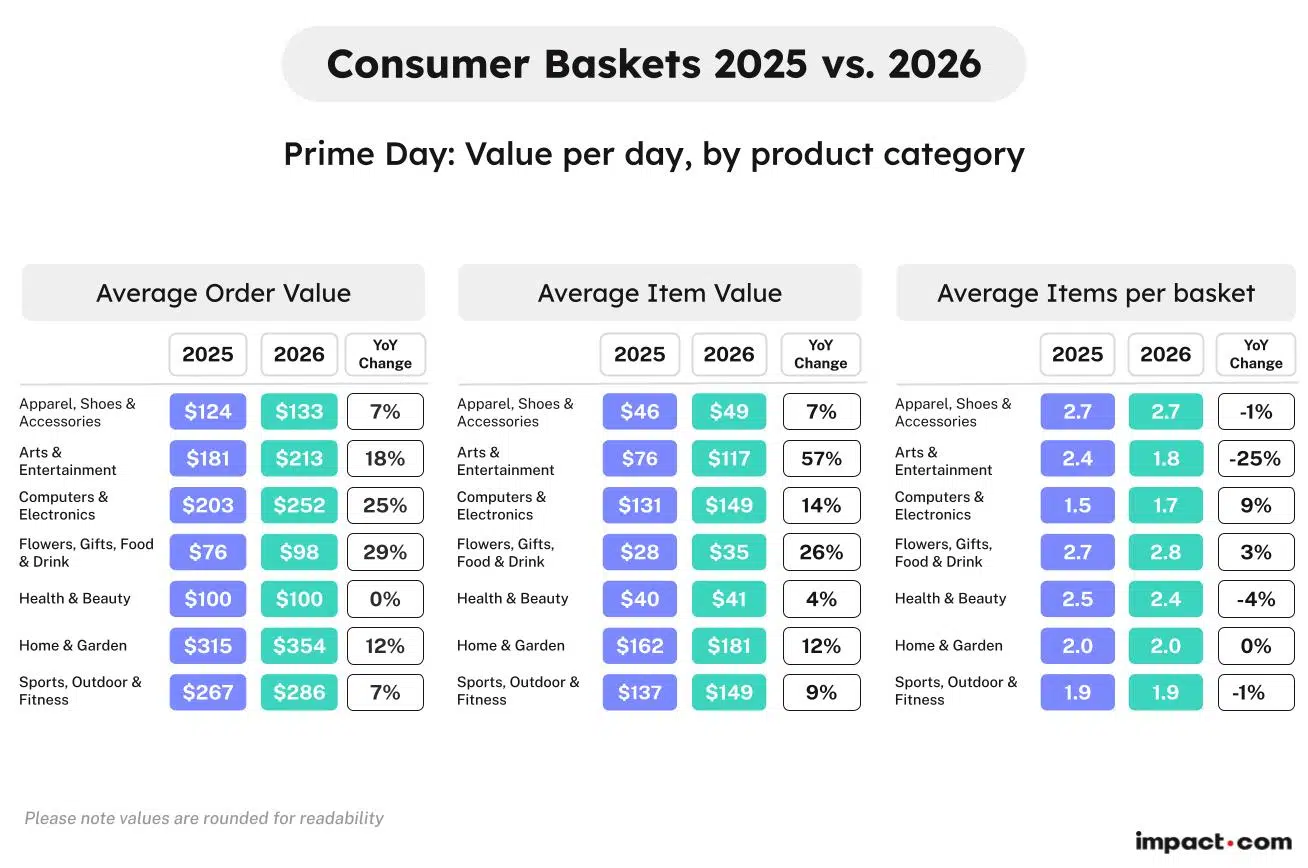
AOV increased 6% YoY, from $145 to $154, and higher item values drove most of the gain. Shoppers paid 4% more per item YoY. Meanwhile, the number of items in each basket barely moved, at 2.48 (up only 1% YoY).
Longer research, higher prices per item, and the same number of items per order could mean shoppers traded up on purchases they’d already planned instead of adding to them.
Inflation could also account for part of the gain. Prices increased 3.7% across all items, per the Bureau of Labor Statistics’ September 2026 consumer price index.
A brand that saw only the AOV lift might read it as a bundling win and build the wrong promotion.
Item value rose in every category, but basket size went up in only two
| Product category | Average order value (YoY change) | Average item value (YoY change) | Average items per basket (YoY change) |
|---|---|---|---|
| Computers & Electronics | +25% | +14% | +9% |
| Flowers, Gifts, Food & Drink | +29% | +26% | +3% |
| Arts & Entertainment | +18% | +57% | −25% |
To view every category, see Appendix E.
No category’s AOV decreased, and the three biggest gains came from different mixes of item value and basket size. The mix matters, because it can point to different promotions: bundles where baskets grew, higher-priced products where they didn’t.
The three product categories that stand out:
Computers & Electronics shoppers paid 14% more per item and bought 9% more items per order, lifting AOV 25% YoY. Rising prices likely played a part. BLS shows computers, peripherals, and smart home assistants up 9.7% over the 12 months through September.
Increased console demand could also have contributed. Aside from Apple’s recent product launches, US PlayStation 5 sales rose 22% in September, according to Circana data reported by Bloomberg, which tied the jump to anticipation for Grand Theft Auto VI’s November 19 launch. Prices and console demand don’t fully explain the larger baskets, which could point to accessories and add-ons bought with a higher-priced device.
Flowers, Gifts, Food & Drink posted the largest AOV gain (29% YoY), with item value up 26% and items per basket up 3% YoY.
Seasonal timing could be a factor. The National Retail Federation’s (NRF) 2026 Halloween survey expected a record $13.5 billion in spending, and the NRF’s 2026 holiday forecast projects November and December retail sales up 4.2%. Food prices rose just 2.5% over the year per BLS, so prices alone don’t explain the item value increase. Shoppers buying gifts and seasonal items early may have chosen premium options.
Arts & Entertainment shoppers put 25% fewer items in each basket (from 2.4 to 1.8) in 2026, yet paid 57% more per item, lifting AOV 18% YoY.
Ticket prices have been rising, though far more slowly than item value. BLS shows admissions to sporting events up 6.3% and to movies, theaters, and concerts up 2.5% over the 12 months through September. Those increases can’t explain a 57% jump, which more likely reflects a shift toward premium or high-demand events.
4. Each partner type reached shoppers at a different point in their decision
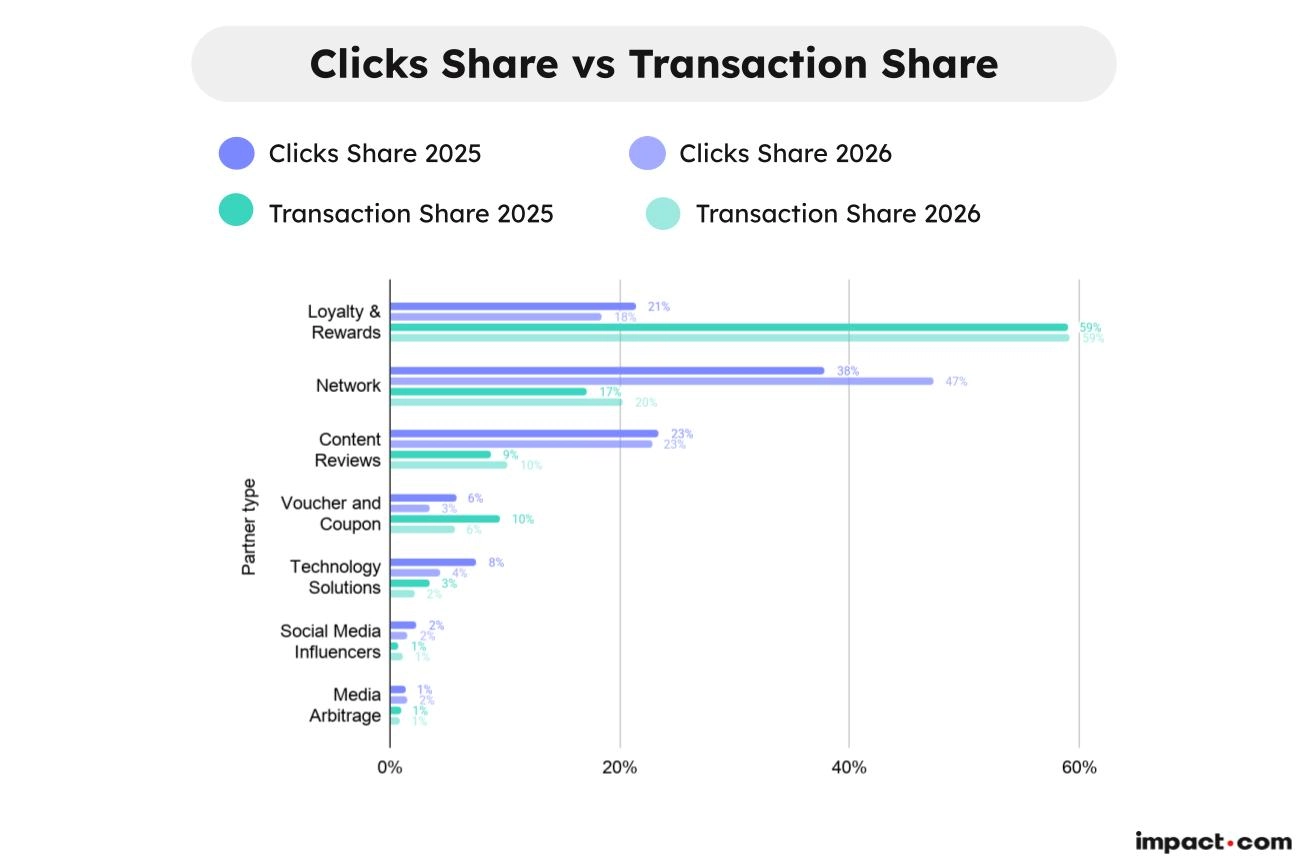
With the average journey running longer, partner types split by job. Comparing each partner’s share of clicks with its share of transactions shows where in the buyer’s journey they contributed most:
Network Partners grew their share across the board. They supplied the most clicks (47%, up from 38% in 2025) and also increased their share of transactions (17% to 20%), consumer spending (19% to 22%) and commission payouts (16% to 18%). Their share of transactions was well below their share of clicks, so they drove traffic more than conversions.
Loyalty and Rewards Partners’ shares of transactions (59%), consumer spending (54%), and commission payouts (43%) remained unchanged from 2025, while their share of clicks eased from 21% to 18%. Their share of transactions was 3.3x their share of clicks, so they converted more than they brought in traffic.
Content Review Partners held 23% of clicks and grew their share of transactions (9% to 10%), consumer spending (13% to 14%), and commission payouts (25% to 26%). Their share of transactions was well below their share of clicks—similar to Network Partners—so they drove traffic more than conversions.
Deal and Coupon Partners’ share fell on every measure YoY: clicks (6% to 3%), transactions (10% to 6%), consumer spending (9% to 6%), and commission payouts (5% to 3%). Their share of transactions was still twice their share of clicks, which may reflect shoppers who arrived ready to buy and wanted a discount.
Commerce Solutions Partners’ share fell on every measure, with clicks halving (8% to 4%) and transactions modestly declining (3% to 2%) from 2025 to 2026.
What we think this means: shoppers are deciding earlier and more deliberately
Three things in the data point the same way. Clicks rose 12% YoY while conversion rate fell 8% YoY, the average consumer journey ran 8.44 days this year vs. 8.07 days in 2025, and clicks ran above baseline for weeks before the event.
Our 2026 Cyber Week survey found the same pattern in what shoppers say: 47% begin holiday research in October or earlier, and 39% time purchases around major sales events.
Our read is that Prime Day’s partner-driven activity reflects shoppers researching earlier and buying when the right offer arrives. This dataset can’t separate that from outside factors such as Apple’s launches or price changes, but the measured behavior and the survey agree.
Treat the lead-up and the opening day as separate parts of your holiday marketing plan
October 2026’s Prime Day offers a peek at shopper behavior heading into the holiday season. The patterns to plan around: earlier research, lower conversion rate, and higher item values.
Black Friday and Cyber Monday, starting with Thanksgiving on November 26, are the next chance to see how buyers will approach major sales events. Brands that track the lead-up, the opening day, and each partner type’s role separately will be able to see where their own growth lands, instead of trying to decipher it from the event’s total outcomes.
The brands in a position to act on that are the ones that already have an offer, a partner brief, and tracking in place before the first day opens.
Appendix
Appendix A: Full methodology
The impact.com team tracked and analyzed key performance metrics — clicks, transactions, average order value, consumer spending, and brand spending for 1,286 North American brands in the Retail and Shopping vertical.
These metrics were tracked during October 6 – 7, 2026, the same time as Amazon’s Prime Day sale, and compared to last year’s sale dates of October 7-8, 2025. The month leading up to Amazon’s Prime Day sale was also tracked.
Both events ran for two days (Tuesday–Wednesday), with the 2026 event starting one day earlier in the calendar than the 2025 event.
To help keep this comparison fair, metrics covering the lead-up period are measured as the month immediately preceding and including each year’s event, rather than fixed calendar dates. This means the lead-up window moves with the event each year, preserving a consistent relationship between the lead-up period and Prime Day itself.
Appendix B: What the terminology means
| Term | Definition |
|---|---|
| Total brand spending | The sum of action-based (commission payouts) and non-action-based payments (bonuses, paid placement fees, etc). |
| Non-action based payment (Fixed expenses) | Brand expenditure that occurs when brands pay their partners, bonuses, paid placement fees, etc. |
| Action-based payment (commission) | Brand expenditure that occurs when brands pay their partners a commission for a specific, predefined action. |
| Network partners | Publisher platforms that broker access to brand campaigns and provide tracking, reporting, and payment services. This includes publishers categorized as network, syndication blog networks, or CPA networks. |
| Content review partners | Publishers that produce editorial content to promote, compare, and list products and services. This includes premium publishers, shopping comparisons, financial comparisons, content, bloggers, etc. |
| Loyalty and rewards partners | Publisher platforms that incentivize transactions from consumers, employees, or businesses through a membership or benefits reward program. |
| Voucher and coupon partners | Publishers who aggregate and classify coupons, vouchers and/or discounts for consumer savings. |
| Technology solutions (Commerce Solutions) | Innovative technological solutions that enhance the customer experience and drive conversions through various touchpoints, such as banking integrations, post-checkout offers, retargeting tools, or embedded software solutions |
| Media arbitrage | Search engine, social, or programmatic marketers that manage keyword campaigns for brands, often on a performance basis. |
| Cross-audience monetization | Businesses that publish offers, content, and complementary (non-competing) products to current customers or audiences (e.g., exit traffic, improved UX) to drive incremental revenue. |
| Analysis period | Prime Day Sales event: October, 7-8, 2025 vs.October, 6-7, 2026.The month leading up to and including Prime Day: September 8 to October 8, 2025 vs September 7 to October 7, 2026 |
Appendix C: How to interpret the graphs
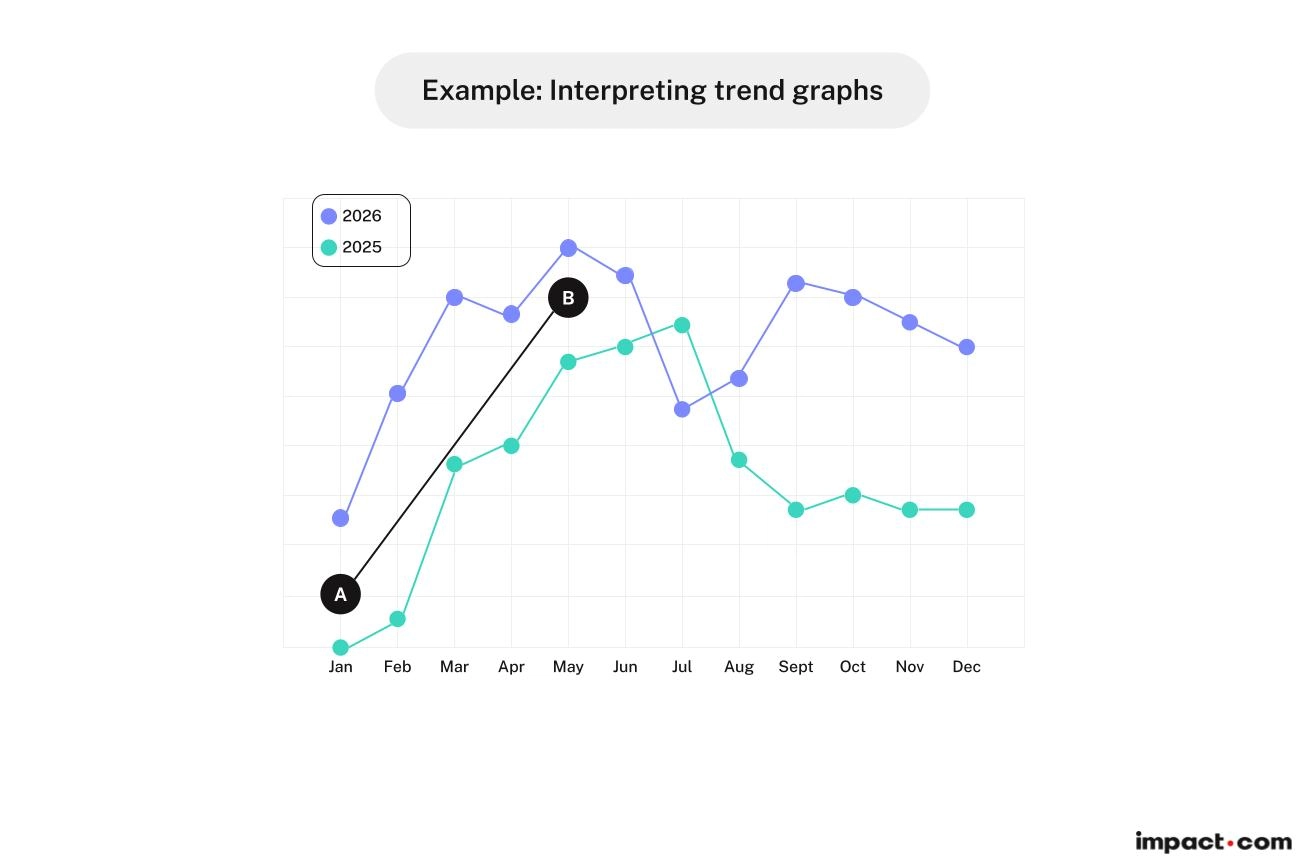
This chart is an example of how to interpret the trend charts found in this report.
All growth in this chart is calculated from Value A, the baseline value.
In this example, Value A represents the metric’s value in January 2026, and Value B represents its value in May 2026 relative to the baseline value, Value A.
Value A, the baseline value, is $4, and the metric’s value in May 2026 is $12.
The percentage growth in January 2025 is 0% (($4 – $4) / $4) * 100.
The percentage change from the baseline value (Value A) to May 2026 (Value B) is 200% calculated as follows: (($12 – $4) / $4) * 100.
Appendix D: Commission payouts by product category, 2025 vs 2026
| Category | Commission payouts (YoY change) | Consumer spending (YoY change) |
|---|---|---|
| Apparel, Shoes & Accessories | +23% | +14% |
| Arts & Entertainment | −20% | −9% |
| Computers & Electronics | −7% | +20% |
| Flowers, Gifts, Food & Drink | +15% | 0% |
| Health & Beauty | +39% | +1% |
| Home & Garden | +10% | +11% |
| Sports, Outdoor & Fitness | +4% | −2% |
Appendix E: Consumer baskets 2025 vs. 2026 by product category